1050 Watson Dr · Cottonwood, AZ
Flood risk 1/10 · Minimal
- FEMA flood zone
- X (unshaded)
- Chance of flooding over 30 yrs
- 0.0%
- Est. flood insurance / yr
- $507 – $1,088
Fire risk 5/10 · Moderate
- Est. fire insurance / yr
- $610 – $1,132
Heat risk 6/10 · Moderate
- Hot days now (above 103°F)
- 8 days/yr
- Hot days in 30 yrs
- 20 days/yr
Wind risk 1/10 · Minimal
- Chance of severe wind over 30 yrs
- —
Air-quality risk 1/10 · Minimal
- Unhealthy air days now
- 0 days/yr
- Unhealthy air days in 30 yrs
- 0 days/yr
Risk factors via First Street. Map © Google.
Why this score? — see what drove the D- grade
The composite is a weighted blend of 9 inputs, each scored 0–100. Each bar is that input's sub-score; the figure is the points it added to the 100-point composite (weight × sub-score).
- Cash flow +18.2/30.0
- DSCR +5.7/10.0
- 1% rule +4.9/10.0
- Livability +4.0/5.0
- Condition / age +2.5/5.0
- Rent growth +2.4/5.0
- Schools +1.9/10.0
- ARV discount +0.0/15.0
- Appreciation +0.0/10.0
$235,000
🖨 Deal sheet 📄 Offer letter ✓ Due diligence
Key facts
- Built 2025
- Listed 350 days
Property features AI
Finance
- Financial info: List price $235,000
Exterior
- Home design: Single-family property (spec/inventory)
- Construction: Built/listed as a spec home
Interior
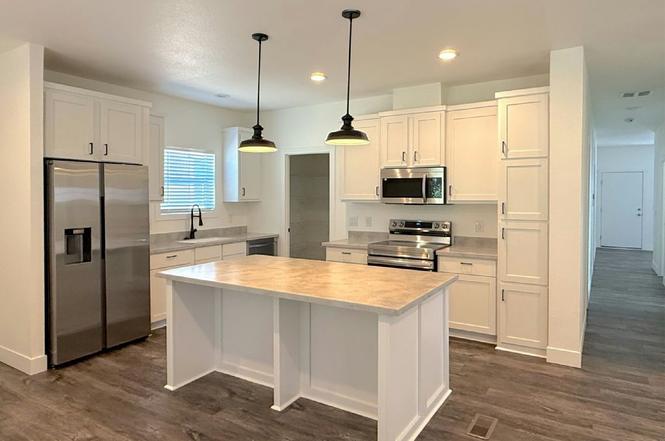
- Bedrooms: 3 bedrooms
- Bathrooms: 2 full bathrooms
- Interior features: Living area approximately 1,440 (listed)
Neighborhood map
What this means for you Summary
Snapshot
- This is a 3-bed/2.0-bath manufactured listed at $235k.
Deal economics
- At list price, monthly cash flow is $210 ($3k/yr) — positive.
- The deal already cash-flows at list — no discount required.
- To meet the 1% rule (rent ≥ 1% of price), the offer needs to be $232k (1.2% below list).
- Recommended offer: $207k (12.0% below list) — sets the bar for market timing.
- Cap rate 7.4% vs local median 3.8% in Cottonwood — top-decile yield for the area; either an underpriced asset or a hidden risk that comps aren't pricing in. Stress-test before assuming the spread holds.
Location & tenants
- Location reads 79/100 on livability (#7 in AZ, #2,176 nationally) — a middle-class / working-renter tenant base. Strengths: health & safety A+, commute A, cost of living A; Watch: employment D, amenities F.
- Cottonwood-Oak Creek Elementary District (4487) (town): math 17% / reading 28% proficiency, ranked #174 of 249 in AZ (top 70%) — low school quality limits family demand, transient renter base, plan for 1-2y turnover.
- Market conditions: Rents soft (-0.2%/yr); 266 active listings in the ZIP; 4 comparable units currently listed for rent nearby; rentals leasing fast (median 14d on market — plan ~1-2 weeks tenant-placement turnaround); 2,062 units permitted in Yavapai County in 2024 (98 in 5+ unit buildings).
- At $2,322/mo this rent would consume 49% of the median local household income ($57k/yr) (locally 894% of renters already pay >50% of income on rent) — very limited rent-growth headroom before tenants either downsize or default.
Forward outlook
- Local home prices are declining (-3.0%/yr); year-one equity from $2k of loan paydown is wiped out by about $7k of value loss. Plan a longer hold.
- Yavapai County population projected at +10% by 2050 — modest demand growth; plan on rents tracking national, not racing it.
Negotiation context
- It's been on market 350 days — a 12% lower offer ($207k) is reasonable based on typical stale-listing flexibility.
Risks & watch-outs
- Climate carrying-cost: moderate wildfire risk; extreme-heat days projected 8→20/yr by 2055 (HVAC capex compounding) — expect insurance premiums to compound above CPI over the hold.
Questions for the listing agent
- It's been on market 350 days. Have you received any prior offers? Is the seller open to a 12% concession, seller financing, or rate buy-down credit?
- Why hasn't it sold? Are there any deal-killer items the seller is aware of (foundation, flood, title, zoning, code violations)?
- Is there a deadline driving the sale (1031 exchange, divorce, estate, relocation)? That informs how much negotiation room exists.
- The area grade is low — what's the realistic commute time and amenity access for the typical tenant pool here? Any planned neighborhood developments (good or bad) we should know about?
- What's the average days-on-market for RENTAL listings here right now (not sales)? A rising rental-DOM trend means longer vacancies and softer asking-rent achievability than the comps imply.
- What's the recent tenant-quality profile in this submarket — average credit score on applications, eviction rate, late-payment / NSF rate, and stable-employment percentage? A property-management company in the area should have these aggregated.
- How much new for-sale + rental construction is in the pipeline within 1–3 miles? Heavy new supply typically softens prices + rents 12–24 months out; constrained supply supports both.
Investment metrics
- 1% rule
- 0.99% ✗
- Cap rate
- 7.37%
- Cash-on-cash
- 3.83%
- DSCR
- 1.17
- GRM
- 8.4
CMA / ARV
- ARV (on-the-fly)
- $180,000
- Comps found
- 12
Show comp detail 12 sales within ~0.75 mi
| Address | Dist | Beds/Ba | Sqft | Sold | Price | $/sf | Match |
|---|---|---|---|---|---|---|---|
| 1065 Crenshaw Ave | 0.10mi | 3/2.0 | 1,440 (0%) | 2mo | $180,000 | $125 | 94 |
| 992 Trevino Dr | 0.26mi | 3/2.0 | 1,431 (-1%) | 3mo | $195,000 | $136 | 84 |
| 972 Trevino Dr | 0.25mi | 3/2.0 | 1,382 (-4%) | 2mo | $179,900 | $130 | 80 |
| 2050 W St Route 89a -- #273 | 0.38mi | 3/2.0 | 1,440 (0%) | 7mo | $150,000 | $104 | 76 |
| 2050 W SR 89a -- #104 | 0.38mi | 2/2.0 (-1) | 1,456 (+1%) | 1mo | $118,000 | $81 | 74 |
| 880 W On The Greens Blvd | 0.07mi | 3/2.0 | 1,620 (+12%) | 2mo | $249,900 | $154 | 74 |
| 1024 Rankin Ave | 0.22mi | 3/2.0 | 1,605 (+12%) | 2mo | $199,900 | $125 | 69 |
| 1216 Hogan Dr | 0.20mi | 2/2.0 (-1) | 1,600 (+11%) | 1mo | $248,000 | $155 | 67 |
| 2050 W State Route 89a -- #158 | 0.38mi | 3/2.0 | 1,334 (-7%) | 5mo | $130,000 | $97 | 66 |
| 2050 W State Route 89a -- #86 | 0.57mi | 3/2.0 | 1,344 (-7%) | 2mo | $35,000 | $26 | 60 |
| 2050 W State Route 89-a -- #92 | 0.57mi | 3/2.0 | 1,344 (-7%) | 4mo | $145,000 | $108 | 59 |
| 2050 W SR 89-a -- #96 | 0.57mi | 3/2.0 | 1,568 (+9%) | 1mo | $155,000 | $99 | 58 |
Match score weights: distance 35% · size 25% · config 20% · recency 20%. Top-matched comps best support the ARV.
Projected returns pro-forma
-3.0% appreciation · 0.0% rent growth · sell at horizon
- IRR
- -13.7%
- Equity multiple
- 0.52×
- Total profit
- $-31,469
- Equity at exit
- $35,039
- IRR
- -10.5%
- Equity multiple
- 0.45×
- Total profit
- $-36,327
- Equity at exit
- $20,319
Cash invested: $65,800 (down + closing). Projections, not guarantees.
Landlord ↔ Tenant lean methodology
- Overall (STATE)
- 87 Strongly Landlord-Friendly
- State Arizona
- 87 Strongly Landlord-Friendly · R+3
- County
- — inherits STATE
- City
- — inherits STATE
ZIP-level market 86326
- Home prices YoY
- -32.2%
- Rents YoY
- -0.2%
- Active inventory
- 266
- Price-to-rent
- 8.4×
Monthly cashflow live
- Estimated rent
- $2,322 medium interval (Pro) →
- Mortgage (P&I)
- −$1,232
- Tax est. 1.5%
- −$294 /mo · $3,525/yr
- Insurance
- −$98
- HOA
- −$0
- Vacancy / Maint / Mgmt
- −$488
- Net cashflow
- $210
Break-even live
UW: 25.0% down · 7.5% · 30yr · 1.5% tax · 5.0% vac · 8.0% maint · 8.0% mgmt
Financing live
Cash to close
- Down payment
- $58,750
- Closing costs
- $7,050
- Reserves months
- —
- Total cash needed
- —
Loan-product check · same deal, 3 products live
Conventional
25% down · 7.5% · 30yr
- Down + closing
- —
- Monthly P&I
- —
- Monthly cashflow
- —
- DSCR
- —
- Eligible?
- —
Personal DTI + credit; lowest rate.
DSCR
20% down · 8.5% · 30yr
- Down + closing
- —
- Monthly P&I
- —
- Monthly cashflow
- —
- DSCR
- —
- Eligible?
- —
No personal income docs; deal must DSCR.
Hard money
10% down · 12.0% · 12mo
- Down + closing
- —
- Monthly P&I
- —
- Monthly cashflow
- —
- DSCR
- —
- Eligible?
- —
Short-term bridge; refi at stabilization.
Rent comps 4 comps
| Address | Beds | Baths | Sqft | Rent | $/sqft | DOM | Units | Dist |
|---|---|---|---|---|---|---|---|---|
| 992 Sterling Ln Cottonwood, AZ | 3.0 | 2.0 | 1652 | $2,395 | $1.45 | 21d | 1 | 0.40mi |
| 255 S Cottonwood Ranch Rd Cottonwood, AZ | 3.0 | 2.0 | 1695 | $2,195 | $1.29 | 13d | 1 | 1.16mi |
| 1910 W Trail Blazer Dr Cottonwood, AZ | 2.0 | 2.0 | 1278 | $2,900 | $2.27 | 13d | 1 | 1.17mi |
| 133 S 8th Pl Cottonwood, AZ | 2.0 | 2.0 | 1017 | $1,700 | $1.67 | 13d | 1 | 1.42mi |
Listing history 16 events
-
2026-06-18days on market $235,000 Active 350 DOM
-
2026-06-17days on market $235,000 Active 349 DOM
-
2026-06-16days on market $235,000 Active 348 DOM
-
2026-06-15days on market $235,000 Active 347 DOM
-
2026-06-14days on market $235,000 Active 345 DOM
-
2026-06-13days on market $235,000 Active 344 DOM
-
2026-06-10days on market $235,000 Active 342 DOM
-
2026-06-09days on market $235,000 Active 341 DOM
-
2026-06-08days on market $235,000 Active 340 DOM
-
2026-06-07days on market $235,000 Active 339 DOM
-
2026-06-05days on market $235,000 Active 336 DOM
-
2026-06-03days on market $235,000 Active 335 DOM
-
2026-06-02days on market $235,000 Active 334 DOM
-
2026-06-01days on market $235,000 Active 333 DOM
-
2026-05-31days on market $235,000 Active 332 DOM
-
2026-05-30days on market $235,000 Active 331 DOM
ⓘ Source: listings_history table (triggers on properties + properties_extension) + one-shot
backfill from property_details.listing_events for pre-trigger history.
Climate risk First Street
- Flood 1/10 Low FEMA zone X (unshaded) · 0% chance over 30 yrs
- Wildfire 5/10 Major
- Heat 6/10 Major 8 d/yr ≥103°F today · 20 d/yr by 30 yrs out
- Wind 1/10 Low
- Air quality 1/10 Low 0 unhealthy d/yr today · 0 by 30 yrs out
Nearby sold comps map
Loading sold comps map…
Walkable amenities ~0.75 mi
Loading nearby amenities…
Taxation est. · year 1
- Rental income
- $27,860
- − Mortgage interest
- −$13,164
- − Property taxes
- −$3,525
- − Insurance
- −$1,175
- − Repairs & maintenance
- −$2,229
- − Management
- −$2,229
- − Depreciation
- −$6,836
- Taxable loss
- −$1,298
- Est. tax savings @ 24.0%
- +$311
- After-tax cash flow
- $2,832/yr
For passive investors: Depreciation is non-cash, so a rental often shows a tax loss while cash-flowing — sheltering income. Rental losses are passive: they offset passive income freely, and up to $25,000/yr can offset ordinary (W-2) income if you actively participate and your MAGI is under $100k (phasing out to $0 by $150k); unused losses carry forward. On sale, claimed depreciation is recaptured at up to 25%, and gains may owe capital-gains tax (a 1031 exchange can defer both). Figures are a year-1 estimate at your 24.0% rate — not tax advice; consult a CPA.
Schools (NCES district)
- District
- Cottonwood-Oak Creek Elementary District (4487)
- NCES district ID
- 0402370
- Math proficiency
- 17% ▼ -10.00%
- Reading proficiency
- 28% ▼ -7.00%
- Median HH income
- $41,740
- Composite
- 19.16/100
- National rank
- #8822
- State rank
- #174 of 249 in AZ
Livability — Cottonwood
- Score
- 79/100
- State rank
- #7
- US rank
- #2176
Category grades
Schools grade is shown separately in the Schools card above.
Census & demographics
- Census place
- Cottonwood, AZ
- County
- Yavapai County · 190,406 people
- City population
- 24,852
- Metro
- Prescott Valley-Prescott, AZ
- Population (ZIP)
- 24,852
- Household income
- $57,378
- Rent vs Own
- Severe rent burden
- 894.0
Population outlook (Yavapai County) Hauer SSP2
- Today (2025)
- 241,389 people
- By 2030
- 249,523 · +3.4%
- By 2040
- 259,966 · +7.7%
- By 2050
- 264,736 · +9.7%
- By 2075
- 269,334 · +11.6%
- By 2100
- 256,505 · +6.3%
Race, ethnicity, and origin ACS 2023
- Neighborhood character
- Predominantly White (73%)
- Race & ethnicity
- White 73% Hispanic / Latino 20% Two or more races 14% Native American 1%
- Hispanic origin (detail)
- Mexican 17%
- Common ancestry
- Italian 3% Romanian 3% Lithuanian 2%
- Foreign-born
- 12% · Canada
- Languages at home
- 84% English-only · Spanish 14% German/W. Germanic 1%
Political lean MEDSL · Yavapai
- 2024 margin
- Solid R (+33.9) · D 32.6% · R 66.5%
- 2008→2024 swing
- -9.5pp toward R · 2008: -24.4pp · 2024: -33.9pp
- All cycles
- 2024: R+33.9 2020: R+29.3 2016: R+31.4 2012: R+30.7 2008: R+24.4
Not yet ingested
- Civics
- —
Market trends
- HPI YoY
- ▼ -165.27%
- Current HPI
- 347.5058
- Rent YoY
- ▼ -0.22%
- Metro
- Prescott Valley-Prescott, AZ
- State GDP YoY
- ▲ 4.54%
- F500 in state
- 20
Industry mix (Fortune 500 HQ in AZ)
| Industry | F500 HQs | Revenue |
|---|---|---|
| Technology | 2 | $13B |
|
||
| Mining / Metals | 1 | $23B |
|
||
| Environmental Services | 1 | $16B |
|
||
| Metals / Steel | 1 | $14B |
|
||
| Technology Distribution | 1 | $9B |
|
||
| Homebuilding | 1 | $8B |
|
||
Cash-flow waterfall
monthlySold comps — $/sqft
last 12 mo · ≤1 miLoading sold comps…