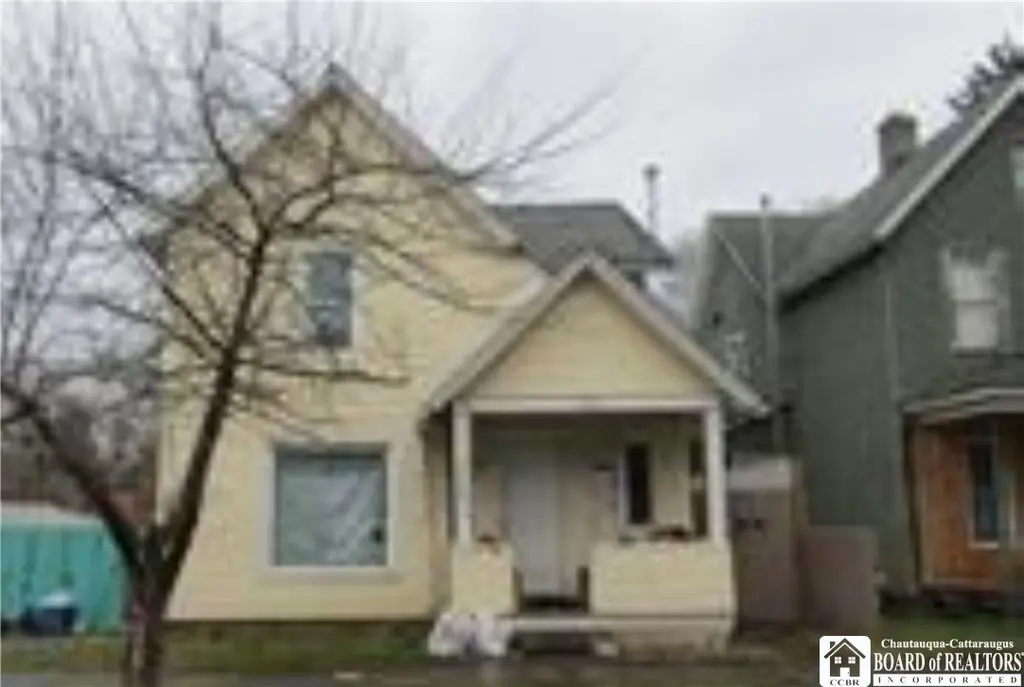
124 W Green St · Olean, NY
Flood risk 6/10 · Moderate
- FEMA flood zone
- X (shaded)
- Chance of flooding over 30 yrs
- 0.27%
- Est. flood insurance / yr
- $473 – $860
Fire risk 3/10 · Minor
- Est. fire insurance / yr
- $691 – $1,283
Heat risk 2/10 · Minimal
- Hot days now (above 90°F)
- 8 days/yr
- Hot days in 30 yrs
- 19 days/yr
Wind risk 1/10 · Minimal
- Chance of severe wind over 30 yrs
- —
Air-quality risk 1/10 · Minimal
- Unhealthy air days now
- 0 days/yr
- Unhealthy air days in 30 yrs
- 0 days/yr
Risk factors via First Street. Map © Google.
Why this score? — see what drove the D grade
The composite is a weighted blend of 9 inputs, each scored 0–100. Each bar is that input's sub-score; the figure is the points it added to the 100-point composite (weight × sub-score).
- Cash flow +15.0/30.0
- ARV discount +7.5/15.0
- 1% rule +5.0/10.0
- DSCR +5.0/10.0
- Livability +3.6/5.0
- Schools +3.5/10.0
- Rent growth +2.5/5.0
- Condition / age +2.5/5.0
- Appreciation +0.0/10.0
$24,900
🖨 Deal sheet 📄 Offer letter ✓ Due diligence
Listing remarks MLS
Trash out of main house, complicated, CastleRock REO will not prorate for back taxes, water or any other charges at sale. Buyer responsible for back taxes, water and for paying all associated costs as part of their purchase price. Seller to provide their own contract and all addendums after offer is accepted, POF and EMD required for all offers to be submitted.
Key facts
- 7,750 sq ft lot
- 2 garage spots
- Built 1890
Neighborhood map
What this means for you Summary
Snapshot
- This is a 3-bed/1.0-bath single-family listed at $25k.
Deal economics
- At list price, monthly cash flow is $895 ($11k/yr) — positive.
- The deal already cash-flows at list — no discount required.
- Meets the 1% rule at list price ($1k rent vs $25k).
- Recommended offer: $22k (12.0% below list) — sets the bar for market timing.
- Cap rate 49.4% vs local median 8.0% in Olean — top-decile yield for the area; either an underpriced asset or a hidden risk that comps aren't pricing in. Stress-test before assuming the spread holds.
Location & tenants
- Location reads 72/100 on livability (#353 in NY) — a middle-class / working-renter tenant base. Strengths: cost of living A+, housing A+, health & safety A+; Watch: crime F, amenities F, commute F.
- Olean City School District (town): math 40% / reading 43% proficiency, ranked #511 of 590 in NY (top 87%) — families likely to look elsewhere, expect single-tenant / working-renter base with shorter leases.
- Market conditions: 141 active listings in the ZIP; 128 units permitted in Cattaraugus County in 2024 (21 in 5+ unit buildings).
Forward outlook
- Local home prices are declining (-3.0%/yr); year-one equity from $172 of loan paydown is wiped out by about $747 of value loss. Plan a longer hold.
- Cattaraugus County population projected at -28% by 2050 — secular population decline; favor cash flow + early exit over multi-decade hold.
- At projected returns (-3.0% appreciation + 3.0% rent growth), your $7k cash investment doubles in ~1 year — after that, you're playing with house money.
Negotiation context
- It's been on market 365 days — a 12% lower offer ($22k) is reasonable based on typical stale-listing flexibility.
- 6 sale attempts since 16y ago; this cycle's ask is 25% above the opening price — seller raised mid-cycle; expect resistance to lowballs.
Risks & watch-outs
- Watch-outs: built in 1890 — expect roof / HVAC / electrical / plumbing capex.
- Climate carrying-cost: major flood risk — expect insurance premiums to compound above CPI over the hold.
Questions for the listing agent
- It's been on market 365 days. Have you received any prior offers? Is the seller open to a 12% concession, seller financing, or rate buy-down credit?
- Built in 1890 — when were the roof, HVAC, electrical panel, plumbing, and water heater last replaced?
- Why hasn't it sold? Are there any deal-killer items the seller is aware of (foundation, flood, title, zoning, code violations)?
- Is there a deadline driving the sale (1031 exchange, divorce, estate, relocation)? That informs how much negotiation room exists.
- Schools are B-rated — typically a magnet for longer-tenancy family renters. What's the average tenant stay here, and is there a school-zone premium baked into asking?
- Crime grade is F in this area — have there been break-ins, vandalism, or insurance claims at this property in the last 3 years? What carrier currently insures it and at what premium?
- The area grade is low — what's the realistic commute time and amenity access for the typical tenant pool here? Any planned neighborhood developments (good or bad) we should know about?
- What's the average days-on-market for RENTAL listings here right now (not sales)? A rising rental-DOM trend means longer vacancies and softer asking-rent achievability than the comps imply.
- What's the recent tenant-quality profile in this submarket — average credit score on applications, eviction rate, late-payment / NSF rate, and stable-employment percentage? A property-management company in the area should have these aggregated.
- How much new for-sale + rental construction is in the pipeline within 1–3 miles? Heavy new supply typically softens prices + rents 12–24 months out; constrained supply supports both.
Investment metrics
- 1% rule
- 5.42% ✓
- Cap rate
- 49.41%
- Cash-on-cash
- 153.99%
- DSCR
- 7.85
- GRM
- 1.5
CMA / ARV
- ARV (median comp)
- $93,394
- List price
- $24,900
- Delta
- -73.34%
- Verdict
- UNDERPRICED
- Comps
- 20 within 1.0 mi
Show comp detail 12 sales within ~0.75 mi
| Address | Dist | Beds/Ba | Sqft | Sold | Price | $/sf | Match |
|---|---|---|---|---|---|---|---|
| 309 S 3rd St | 0.12mi | 3/1.0 | 1,270 (-10%) | 5mo | $10,000 | $8 | 75 |
| 119 W Green St | 0.02mi | 2/1.0 (-1) | 1,278 (-9%) | 9mo | $85,000 | $67 | 71 |
| 123 S 4th St | 0.26mi | 2/1.0 (-1) | 1,300 (-8%) | 4mo | $90,000 | $69 | 66 |
| 130 S 6th St | 0.37mi | 3/2.0 | 1,320 (-6%) | 10mo | $150,000 | $114 | 61 |
| 114 Virginia St | 0.50mi | 4/2.0 (+1) | 1,463 (+4%) | 3mo | $220,000 | $150 | 58 |
| 625 S Union St | 0.31mi | 3/2.5 | 1,306 (-7%) | 12mo | $67,000 | $51 | 58 |
| 708 Irving St | 0.35mi | 3/1.5 | 1,232 (-12%) | 5mo | $25,000 | $20 | 57 |
| 108 Fulton St | 0.37mi | 3/2.0 | 1,560 (+11%) | 6mo | $69,900 | $45 | 55 |
| 112 S 7th St | 0.45mi | 2/1.5 (-1) | 1,516 (+8%) | 5mo | $150,000 | $99 | 55 |
| 126 N 8th St | 0.56mi | 3/1.5 | 1,552 (+10%) | 9mo | $144,000 | $93 | 47 |
| 568 York St | 0.71mi | 3/1.5 | 1,248 (-11%) | 8mo | $150,000 | $120 | 40 |
| 118 N 11th St | 0.69mi | 4/1.5 (+1) | 1,314 (-6%) | 12mo | $76,000 | $58 | 40 |
Match score weights: distance 35% · size 25% · config 20% · recency 20%. Top-matched comps best support the ARV.
Projected returns pro-forma
-3.0% appreciation · 3.0% rent growth · sell at horizon
- IRR
- —
- Equity multiple
- 8.60×
- Total profit
- $52,969
- Equity at exit
- $3,713
- IRR
- —
- Equity multiple
- 18.15×
- Total profit
- $119,582
- Equity at exit
- $2,153
Cash invested: $6,972 (down + closing). Projections, not guarantees.
Landlord ↔ Tenant lean methodology
- Overall (STATE)
- 15 Strongly Tenant-Friendly
- State New York
- 15 Strongly Tenant-Friendly · D+10
- County
- — inherits STATE
- City
- — inherits STATE
ZIP-level market 14760
- Home prices YoY
- -7.7%
- Active inventory
- 141
- Price-to-rent
- 1.5×
Monthly cashflow live
- Estimated rent
- $1,350 medium interval (Pro) →
- Mortgage (P&I)
- −$131
- Tax est. 1.5%
- −$31 /mo · $374/yr
- Insurance
- −$10
- HOA
- −$0
- Vacancy / Maint / Mgmt
- −$284
- Net cashflow
- $895
Break-even live
UW: 25.0% down · 7.5% · 30yr · 1.5% tax · 5.0% vac · 8.0% maint · 8.0% mgmt
Financing live
Cash to close
- Down payment
- $6,225
- Closing costs
- $747
- Reserves months
- —
- Total cash needed
- —
Loan-product check · same deal, 3 products live
Conventional
25% down · 7.5% · 30yr
- Down + closing
- —
- Monthly P&I
- —
- Monthly cashflow
- —
- DSCR
- —
- Eligible?
- —
Personal DTI + credit; lowest rate.
DSCR
20% down · 8.5% · 30yr
- Down + closing
- —
- Monthly P&I
- —
- Monthly cashflow
- —
- DSCR
- —
- Eligible?
- —
No personal income docs; deal must DSCR.
Hard money
10% down · 12.0% · 12mo
- Down + closing
- —
- Monthly P&I
- —
- Monthly cashflow
- —
- DSCR
- —
- Eligible?
- —
Short-term bridge; refi at stabilization.
Listing history 38 events
-
2026-06-18days on market $24,900 Active 365 DOM
-
2026-06-17days on market $24,900 Active 364 DOM
-
2026-06-16days on market $24,900 Active 363 DOM
-
2026-06-15days on market $24,900 Active 362 DOM
-
2026-06-13days on market $24,900 Active 360 DOM
-
2026-06-12days on market $24,900 Active 359 DOM
-
2026-06-09days on market $24,900 Active 356 DOM
-
2026-06-08days on market $24,900 Active 355 DOM
-
2026-06-07days on market $24,900 Active 354 DOM
-
2026-06-07days on market $24,900 Active 353 DOM
-
2026-06-04days on market $24,900 Active 350 DOM
-
2026-06-02days on market $24,900 Active 349 DOM
-
2026-06-01days on market $24,900 Active 348 DOM
-
2026-05-31days on market $24,900 Active 347 DOM
-
2026-02-28price $24,900 363-char remark
Show marketing remark (363 chars)
Trash out of main house, complicated, CastleRock REO will not prorate for back taxes, water or any other charges at sale. Buyer responsible for back taxes, water and for paying all associated costs as part of their purchase price. Seller to provide their own contract and all addendums after offer is accepted, POF and EMD required for all offers to be submitted.
-
2025-09-29price $13,900 363-char remark
Show marketing remark (363 chars)
Trash out of main house, complicated, CastleRock REO will not prorate for back taxes, water or any other charges at sale. Buyer responsible for back taxes, water and for paying all associated costs as part of their purchase price. Seller to provide their own contract and all addendums after offer is accepted, POF and EMD required for all offers to be submitted.
-
2025-08-22price $14,900 363-char remark
Show marketing remark (363 chars)
Trash out of main house, complicated, CastleRock REO will not prorate for back taxes, water or any other charges at sale. Buyer responsible for back taxes, water and for paying all associated costs as part of their purchase price. Seller to provide their own contract and all addendums after offer is accepted, POF and EMD required for all offers to be submitted.
-
2025-06-17$19,900 Active 363-char remark
Show marketing remark (363 chars)
Trash out of main house, complicated, CastleRock REO will not prorate for back taxes, water or any other charges at sale. Buyer responsible for back taxes, water and for paying all associated costs as part of their purchase price. Seller to provide their own contract and all addendums after offer is accepted, POF and EMD required for all offers to be submitted.
-
2025-05-15historical
-
2025-02-10price $19,900
-
2025-01-17price $23,900
-
2024-12-28price $26,900
-
2024-11-15price $29,900
-
2024-06-18price $33,900
-
2024-06-03price $36,900
-
2024-05-09status Active
-
2024-02-27status Pending
-
2024-02-01$39,900 Active
-
2024-01-02historical
-
2023-10-26$49,900 Active
-
2023-10-11soldstatus $23,100
-
2013-08-12soldstatus $48,000
-
2013-08-09soldstatus $48,000
-
2012-04-05$49,900
-
2011-05-15soldstatus $43,000
-
2011-05-13soldstatus $43,000
-
2010-01-29$49,900
-
2007-09-13soldstatus $40,000
ⓘ Source: listings_history table (triggers on properties + properties_extension) + one-shot
backfill from property_details.listing_events for pre-trigger history.
Climate risk First Street
- Flood 6/10 Major FEMA zone X (shaded) · 27% chance over 30 yrs
- Wildfire 3/10 Moderate
- Heat 2/10 Low 8 d/yr ≥90°F today · 19 d/yr by 30 yrs out
- Wind 1/10 Low
- Air quality 1/10 Low 0 unhealthy d/yr today · 0 by 30 yrs out
Nearby sold comps map
Loading sold comps map…
Walkable amenities ~0.75 mi
Loading nearby amenities…
Taxation est. · year 1
- Rental income
- $16,204
- − Mortgage interest
- −$1,395
- − Property taxes
- −$374
- − Insurance
- −$124
- − Repairs & maintenance
- −$1,296
- − Management
- −$1,296
- − Depreciation
- −$724
- Taxable income
- $10,994
- Est. tax owed @ 24.0%
- −$2,639
- After-tax cash flow
- $8,098/yr
For passive investors: Depreciation is non-cash, so a rental often shows a tax loss while cash-flowing — sheltering income. Rental losses are passive: they offset passive income freely, and up to $25,000/yr can offset ordinary (W-2) income if you actively participate and your MAGI is under $100k (phasing out to $0 by $150k); unused losses carry forward. On sale, claimed depreciation is recaptured at up to 25%, and gains may owe capital-gains tax (a 1031 exchange can defer both). Figures are a year-1 estimate at your 24.0% rate — not tax advice; consult a CPA.
Schools (NCES district)
- District
- Olean City School District
- NCES district ID
- 3621720
- Math proficiency
- 40% ▼ -10.00%
- Reading proficiency
- 43% ▼ -3.00%
- Median HH income
- $40,365
- Composite
- 34.81/100
- National rank
- #5104
- State rank
- #511 of 590 in NY
Livability — Olean
- Score
- 72/100
- State rank
- #353
- US rank
- #5930
Category grades
Schools grade is shown separately in the Schools card above.
Census & demographics
- Census place
- Olean, NY
- City population
- 17,272
- Population (ZIP)
- 17,272
Population outlook (Cattaraugus County) Hauer SSP2
- Today (2025)
- 71,623 people
- By 2030
- 67,751 · -5.4%
- By 2040
- 59,488 · -16.9%
- By 2050
- 51,601 · -28.0%
- By 2075
- 35,025 · -51.1%
- By 2100
- 21,243 · -70.3%
Race, ethnicity, and origin ACS 2023
- Neighborhood character
- Predominantly White (89%)
- Race & ethnicity
- White 89% Two or more races 5% Black 2% Asian 2% Hispanic / Latino 1%
- Common ancestry
- Romanian 10% Iranian 2% Lithuanian 1%
- Foreign-born
- 3% · Canada
- Languages at home
- 97% English-only · Other Indo-European 1%
Political lean MEDSL · Cattaraugus
- 2024 margin
- Solid R (+32.8) · D 33.6% · R 66.4%
- 2008→2024 swing
- -22.2pp toward R · 2008: -10.6pp · 2024: -32.8pp
- All cycles
- 2024: R+32.8 2020: R+29.5 2016: R+34.4 2012: R+13.4 2008: R+10.6
Not yet ingested
- Civics
- —
Market trends
- HPI YoY
- ▼ -19.85%
- Current HPI
- 237.327
- Rent YoY
- —
- Metro
- —
- State GDP YoY
- ▲ 2.60%
- F500 in state
- 92
Industry mix (Fortune 500 HQ in NY)
| Industry | F500 HQs | Revenue |
|---|---|---|
| Financial Services | 10 | $950B |
|
||
| Consumer Goods | 9 | $162B |
|
||
| Insurance | 4 | $225B |
|
||
| Telecommunications | 2 | $144B |
|
||
| Pharmaceuticals | 2 | $112B |
|
||
| Media / Entertainment | 2 | $69B |
|
||
Price history
-37.8% since first listed24 events — show timeline
- 2026-02-28 Price Changed $24,900 UNYREIS
- 2025-09-29 Price Changed $13,900 UNYREIS
- 2025-08-22 Price Changed $14,900 UNYREIS
- 2025-06-17 Listed $19,900 UNYREIS
- 2025-05-15 Listing Removed — UNYREIS
- 2025-02-10 Price Changed $19,900 UNYREIS
- 2025-01-17 Price Changed $23,900 UNYREIS
- 2024-12-28 Price Changed $26,900 UNYREIS
- 2024-11-15 Price Changed $29,900 UNYREIS
- 2024-06-18 Price Changed $33,900 UNYREIS
- 2024-06-03 Price Changed $36,900 UNYREIS
- 2024-05-09 Relisted — UNYREIS
- 2024-02-27 Pending — UNYREIS
- 2024-02-01 Listed $39,900 UNYREIS
- 2024-01-02 Listing Removed — UNYREIS
- 2023-10-26 Listed $49,900 UNYREIS
- 2023-10-11 Sold (Public Records) $23,100 Public Records
- 2013-08-12 Sold (MLS) $48,000 WNYREIS
- 2013-08-09 Sold (Public Records) $48,000 Public Records
- 2012-04-05 Listed $49,900 WNYREIS
- 2011-05-15 Sold (MLS) $43,000 WNYREIS
- 2011-05-13 Sold (Public Records) $43,000 Public Records
- 2010-01-29 Listed $49,900 WNYREIS
- 2007-09-13 Sold (Public Records) $40,000 Public Records
Property tax history
+5.7%/yrLatest (2025): $1,558 · -38.9% YoY. Source: county tax records.
Cash-flow waterfall
monthlySold comps — $/sqft
last 12 mo · ≤1 miLoading sold comps…