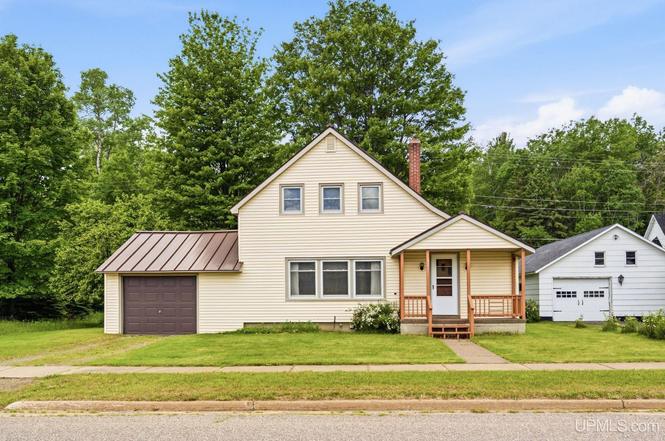
377 Hemlock St · Republic, MI
Flood risk No data
- FEMA flood zone
- —
- Chance of flooding over 30 yrs
- —
- Est. flood insurance / yr
- —
Fire risk No data
- Est. fire insurance / yr
- —
Heat risk No data
- Hot days now (above threshold)
- —
- Hot days in 30 yrs
- —
Wind risk No data
- Chance of severe wind over 30 yrs
- —
Air-quality risk No data
- Unhealthy air days now
- —
- Unhealthy air days in 30 yrs
- —
Risk factors via First Street. Map © Google.
Why this score? — see what drove the D grade
The composite is a weighted blend of 9 inputs, each scored 0–100. Each bar is that input's sub-score; the figure is the points it added to the 100-point composite (weight × sub-score).
- Cash flow +10.3/30.0
- ARV discount +7.5/15.0
- Appreciation +6.8/10.0
- 1% rule +3.1/10.0
- DSCR +3.0/10.0
- Livability +2.8/5.0
- Rent growth +2.5/5.0
- Condition / age +2.5/5.0
- Schools +2.4/10.0
$125,000
🖨 Deal sheet (PDF) 📄 Offer letter ✓ Due diligence
Listing remarks MLS
Some homes carry a sense of history, and this Republic home is one of them. After decades of same-family care, 377 Hemlock Street is ready for its next chapter with a practical layout, meaningful updates, and a setting that feels tucked into town while still connected to nature. The main floor offers an easy flow between the living and dining areas, along with a functional kitchen and convenient half bath. Upstairs, three bedrooms and a full bathroom create comfortable everyday space. The home was moved to this site and placed on a newer block foundation, adding an important update to its long-standing character. A full unfinished basement offers storage, hobby space, or room for future ideas, and the attached one-car garage adds everyday convenience. Outside their is rear alley access, no backyard neighbors, but a wooded hillside backdrop that gives the backyard a peaceful, natural feel. With a $125,000 price point, this well-maintained Republic home offers charm, utility, and potential in the heart of town. Offers due Tuesday, June 23rd at 8PM.
Key facts
- Meaningful updates
- Practical layout
- Rear alley access
Tags
Property features AI
Finance
- Other: Property type zoned residential; Lot acreage approx. 0.17 acres; Roads: city/county and paved street
- Financial info: No financial details listed
- HOA & community: No HOA information listed
Exterior
- Parking: Attached garage (19 x 16) with 1 garage parking space
- Security: No security features listed
- Utilities: Public water; Public sanitary sewer; Electricity connected (100 amp service); Phone connected; Propane heat (LP/Propane Gas) with leased propane tank; Electric water heater; Sewer and water connected
- Home design: Residential property, 1 story; Built in 1880; Below-grade area present (basement space recorded separately)
- Construction: Vinyl siding construction; Basement foundation; Year built: 1880
- Exterior features: Vinyl siding; Platted lot; Road frontage
Interior
- Kitchen: Kitchen on the first level (approx. 14 x 10); Includes range/oven and refrigerator
- Bedrooms: Three bedrooms located on the second level (approx. 12 x 9; 12 x 10; ~10 wide)
- Flooring: No flooring details listed
- Bathrooms: Two total bathrooms (one full bathroom and one lavatory); Primary bathroom components located on first and second levels (approx. 6 x 7 and lavatory 4 x 8)
- Heating & cooling: Forced air heating; No central cooling listed
- Interior features: No special interior features listed
- Laundry & utility: Washer and dryer included; Full, unfinished basement
Neighborhood map
What this means for you Summary
Snapshot
- This is a 3-bed/1.5-bath single-family listed at $125k.
Deal economics
- At list price, monthly cash flow is $-69 ($-823/yr) — negative.
- To cash-flow at today's rent, offer at most $115k (7.9% below list).
- To meet the 1% rule (rent ≥ 1% of price), the offer needs to be $101k (19.5% below list).
- Recommended offer: $101k (19.5% below list) — sets the bar for 1% rule.
Location & tenants
- Location reads 55/100 on livability (#667 in MI) — a working-class tenant base; expect higher turnover. Strengths: cost of living A+; Watch: housing C-, health & safety C-, schools D-.
- Republic-Michigamme Schools (rural): math 20% / reading 30% proficiency, ranked #607 of 760 in MI (top 80%) — low school quality limits family demand, transient renter base, plan for 1-2y turnover.
- Market conditions: 32 active listings in the ZIP; 91 units permitted in Marquette County in 2024 (0 in 5+ unit buildings).
Forward outlook
- In year one you build about $5k of equity ($864 loan paydown + $4k appreciation (3.5% local appreciation)).
- Marquette County population projected to shrink 3% by 2050 — rents likely to lag national; underwrite the cash flow, not the appreciation.
- At projected returns (3.5% appreciation + 3.0% rent growth), your $35k cash investment doubles in ~7 years — after that, you're playing with house money.
- By year 7, paydown + projected appreciation supports a ~$33k cash-out refi (75% LTV) — recoverable capital for the next deal without selling this one.
Negotiation context
- Only 7 days on market — expect competitive offers; lowballing is unlikely to land.
- 2 sale attempts with the ask held roughly flat each time — persistent listings suggest the price (not the market) is what's stuck; bring a comps-based counter.
Risks & watch-outs
- Watch-outs: built in 1880 — expect roof / HVAC / electrical / plumbing capex.
Questions for the listing agent
- What do current leases actually rent for vs. the listed asking? Can we see a recent rent roll and the last 12 months of T-12 income?
- Built in 1880 — when were the roof, HVAC, electrical panel, plumbing, and water heater last replaced?
- Is there a deadline driving the sale (1031 exchange, divorce, estate, relocation)? That informs how much negotiation room exists.
- Schools are D-rated, which usually means shorter tenancies and higher turnover. Who's the typical renter profile here, and what's been the actual vacancy rate?
- Crime grade is F in this area — have there been break-ins, vandalism, or insurance claims at this property in the last 3 years? What carrier currently insures it and at what premium?
- The area grade is low — what's the realistic commute time and amenity access for the typical tenant pool here? Any planned neighborhood developments (good or bad) we should know about?
- What's the average days-on-market for RENTAL listings here right now (not sales)? A rising rental-DOM trend means longer vacancies and softer asking-rent achievability than the comps imply.
- What's the recent tenant-quality profile in this submarket — average credit score on applications, eviction rate, late-payment / NSF rate, and stable-employment percentage? A property-management company in the area should have these aggregated.
- How much new for-sale + rental construction is in the pipeline within 1–3 miles? Heavy new supply typically softens prices + rents 12–24 months out; constrained supply supports both.
Investment metrics
- 1% rule
- 0.81% ✗
- Cap rate
- 5.63%
- Cash-on-cash
- -2.35%
- DSCR
- 0.90
- GRM
- 10.3
CMA / ARV
- ARV (on-the-fly)
- $82,446
- Comps found
- 1
Show comp detail 1 sale within ~0.75 mi
| Address | Dist | Beds/Ba | Sqft | Sold | Price | $/sf | Match |
|---|---|---|---|---|---|---|---|
| 8735 Hawks Dr | 0.27mi | 4/1.5 (+1) | 1,021 (+13%) | 23mo | $92,500 | $91 | 42 |
Match score weights: distance 35% · size 25% · config 20% · recency 20%. Top-matched comps best support the ARV.
Projected returns pro-forma
3.5% appreciation · 3.0% rent growth · sell at horizon
- IRR
- 6.8%
- Equity multiple
- 1.40×
- Total profit
- $14,066
- Equity at exit
- $59,782
- IRR
- 9.4%
- Equity multiple
- 2.49×
- Total profit
- $52,160
- Equity at exit
- $95,014
Cash invested: $35,000 (down + closing). Projections, not guarantees.
Landlord ↔ Tenant lean methodology
- Overall (STATE)
- 62 Landlord-Friendly
- State Michigan
- 62 Landlord-Friendly · EVEN
- County
- — inherits STATE
- City
- — inherits STATE
ZIP-level market 49879
- Home prices YoY
- 2.1%
- Active inventory
- 32
- Price-to-rent
- 10.3×
Monthly cashflow live
- Estimated rent
- $1,007 medium interval (Pro) →
- Mortgage (P&I)
- −$656
- Tax est. 1.5%
- −$156 /mo · $1,875/yr
- Insurance
- −$52
- HOA
- −$0
- Vacancy / Maint / Mgmt
- −$211
- Net cashflow
- $-69
Break-even live
Sensitivity live
| Price | -10% $18 | -5% $-25 | +0% $-69 | +5% $-112 | +10% $-155 |
|---|---|---|---|---|---|
| Rent | -10% $-148 | -5% $-108 | +0% $-69 | +5% $-29 | +10% $11 |
| Rate | -1.0pp $-6 | -0.5pp $-37 | base $-69 | +0.5pp $-101 | +1.0pp $-134 |
UW: 25.0% down · 7.5% · 30yr · 1.5% tax · 5.0% vac · 8.0% maint · 8.0% mgmt
Financing live
Cash to close
- Down payment
- $31,250
- Closing costs
- $3,750
- Reserves months
- —
- Total cash needed
- —
Loan-product check · same deal, 3 products live
Conventional
25% down · 7.5% · 30yr
- Down + closing
- —
- Monthly P&I
- —
- Monthly cashflow
- —
- DSCR
- —
- Eligible?
- —
Personal DTI + credit; lowest rate.
DSCR
20% down · 8.5% · 30yr
- Down + closing
- —
- Monthly P&I
- —
- Monthly cashflow
- —
- DSCR
- —
- Eligible?
- —
No personal income docs; deal must DSCR.
Hard money
10% down · 12.0% · 12mo
- Down + closing
- —
- Monthly P&I
- —
- Monthly cashflow
- —
- DSCR
- —
- Eligible?
- —
Short-term bridge; refi at stabilization.
Listing history 7 events
-
2026-06-21days on market $125,000 Active 7 DOM
-
2026-06-21days on market $125,000 Active 6 DOM
-
2026-06-18days on market $125,000 Active 4 DOM
-
2026-06-17days on market $125,000 Active 3 DOM
-
2026-06-16days on market $125,000 Active 2 DOM
-
2026-06-15remarks 699-char remark
-
2026-06-15$125,000 Active 1 DOM
ⓘ Source: listings_history table (triggers on properties + properties_extension) + one-shot
backfill from property_details.listing_events for pre-trigger history.
Nearby sold comps map
Loading sold comps map…
Walkable amenities ~0.75 mi
Loading nearby amenities…
Taxation est. · year 1
- Rental income
- $12,080
- − Mortgage interest
- −$7,002
- − Property taxes
- −$1,875
- − Insurance
- −$625
- − Repairs & maintenance
- −$966
- − Management
- −$966
- − Depreciation
- −$3,636
- Taxable loss
- −$2,991
- Est. tax savings @ 24.0%
- +$718
- After-tax cash flow
- $-105/yr
For passive investors: Depreciation is non-cash, so a rental often shows a tax loss while cash-flowing — sheltering income. Rental losses are passive: they offset passive income freely, and up to $25,000/yr can offset ordinary (W-2) income if you actively participate and your MAGI is under $100k (phasing out to $0 by $150k); unused losses carry forward. On sale, claimed depreciation is recaptured at up to 25%, and gains may owe capital-gains tax (a 1031 exchange can defer both). Figures are a year-1 estimate at your 24.0% rate — not tax advice; consult a CPA.
Schools (NCES district)
- District
- Republic-Michigamme Schools
- NCES district ID
- 2629580
- Math proficiency
- 20% ▲ 5.00%
- Reading proficiency
- 30% ▲ 15.00%
- Median HH income
- $37,326
- Composite
- 23.87/100
- National rank
- #13209
- State rank
- #607 of 760 in MI
Livability — Republic
- Score
- 55/100
- State rank
- #667
- US rank
- #23566
Category grades
Schools grade is shown separately in the Schools card above.
Census & demographics
- Census place
- Republic, MI
- Population (ZIP)
- 1,105
Population outlook (Marquette County) Hauer SSP2
- Today (2025)
- 67,278 people
- By 2030
- 67,249 · +-0.0%
- By 2040
- 66,297 · -1.5%
- By 2050
- 65,241 · -3.0%
- By 2075
- 64,365 · -4.3%
- By 2100
- 60,707 · -9.8%
Race, ethnicity, and origin ACS 2023
- Neighborhood character
- Predominantly White (98%)
- Race & ethnicity
- White 98% Two or more races 1% Hispanic / Latino 1%
- Common ancestry
- Lithuanian 8% Romanian 3% Slovak 2%
- Foreign-born
- 0%
Political lean MEDSL · Marquette
- 2024 margin
- Lean D (+8.7) · D 53.5% · R 44.8% · Other 1.7%
- 2008→2024 swing
- -11.6pp toward R · 2008: 20.3pp · 2024: 8.7pp
- All cycles
- 2024: D+8.7 2020: D+11.2 2016: D+4.2 2012: D+14.1 2008: D+20.3
Not yet ingested
- Civics
- —
Market trends
- HPI YoY
- ▲ 3.50%
- Current HPI
- 170.8914
- Rent YoY
- —
- Metro
- —
- State GDP YoY
- ▲ 1.37%
- F500 in state
- 28
Industry mix (Fortune 500 HQ in MI)
| Industry | F500 HQs | Revenue |
|---|---|---|
| Automotive Parts | 3 | $48B |
|
||
| Automotive | 2 | $372B |
|
||
| Chemicals | 1 | $45B |
|
||
| Automotive Retail | 1 | $29B |
|
||
| Healthcare / Medical Devices | 1 | $23B |
|
||
| Automotive Technology | 1 | $20B |
|
||
Price history
+0.0% since first listed2 events — show timeline
- 2026-06-14 Listed $125,000 UPAR
- 2026-06-14 Listed $125,000 MiRealSource-MiMLS
Property tax history
-3.9%/yrLatest (2025): $197 · -47.2% YoY. Source: county tax records.
Cash-flow waterfall
monthlySold comps — $/sqft
last 12 mo · ≤1 miLoading sold comps…