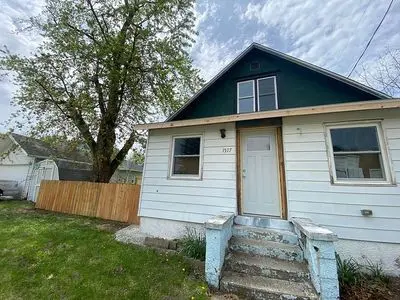
1517 Ashland Ave · Elkhart, IN
Flood risk 1/10 · Minimal
- FEMA flood zone
- X (unshaded)
- Chance of flooding over 30 yrs
- 0.0%
- Est. flood insurance / yr
- $473 – $860
Fire risk 1/10 · Minimal
- Est. fire insurance / yr
- $717 – $1,331
Heat risk 3/10 · Minor
- Hot days now (above 101°F)
- 7 days/yr
- Hot days in 30 yrs
- 16 days/yr
Wind risk 2/10 · Minimal
- Chance of severe wind over 30 yrs
- —
Air-quality risk 3/10 · Minor
- Unhealthy air days now
- 2 days/yr
- Unhealthy air days in 30 yrs
- 3 days/yr
Risk factors via First Street. Map © Google.
Why this score? — see what drove the D- grade
The composite is a weighted blend of 9 inputs, each scored 0–100. Each bar is that input's sub-score; the figure is the points it added to the 100-point composite (weight × sub-score).
- Cash flow +14.1/30.0
- ARV discount +7.1/15.0
- DSCR +4.3/10.0
- Livability +3.4/5.0
- 1% rule +3.1/10.0
- Rent growth +2.5/5.0
- Condition / age +2.5/5.0
- Schools +1.8/10.0
- Appreciation +0.0/10.0
$167,000
🖨 Deal sheet 📄 Offer letter ✓ Due diligence
Listing remarks
Great home with all the major work done just last year. Nicely remodeled new roof, windows, kitchen, both baths, and flooring throughout. HVAC units and most all the ductwork have been upgraded with furnace being high efficiency as well as the tankless water heater. Garage has new overhead and entry doors plus the minimal maintenance yard has wooden privacy fence.
Key facts
- Remodeled kitchen
- Upgraded hvac units
- New roof
Tags
Neighborhood map
What this means for you Summary
Snapshot
- This is a 2-bed/2.0-bath single-family listed at $167k.
Deal economics
- At list price, monthly cash flow is $25 ($300/yr) — positive.
- The deal already cash-flows at list — no discount required.
- To meet the 1% rule (rent ≥ 1% of price), the offer needs to be $136k (18.9% below list).
- Recommended offer: $136k (18.9% below list) — sets the bar for 1% rule.
- Cap rate 6.5% vs local median 4.0% in Elkhart — top-decile yield for the area; either an underpriced asset or a hidden risk that comps aren't pricing in. Stress-test before assuming the spread holds.
Location & tenants
- Location reads 68/100 on livability (#224 in IN) — a middle-class / working-renter tenant base. Strengths: cost of living A+, housing A+, health & safety A+; Watch: amenities C-, schools F, crime F.
- Elkhart Community Schools (urban): math 18% / reading 25% proficiency, ranked #271 of 301 in IN (top 90%) — low school quality limits family demand, transient renter base, plan for 1-2y turnover.
- Market conditions: 146 active listings in the ZIP; 7 comparable units currently listed for rent nearby; rentals at typical pace (median 21d on market — plan ~3-4 weeks tenant-placement turnaround); 43% of comp listings sitting > 30 days — soft ceiling on asking rent; 484 units permitted in Elkhart County in 2024 (136 in 5+ unit buildings).
Forward outlook
- Local home prices are declining (-3.0%/yr); year-one equity from $1k of loan paydown is wiped out by about $5k of value loss. Plan a longer hold.
- Elkhart County population projected at +7% by 2050 — modest demand growth; plan on rents tracking national, not racing it.
Negotiation context
- It's been on market 21 days — a 2% lower offer ($164k) is reasonable based on typical stale-listing flexibility.
Risks & watch-outs
- Watch-outs: built in 1920 — expect roof / HVAC / electrical / plumbing capex.
Questions for the listing agent
- Built in 1920 — when were the roof, HVAC, electrical panel, plumbing, and water heater last replaced?
- Is there a deadline driving the sale (1031 exchange, divorce, estate, relocation)? That informs how much negotiation room exists.
- Schools are F-rated, which usually means shorter tenancies and higher turnover. Who's the typical renter profile here, and what's been the actual vacancy rate?
- Crime grade is F in this area — have there been break-ins, vandalism, or insurance claims at this property in the last 3 years? What carrier currently insures it and at what premium?
- The area grade is low — what's the realistic commute time and amenity access for the typical tenant pool here? Any planned neighborhood developments (good or bad) we should know about?
- What's the average days-on-market for RENTAL listings here right now (not sales)? A rising rental-DOM trend means longer vacancies and softer asking-rent achievability than the comps imply.
- What's the recent tenant-quality profile in this submarket — average credit score on applications, eviction rate, late-payment / NSF rate, and stable-employment percentage? A property-management company in the area should have these aggregated.
- How much new for-sale + rental construction is in the pipeline within 1–3 miles? Heavy new supply typically softens prices + rents 12–24 months out; constrained supply supports both.
Investment metrics
- 1% rule
- 0.81% ✗
- Cap rate
- 6.47%
- Cash-on-cash
- 0.64%
- DSCR
- 1.03
- GRM
- 10.3
CMA / ARV
- ARV (on-the-fly)
- $165,620
- Comps found
- 12
Show comp detail 12 sales within ~0.75 mi
| Address | Dist | Beds/Ba | Sqft | Sold | Price | $/sf | Match |
|---|---|---|---|---|---|---|---|
| 2023 Prairie St | 0.41mi | 3/2.0 (+1) | 1,328 (+4%) | 1mo | $185,000 | $139 | 68 |
| 919 W Wolf Ave | 0.71mi | 2/1.5 | 1,276 (+0%) | 1mo | $128,000 | $100 | 64 |
| 711 Rue St | 0.48mi | 3/1.0 (+1) | 1,248 (-2%) | 3mo | $89,900 | $72 | 63 |
| 1537 Moyer Ave | 0.61mi | 2/1.0 | 1,292 (+1%) | 4mo | $168,000 | $130 | 62 |
| 1110 Princeton St | 0.52mi | 3/1.5 (+1) | 1,248 (-2%) | 7mo | $105,000 | $84 | 60 |
| 1016 Princeton St | 0.57mi | 3/1.5 (+1) | 1,353 (+6%) | 3mo | $140,000 | $103 | 54 |
| 735 W Blaine Ave | 0.59mi | 3/1.0 (+1) | 1,232 (-3%) | 8mo | $175,000 | $142 | 51 |
| 837 Taylor St | 0.62mi | 3/2.0 (+1) | 1,200 (-6%) | 7mo | $250,000 | $208 | 50 |
| 722 W Wolf Ave | 0.53mi | 2/1.0 | 1,144 (-10%) | 7mo | $58,650 | $51 | 48 |
| 2329 Aurora Ave | 0.70mi | 3/2.0 (+1) | 1,200 (-6%) | 8mo | $250,000 | $208 | 46 |
| 2212 Compton Ave | 0.62mi | 3/1.0 (+1) | 1,443 (+13%) | 1mo | $190,000 | $132 | 39 |
| 934 W Garfield Ave | 0.71mi | 3/1.5 (+1) | 1,440 (+13%) | 7mo | $180,000 | $125 | 32 |
Match score weights: distance 35% · size 25% · config 20% · recency 20%. Top-matched comps best support the ARV.
Projected returns pro-forma
-3.0% appreciation · 3.0% rent growth · sell at horizon
- IRR
- -15.3%
- Equity multiple
- 0.45×
- Total profit
- $-25,513
- Equity at exit
- $24,900
- IRR
- -6.8%
- Equity multiple
- 0.56×
- Total profit
- $-20,352
- Equity at exit
- $14,439
Cash invested: $46,760 (down + closing). Projections, not guarantees.
Landlord ↔ Tenant lean methodology
- Overall (STATE)
- 90 Strongly Landlord-Friendly
- State Indiana
- 90 Strongly Landlord-Friendly · R+11
- County
- — inherits STATE
- City
- — inherits STATE
ZIP-level market 46516
- Active inventory
- 146
- Price-to-rent
- 10.3×
Monthly cashflow live
- Estimated rent
- $1,355 high interval (Pro) →
- Mortgage (P&I)
- −$876
- Tax from tax record
- −$100 /mo · $1,203/yr
- Insurance
- −$70
- HOA
- −$0
- Vacancy / Maint / Mgmt
- −$285
- Net cashflow
- $25
Break-even live
UW: 25.0% down · 7.5% · 30yr · 1.5% tax · 5.0% vac · 8.0% maint · 8.0% mgmt
Financing live
Cash to close
- Down payment
- $41,750
- Closing costs
- $5,010
- Reserves months
- —
- Total cash needed
- —
Loan-product check · same deal, 3 products live
Conventional
25% down · 7.5% · 30yr
- Down + closing
- —
- Monthly P&I
- —
- Monthly cashflow
- —
- DSCR
- —
- Eligible?
- —
Personal DTI + credit; lowest rate.
DSCR
20% down · 8.5% · 30yr
- Down + closing
- —
- Monthly P&I
- —
- Monthly cashflow
- —
- DSCR
- —
- Eligible?
- —
No personal income docs; deal must DSCR.
Hard money
10% down · 12.0% · 12mo
- Down + closing
- —
- Monthly P&I
- —
- Monthly cashflow
- —
- DSCR
- —
- Eligible?
- —
Short-term bridge; refi at stabilization.
Rent comps 7 comps
| Address | Beds | Baths | Sqft | Rent | $/sqft | DOM | Units | Dist |
|---|---|---|---|---|---|---|---|---|
| 1401 S Main St Elkhart, IN | 1.0 | 1.0 | 875 | $1,750 | $2.00 | 43d | 1 | 0.34mi |
| 1308 Princeton St Elkhart, IN | 2.0 | 1.0 | 981 | $1,350 | $1.38 | 21d | 1 | 0.47mi |
| 209 S 2nd St Unit B Elkhart, IN | 1.0 | 1.0 | 1200 | $1,100 | $0.92 | 43d | 1 | 0.93mi |
| 660 Stamp Dr Elkhart, IN | 2.0 | 1.0 | 1120 | $1,250 | $1.12 | 21d | 1 | 1.00mi |
| 2700 Ridgewood Dr Elkhart, IN | 3.0 | 1.0–2.0 | 720 | $1,208 | $1.68 | 43d | 1 | 1.07mi |
| 200 Jr. Achievement Dr Elkhart, IN | 1.0–2.0 | 1.0–2.0 | 946 | $1,770 | $1.87 | 21d | 10 | 1.08mi |
| 1568 W Franklin St Elkhart, IN | 3.0 | 2.0 | 1486 | $1,600 | $1.08 | 21d | 1 | 1.21mi |
Listing history 17 events
-
2026-06-19days on market $167,000 Active 21 DOM
-
2026-06-18days on market $167,000 Active 20 DOM
-
2026-06-17days on market $167,000 Active 19 DOM
-
2026-06-16days on market $167,000 Active 18 DOM
-
2026-06-15days on market $167,000 Active 17 DOM
-
2026-06-14days on market $167,000 Active 15 DOM
-
2026-06-13days on market $167,000 Active 14 DOM
-
2026-06-10days on market $167,000 Active 12 DOM
-
2026-06-09days on market $167,000 Active 11 DOM
-
2026-06-08days on market $167,000 Active 10 DOM
-
2026-06-07days on market $167,000 Active 9 DOM
-
2026-06-05days on market $167,000 Active 6 DOM
-
2026-06-03days on market $167,000 Active 5 DOM
-
2026-06-02days on market $167,000 Active 4 DOM
-
2026-06-01days on market $167,000 Active 3 DOM
-
2026-05-31days on market $167,000 Active 2 DOM
-
2026-05-29$167,000 Active
ⓘ Source: listings_history table (triggers on properties + properties_extension) + one-shot
backfill from property_details.listing_events for pre-trigger history.
Tax reassessment forecast IN · Partial reset (capped growth)
- Current annual tax
- $1,203 · $100/mo
- Projected year-2 tax
- $1,311 · $109/mo
- Expected delta
- +$108/yr (+$9/mo · 9.0%)
ⓘ Screening estimate from a state-policy table — verify with the county assessor before closing.
Climate risk First Street
- Flood 1/10 Low FEMA zone X (unshaded) · 0% chance over 30 yrs
- Wildfire 1/10 Low
- Heat 3/10 Moderate 7 d/yr ≥101°F today · 16 d/yr by 30 yrs out
- Wind 2/10 Low
- Air quality 3/10 Moderate 2 unhealthy d/yr today · 3 by 30 yrs out
Nearby sold comps map
Loading sold comps map…
Walkable amenities ~0.75 mi
Loading nearby amenities…
Taxation est. · year 1
- Rental income
- $16,262
- − Mortgage interest
- −$9,355
- − Property taxes
- −$1,203
- − Insurance
- −$835
- − Repairs & maintenance
- −$1,301
- − Management
- −$1,301
- − Depreciation
- −$4,858
- Taxable loss
- −$2,590
- Est. tax savings @ 24.0%
- +$622
- After-tax cash flow
- $922/yr
For passive investors: Depreciation is non-cash, so a rental often shows a tax loss while cash-flowing — sheltering income. Rental losses are passive: they offset passive income freely, and up to $25,000/yr can offset ordinary (W-2) income if you actively participate and your MAGI is under $100k (phasing out to $0 by $150k); unused losses carry forward. On sale, claimed depreciation is recaptured at up to 25%, and gains may owe capital-gains tax (a 1031 exchange can defer both). Figures are a year-1 estimate at your 24.0% rate — not tax advice; consult a CPA.
Schools (NCES district)
- District
- Elkhart Community Schools
- NCES district ID
- 1803270
- Math proficiency
- 18% ▼ -12.00%
- Reading proficiency
- 25% ▼ -9.00%
- Median HH income
- $42,881
- Composite
- 18.45/100
- National rank
- #8928
- State rank
- #271 of 301 in IN
Livability — Elkhart
- Score
- 68/100
- State rank
- #224
- US rank
- #9852
Category grades
Schools grade is shown separately in the Schools card above.
Census & demographics
- Census place
- Elkhart, IN
- County
- Elkhart County · 107,928 people
- City population
- 74,260
- Metro
- Elkhart-Goshen, IN
- Population (ZIP)
- 31,871
- Household income
- $56,492
- Rent vs Own
- Severe rent burden
- 995.0
Population outlook (Elkhart County) Hauer SSP2
- Today (2025)
- 213,761 people
- By 2030
- 218,103 · +2.0%
- By 2040
- 225,381 · +5.4%
- By 2050
- 229,447 · +7.3%
- By 2075
- 232,856 · +8.9%
- By 2100
- 214,088 · +0.2%
Race, ethnicity, and origin ACS 2023
- Neighborhood character
- Diverse neighborhood (Simpson 0.56)
- Race & ethnicity
- White 60% Hispanic / Latino 26% Black 9% Two or more races 8% Asian 1%
- Hispanic origin (detail)
- Mexican 15%
- Common ancestry
- Romanian 2% Iranian 2% Lithuanian 2%
- Foreign-born
- 15% · Canada
- Languages at home
- 77% English-only · Spanish 19% Other Indo-European 3%
Political lean MEDSL · Elkhart
- 2024 margin
- Solid R (+32.4) · D 33.1% · R 65.5% · Other 1.4%
- 2008→2024 swing
- -21.2pp toward R · 2008: -11.2pp · 2024: -32.4pp
- All cycles
- 2024: R+32.4 2020: R+28.1 2016: R+32.4 2012: R+26.5 2008: R+11.2
Not yet ingested
- Civics
- —
Market trends
- HPI YoY
- ▼ -233.42%
- Current HPI
- 239.2508
- Rent YoY
- —
- Metro
- Elkhart-Goshen, IN
- State GDP YoY
- ▲ 2.90%
- F500 in state
- 18
Industry mix (Fortune 500 HQ in IN)
| Industry | F500 HQs | Revenue |
|---|---|---|
| Industrial Machinery | 2 | $37B |
|
||
| Healthcare | 1 | $177B |
|
||
| Pharmaceuticals | 1 | $45B |
|
||
| Metals / Steel | 1 | $18B |
|
||
| Agriculture | 1 | $17B |
|
||
| Packaging | 1 | $12B |
|
||
Price history
1 event — show timeline
- 2026-05-29 Listed $167,000 FSBO.com
Property tax history
+0.7%/yrLatest (2025): $1,203 · +32.0% YoY. Source: county tax records.
Cash-flow waterfall
monthlySold comps — $/sqft
last 12 mo · ≤1 miLoading sold comps…