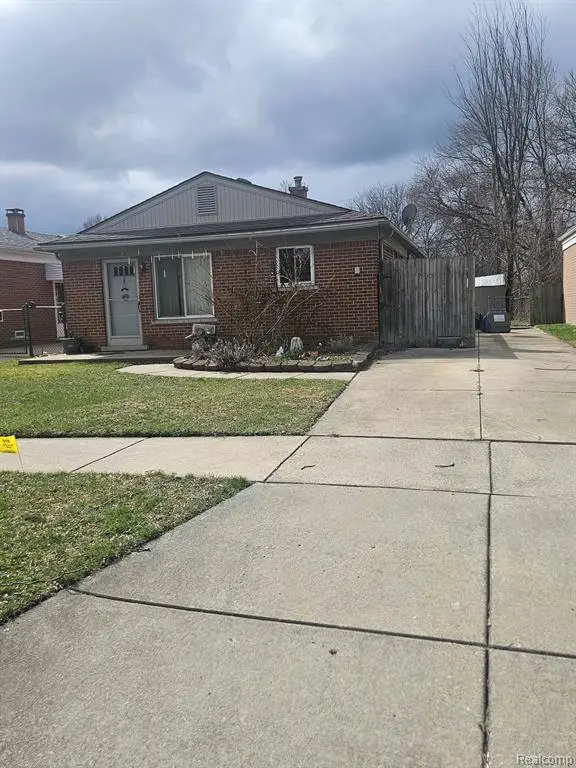
5608 Detroit St · Dearborn Heights, MI
Flood risk 3/10 · Minor
- FEMA flood zone
- X (unshaded)
- Chance of flooding over 30 yrs
- 0.16%
- Est. flood insurance / yr
- $507 – $1,088
Fire risk 1/10 · Minimal
- Est. fire insurance / yr
- $784 – $1,456
Heat risk 3/10 · Minor
- Hot days now (above 97°F)
- 7 days/yr
- Hot days in 30 yrs
- 14 days/yr
Wind risk 2/10 · Minimal
- Chance of severe wind over 30 yrs
- —
Air-quality risk 3/10 · Minor
- Unhealthy air days now
- 2 days/yr
- Unhealthy air days in 30 yrs
- 4 days/yr
Risk factors via First Street. Map © Google.
Why this score? — see what drove the A- grade
The composite is a weighted blend of 9 inputs, each scored 0–100. Each bar is that input's sub-score; the figure is the points it added to the 100-point composite (weight × sub-score).
- Cash flow +30.0/30.0
- ARV discount +15.0/15.0
- 1% rule +10.0/10.0
- DSCR +10.0/10.0
- Appreciation +5.0/10.0
- Livability +4.0/5.0
- Rent growth +2.5/5.0
- Condition / age +2.5/5.0
- Schools +1.7/10.0
$82,500
🖨 Deal sheet 📄 Offer letter ✓ Due diligence
Listing remarks MLS
Home is as is. Must be approved by Probate Court. Buyer will be responsible for clearing the items out of the home. Per the seller, no offers will be reviewed until April 6, 2026. * * * * Unless already scheduled, showings end on 4/1/2026. Highest and Best due by 7 pm 4/3/2026. NO EXCEPTONS * * * * * *
Key facts
- 5,227 sq ft lot
- Built 1964
- Listed 15 days
Neighborhood map
What this means for you Summary
Snapshot
- This is a 3-bed/1.0-bath single-family listed at $82k.
Deal economics
- At list price, monthly cash flow is $417 ($5k/yr) — positive.
- The deal already cash-flows at list — no discount required.
- Meets the 1% rule at list price ($2k rent vs $82k).
- Recommended offer: $81k (1.5% below list) — sets the bar for market timing.
- Cap rate 12.4% vs local median 5.5% in Dearborn Heights — top-decile yield for the area; either an underpriced asset or a hidden risk that comps aren't pricing in. Stress-test before assuming the spread holds.
Location & tenants
- Location reads 79/100 on livability (#82 in MI, #1,885 nationally) — a middle-class / working-renter tenant base. Strengths: commute A+, cost of living A+, housing A+; Watch: schools C-, crime D+, employment D+.
- Dearborn Heights School District #7 (suburban): math 13% / reading 26% proficiency, ranked #466 of 540 in MI (top 86%) — low school quality limits family demand, transient renter base, plan for 1-2y turnover; 60% free/reduced lunch — lower-income household profile, screen leases tightly.
- Market conditions: 1 active listings in the ZIP; 15 comparable units currently listed for rent nearby; rentals leasing fast (median 5d on market — plan ~1-2 weeks tenant-placement turnaround); 2,639 units permitted in Wayne County in 2024 (1,216 in 5+ unit buildings).
Forward outlook
- In year one you build about $3k of equity ($570 loan paydown + $2k appreciation (3.0% local appreciation)).
- Wayne County population projected at -17% by 2050 — secular population decline; favor cash flow + early exit over multi-decade hold.
- At projected returns (3.0% appreciation + 3.0% rent growth), your $23k cash investment doubles in ~3 years — after that, you're playing with house money.
Negotiation context
- It's been on market 15 days — a 2% lower offer ($81k) is reasonable based on typical stale-listing flexibility.
- 8 sale attempts since 28y ago with the ask held roughly flat each time — persistent listings suggest the price (not the market) is what's stuck; bring a comps-based counter.
Risks & watch-outs
- Watch-outs: property tax is 5.0% of price.
Questions for the listing agent
- Built in 1964 — when were the roof, HVAC, electrical panel, plumbing, and water heater last replaced?
- Property tax is high relative to price — has the assessment been appealed recently, and will the sale trigger a re-assessment?
- Is there a deadline driving the sale (1031 exchange, divorce, estate, relocation)? That informs how much negotiation room exists.
- Crime grade is D in this area — have there been break-ins, vandalism, or insurance claims at this property in the last 3 years? What carrier currently insures it and at what premium?
- What's the average days-on-market for RENTAL listings here right now (not sales)? A rising rental-DOM trend means longer vacancies and softer asking-rent achievability than the comps imply.
- What's the recent tenant-quality profile in this submarket — average credit score on applications, eviction rate, late-payment / NSF rate, and stable-employment percentage? A property-management company in the area should have these aggregated.
- How much new for-sale + rental construction is in the pipeline within 1–3 miles? Heavy new supply typically softens prices + rents 12–24 months out; constrained supply supports both.
Investment metrics
- 1% rule
- 1.88% ✓
- Cap rate
- 12.35%
- Cash-on-cash
- 21.64%
- DSCR
- 1.96
- GRM
- 4.4
CMA / ARV
- ARV (on-the-fly)
- $150,092
- Comps found
- 12
Show comp detail 12 sales within ~0.75 mi
| Address | Dist | Beds/Ba | Sqft | Sold | Price | $/sf | Match |
|---|---|---|---|---|---|---|---|
| 5839 Balfour Ave | 0.18mi | 3/1.0 | 998 (+4%) | 2mo | $150,000 | $150 | 82 |
| 4932 Pelham St | 0.24mi | 3/1.0 | 1,000 (+5%) | 0mo | $170,000 | $170 | 81 |
| 4976 Weddell St | 0.32mi | 3/1.0 | 1,012 (+6%) | 3mo | $180,000 | $178 | 73 |
| 20313 Powers Ave | 0.29mi | 2/1.0 (-1) | 992 (+4%) | 4mo | $117,000 | $118 | 72 |
| 4694 Ziegler St | 0.32mi | 3/1.0 | 884 (-8%) | 3mo | $144,899 | $164 | 70 |
| 5607 Polk St | 0.47mi | 2/1.0 (-1) | 954 (-0%) | 4mo | $139,500 | $146 | 70 |
| 5636 Hipp St | 0.45mi | 3/1.0 | 894 (-6%) | 1mo | $121,300 | $136 | 67 |
| 4663 Mayfair St | 0.43mi | 3/1.0 | 1,074 (+12%) | 1mo | $180,000 | $168 | 59 |
| 6354 Buckingham Ave | 0.56mi | 2/1.0 (-1) | 910 (-5%) | 3mo | $106,000 | $116 | 58 |
| 4012 Weddell St | 0.70mi | 3/1.0 | 1,007 (+5%) | 1mo | $220,000 | $218 | 57 |
| 4401 Hipp St | 0.65mi | 3/1.5 | 1,011 (+6%) | 2mo | $90,000 | $89 | 56 |
| 4168 Kingston St | 0.57mi | 2/2.0 (-1) | 858 (-10%) | 4mo | $135,000 | $157 | 44 |
Match score weights: distance 35% · size 25% · config 20% · recency 20%. Top-matched comps best support the ARV.
Projected returns pro-forma
3.0% appreciation · 3.0% rent growth · sell at horizon
- IRR
- 28.0%
- Equity multiple
- 2.59×
- Total profit
- $36,637
- Equity at exit
- $37,096
- IRR
- 28.6%
- Equity multiple
- 5.05×
- Total profit
- $93,491
- Equity at exit
- $57,169
Cash invested: $23,100 (down + closing). Projections, not guarantees.
Landlord ↔ Tenant lean methodology
- Overall (STATE)
- 62 Landlord-Friendly
- State Michigan
- 62 Landlord-Friendly · EVEN
- County
- — inherits STATE
- City
- — inherits STATE
ZIP-level market 42125
- Active inventory
- 1
- Price-to-rent
- 4.4×
Monthly cashflow live
- Estimated rent
- $1,551 high interval (Pro) →
- Mortgage (P&I)
- −$433
- Tax from tax record
- −$342 /mo · $4,104/yr
- Insurance
- −$34
- HOA
- −$0
- Vacancy / Maint / Mgmt
- −$326
- Net cashflow
- $417
Break-even live
UW: 25.0% down · 7.5% · 30yr · 1.5% tax · 5.0% vac · 8.0% maint · 8.0% mgmt
Financing live
Cash to close
- Down payment
- $20,625
- Closing costs
- $2,475
- Reserves months
- —
- Total cash needed
- —
Loan-product check · same deal, 3 products live
Conventional
25% down · 7.5% · 30yr
- Down + closing
- —
- Monthly P&I
- —
- Monthly cashflow
- —
- DSCR
- —
- Eligible?
- —
Personal DTI + credit; lowest rate.
DSCR
20% down · 8.5% · 30yr
- Down + closing
- —
- Monthly P&I
- —
- Monthly cashflow
- —
- DSCR
- —
- Eligible?
- —
No personal income docs; deal must DSCR.
Hard money
10% down · 12.0% · 12mo
- Down + closing
- —
- Monthly P&I
- —
- Monthly cashflow
- —
- DSCR
- —
- Eligible?
- —
Short-term bridge; refi at stabilization.
Rent comps 15 comps
| Address | Beds | Baths | Sqft | Rent | $/sqft | DOM | Units | Dist |
|---|---|---|---|---|---|---|---|---|
| 5371 Culver St Dearborn Heights, MI | 3.0 | 1.0 | 980 | $1,450 | $1.48 | 1d | 1 | 0.23mi |
| 5371 Culver St Dearborn Heights, MI | 3.0 | 1.0 | 980 | $1,500 | $1.53 | 10d | 1 | 0.23mi |
| 4704 Jackson St Dearborn Heights, MI | 3.0 | 1.0 | 1000 | $1,500 | $1.50 | 21d | 1 | 0.38mi |
| 4631 Ziegler St Dearborn Heights, MI | 3.0 | 1.0 | 1050 | $1,650 | $1.57 | 43d | 1 | 0.40mi |
| 4681 Weddell St Dearborn Heights, MI | 3.0 | 1.0 | 860 | $1,600 | $1.86 | 1d | 1 | 0.42mi |
| 4914 Gertrude St Dearborn Heights, MI | 2.0 | 1.0 | 908 | $1,230 | $1.35 | 17d | 1 | 0.77mi |
| 4638 Gertrude St Dearborn Heights, MI | 3.0 | 1.0 | 1020 | $1,700 | $1.67 | 5d | 1 | 0.81mi |
| 4810 Campbell St Dearborn Heights, MI | 3.0 | 1.0 | 1000 | $1,700 | $1.70 | 1d | 1 | 0.84mi |
| 4757 Dudley St Dearborn Heights, MI | 3.0 | 1.0 | 995 | $1,350 | $1.36 | 10d | 1 | 0.99mi |
| 20728 Carlysle St Dearborn, MI | 3.0 | 1.0 | 1087 | $1,850 | $1.70 | 1d | 1 | 1.08mi |
| 4775 Willow Cove Blvd Allen Park, MI | 1.0–2.0 | 1.0 | 805 | $1,649 | $2.05 | 24d | 4 | 1.22mi |
| 4934 McKinley St Dearborn Heights, MI | 3.0 | 1.0 | 1051 | $1,700 | $1.62 | 1d | 1 | 1.23mi |
| 15806 Meyer Ave Allen Park, MI | 3.0 | 2.0 | 1100 | $1,650 | $1.50 | 1d | 1 | 1.28mi |
| 2631 Woodside St Dearborn, MI | 3.0 | 1.0 | 894 | $1,650 | $1.85 | 1d | 1 | 1.29mi |
| 3620 Monroe St Dearborn, MI | 3.0 | 2.0 | 1100 | $1,800 | $1.64 | 10d | 1 | 1.45mi |
Listing history 18 events
-
2026-04-07status Pending 313-char remark
Show marketing remark (313 chars)
Home is as is. Must be approved by Probate Court. Buyer will be responsible for clearing the items out of the home. Per the seller, no offers will be reviewed until April 6, 2026. * * * * Unless already scheduled, showings end on 4/1/2026. Highest and Best due by 7 pm 4/3/2026. NO EXCEPTONS * * * * * *
-
2026-04-07status Pending
Show marketing remark (313 chars)
Home is as is. Must be approved by Probate Court. Buyer will be responsible for clearing the items out of the home. Per the seller, no offers will be reviewed until April 6, 2026. * * * * Unless already scheduled, showings end on 4/1/2026. Highest and Best due by 7 pm 4/3/2026. NO EXCEPTONS * * * * * *
-
2026-03-24$82,500 Active 313-char remark
Show marketing remark (313 chars)
Home is as is. Must be approved by Probate Court. Buyer will be responsible for clearing the items out of the home. Per the seller, no offers will be reviewed until April 6, 2026. * * * * Unless already scheduled, showings end on 4/1/2026. Highest and Best due by 7 pm 4/3/2026. NO EXCEPTONS * * * * * *
-
2026-03-24$82,500 Active
Show marketing remark (313 chars)
Home is as is. Must be approved by Probate Court. Buyer will be responsible for clearing the items out of the home. Per the seller, no offers will be reviewed until April 6, 2026. * * * * Unless already scheduled, showings end on 4/1/2026. Highest and Best due by 7 pm 4/3/2026. NO EXCEPTONS * * * * * *
-
2026-03-23historical $82,500 313-char remark
Show marketing remark (313 chars)
Home is as is. Must be approved by Probate Court. Buyer will be responsible for clearing the items out of the home. Per the seller, no offers will be reviewed until April 6, 2026. * * * * Unless already scheduled, showings end on 4/1/2026. Highest and Best due by 7 pm 4/3/2026. NO EXCEPTONS * * * * * *
-
2003-06-13soldstatus $106,000
-
2003-04-30soldstatus $106,000 219-char remark
Show marketing remark (219 chars)
3% CSB. THIS IS ALL OUT OF 10! EVERYTHINGUPDATED. NEWER FURNACE. NEWER WINDOWS, ROOF, SUPER CLEAN 3 BEDROOM RANCH. VERY SPACIOUSLIVING ROOM. PRIVATE STREET. GOOD SIZE LOT. WALKING DISTANCE TO PARKS AND SCHOOLS. NO FLOOD
-
2003-04-11soldstatus $106,000
-
2003-02-28$104,700
-
2003-02-27$104,700 219-char remark
Show marketing remark (219 chars)
3% CSB. THIS IS ALL OUT OF 10! EVERYTHINGUPDATED. NEWER FURNACE. NEWER WINDOWS, ROOF, SUPER CLEAN 3 BEDROOM RANCH. VERY SPACIOUSLIVING ROOM. PRIVATE STREET. GOOD SIZE LOT. WALKING DISTANCE TO PARKS AND SCHOOLS. NO FLOOD
-
2002-04-01soldstatus $84,201
-
2001-08-19historical
-
2001-03-23$105,000
-
2001-03-23$105,000
-
2000-11-22historical
-
2000-05-22$115,900
-
1998-09-09soldstatus $54,000
-
1998-06-15$75,900
ⓘ Source: listings_history table (triggers on properties + properties_extension) + one-shot
backfill from property_details.listing_events for pre-trigger history.
Tax reassessment forecast MI · Partial reset (capped growth)
- Current annual tax
- $4,104 · $342/mo
- Projected year-2 tax
- $4,104 · $342/mo
- Expected delta
- $0/yr ($0/mo · 0.0%)
ⓘ Screening estimate from a state-policy table — verify with the county assessor before closing.
Climate risk First Street
- Flood 3/10 Moderate FEMA zone X (unshaded) · 16% chance over 30 yrs
- Wildfire 1/10 Low
- Heat 3/10 Moderate 7 d/yr ≥97°F today · 14 d/yr by 30 yrs out
- Wind 2/10 Low
- Air quality 3/10 Moderate 2 unhealthy d/yr today · 4 by 30 yrs out
Nearby sold comps map
Loading sold comps map…
Walkable amenities ~0.75 mi
Loading nearby amenities…
Taxation est. · year 1
- Rental income
- $18,615
- − Mortgage interest
- −$4,621
- − Property taxes
- −$4,104
- − Insurance
- −$412
- − Repairs & maintenance
- −$1,489
- − Management
- −$1,489
- − Depreciation
- −$2,400
- Taxable income
- $4,099
- Est. tax owed @ 24.0%
- −$984
- After-tax cash flow
- $4,014/yr
For passive investors: Depreciation is non-cash, so a rental often shows a tax loss while cash-flowing — sheltering income. Rental losses are passive: they offset passive income freely, and up to $25,000/yr can offset ordinary (W-2) income if you actively participate and your MAGI is under $100k (phasing out to $0 by $150k); unused losses carry forward. On sale, claimed depreciation is recaptured at up to 25%, and gains may owe capital-gains tax (a 1031 exchange can defer both). Figures are a year-1 estimate at your 24.0% rate — not tax advice; consult a CPA.
Schools (NCES district)
- District
- Dearborn Heights School District #7
- NCES district ID
- 2611610
- Math proficiency
- 13% ▼ -10.00%
- Reading proficiency
- 26% ▼ -7.00%
- Median HH income
- $47,468
- Composite
- 17.21/100
- National rank
- #9101
- State rank
- #466 of 540 in MI
Livability — Dearborn Heights
- Score
- 79/100
- State rank
- #82
- US rank
- #1885
Category grades
Schools grade is shown separately in the Schools card above.
Census & demographics
- Census place
- Dearborn Heights, MI
Population outlook (Wayne County) Hauer SSP2
- Today (2025)
- 1,675,273 people
- By 2030
- 1,620,300 · -3.3%
- By 2040
- 1,502,341 · -10.3%
- By 2050
- 1,384,039 · -17.4%
- By 2075
- 1,124,592 · -32.9%
- By 2100
- 881,193 · -47.4%
Not yet ingested
- Political lean
- —
- Race & ethnicity
- —
- Common origin
- —
- Civics
- —
Market trends
- HPI YoY
- —
- Current HPI
- —
- Rent YoY
- —
- Metro
- —
- State GDP YoY
- ▲ 1.37%
- F500 in state
- 28
Industry mix (Fortune 500 HQ in MI)
| Industry | F500 HQs | Revenue |
|---|---|---|
| Automotive Parts | 3 | $48B |
|
||
| Automotive | 2 | $372B |
|
||
| Chemicals | 1 | $45B |
|
||
| Automotive Retail | 1 | $29B |
|
||
| Healthcare / Medical Devices | 1 | $23B |
|
||
| Automotive Technology | 1 | $20B |
|
||
Price history
+8.7% since first listed18 events — show timeline
- 2026-04-07 Pending — MiRealSource-MiMLS
- 2026-04-07 Pending — REALCOMP
- 2026-03-24 Listed $82,500 MiRealSource-MiMLS
- 2026-03-24 Listed $82,500 REALCOMP
- 2026-03-23 Coming Soon $82,500 MiRealSource-MiMLS
- 2003-06-13 Sold (Public Records) $106,000 Public Records
- 2003-04-30 Sold (MLS) $106,000 MiRealSource-MiMLS
- 2003-04-11 Sold (MLS) $106,000 REALCOMP
- 2003-02-28 Listed $104,700 REALCOMP
- 2003-02-27 Listed $104,700 MiRealSource-MiMLS
- 2002-04-01 Sold (Public Records) $84,201 Public Records
- 2001-08-19 Listing Removed — MiRealSource-MiMLS
- 2001-03-23 Listed $105,000 REALCOMP
- 2001-03-23 Listed $105,000 MiRealSource-MiMLS
- 2000-11-22 Listing Removed — MiRealSource-MiMLS
- 2000-05-22 Listed $115,900 MiRealSource-MiMLS
- 1998-09-09 Sold (MLS) $54,000 REALCOMP
- 1998-06-15 Listed $75,900 REALCOMP
Property tax history
+11.2%/yrLatest (2025): $4,104 · +90.4% YoY. Source: county tax records.
Cash-flow waterfall
monthlySold comps — $/sqft
last 12 mo · ≤1 miLoading sold comps…