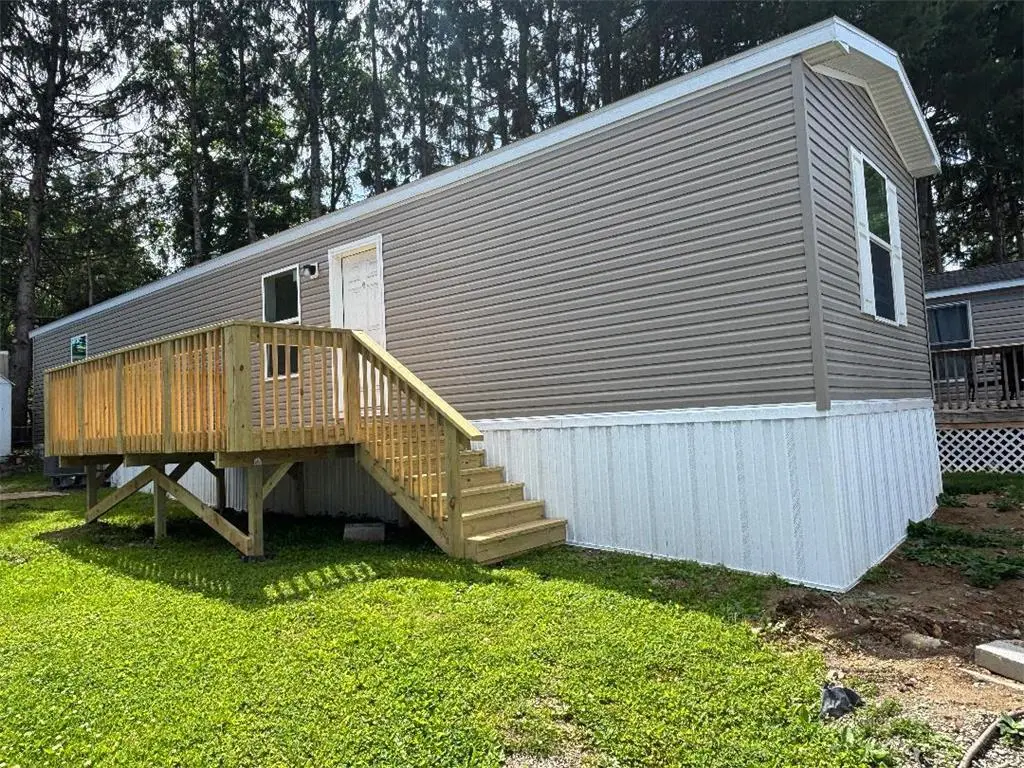
40 Lot 40 Portland Trailer Park Dr #40 · Upper Mount Bethel, PA
Flood risk 1/10 · Minimal
- FEMA flood zone
- X (unshaded)
- Chance of flooding over 30 yrs
- 0.0%
- Est. flood insurance / yr
- $473 – $860
Fire risk 1/10 · Minimal
- Est. fire insurance / yr
- $511 – $949
Heat risk 4/10 · Minor
- Hot days now (above 97°F)
- 7 days/yr
- Hot days in 30 yrs
- 15 days/yr
Wind risk 4/10 · Minor
- Chance of severe wind over 30 yrs
- 14.0%
Air-quality risk 2/10 · Minimal
- Unhealthy air days now
- 1 days/yr
- Unhealthy air days in 30 yrs
- 3 days/yr
Risk factors via First Street. Map © Google.
Why this score? — see what drove the B- grade
The composite is a weighted blend of 9 inputs, each scored 0–100. Each bar is that input's sub-score; the figure is the points it added to the 100-point composite (weight × sub-score).
- Cash flow +28.4/30.0
- 1% rule +10.0/10.0
- DSCR +10.0/10.0
- ARV discount +7.5/15.0
- Schools +4.8/10.0
- Condition / age +4.0/5.0
- Rent growth +2.5/5.0
- Livability +2.5/5.0
- Appreciation +0.0/10.0
$115,000
🖨 Deal sheet 📄 Offer letter ✓ Due diligence
Listing remarks
Move right in to this. .. Turn Key new manufactured home! You will find this home to have all of the desired comforts. You'll enjoy the very convenient Kitchen area with an island/snack bar and all new Frigidaire appliances. .. 3 bedrooms and 2 full bathrooms. The Rheem heat pump provides hot air heating and central air conditioning. This home has been constructed with 2" x 6" exterior walls. Outside you can relax on the spacious new deck. Portland Park has had numerous improvements during the past few years. .. and has a very reasonable lot rent of $ 600/month
Key facts
- Island snack bar
- Kitchen area
- Rheem heat pump
Tags
Property features AI
Finance
- Other: Zoned for mobile home park
- HOA & community: Community association fee of $600 per month
Exterior
- Parking: No garage
- Utilities: 200+ amp electric service; Public water; Community/coop sewer and septic tank
- Home design: Single-story (1 story)
- Construction: Vinyl siding; Asphalt and fiberglass roof; Year built: unknown
- Exterior features: Deck; Storage shed; Mobile home on property
Interior
- Kitchen: Dishwasher; Electric oven; Electric range; Microwave; Refrigerator; Kitchen open to family room
- Bedrooms: Three first-floor bedrooms (sizes: 9 x 7; 9 x 8; 12 x 9)
- Flooring: Laminate; Resilient flooring
- Bathrooms: Two full bathrooms; One full bathroom off the master bedroom
- Heating & cooling: Forced air heating; Heat pump; Central air conditioning
- Interior features: Dining area; Open floor plan between kitchen and family room
- Laundry & utility: Washer hookup; Dryer hookup; Electric water heater
Neighborhood map
What this means for you Summary
Snapshot
- This is a 3-bed/2.0-bath manufactured listed at $115k. Condition is rated good.
Deal economics
- At list price, monthly cash flow is $372 ($4k/yr) — positive.
- The deal already cash-flows at list — no discount required.
- Meets the 1% rule at list price ($2k rent vs $115k).
- Recommended offer: $113k (1.5% below list) — sets the bar for market timing.
Location & tenants
- Location reads: area grade B — affects rentability + tenant quality, not the cash-flow math above.
- Bangor Area SD (rural): math 50% / reading 60% proficiency, ranked #107 of 539 in PA (top 20%) — acceptable for families but not a draw, mixed tenant base, ~2y average lease.
- Market conditions: 35 active listings in the ZIP; 2 comparable units currently listed for rent nearby; 567 units permitted in Northampton County in 2024 (151 in 5+ unit buildings).
Forward outlook
- Local home prices are declining (-3.0%/yr); year-one equity from $795 of loan paydown is wiped out by about $3k of value loss. Plan a longer hold.
- At projected returns (-3.0% appreciation + 3.0% rent growth), your $32k cash investment doubles in ~9 years — after that, you're playing with house money.
Negotiation context
- It's been on market 22 days — a 2% lower offer ($113k) is reasonable based on typical stale-listing flexibility.
Risks & watch-outs
- Watch-outs: HOA is 27% of rent.
Questions for the listing agent
- What does the HOA fee cover, when was the last increase, and are there any pending special assessments or reserve-fund shortfalls?
- Is there a deadline driving the sale (1031 exchange, divorce, estate, relocation)? That informs how much negotiation room exists.
- What's the average days-on-market for RENTAL listings here right now (not sales)? A rising rental-DOM trend means longer vacancies and softer asking-rent achievability than the comps imply.
- What's the recent tenant-quality profile in this submarket — average credit score on applications, eviction rate, late-payment / NSF rate, and stable-employment percentage? A property-management company in the area should have these aggregated.
- How much new for-sale + rental construction is in the pipeline within 1–3 miles? Heavy new supply typically softens prices + rents 12–24 months out; constrained supply supports both.
Investment metrics
- 1% rule
- 1.94% ✓
- Cap rate
- 10.18%
- Cash-on-cash
- 13.87%
- DSCR
- 1.62
- GRM
- 4.3
CMA / ARV
- ARV (on-the-fly)
- $57,670
- Comps found
- 1
Show comp detail 1 sale within ~0.75 mi
| Address | Dist | Beds/Ba | Sqft | Sold | Price | $/sf | Match |
|---|---|---|---|---|---|---|---|
| 25 Portland Trailer Park Dr | 0.03mi | 2/1.0 (-1) | 750 (-5%) | 14mo | $55,000 | $73 | 69 |
Match score weights: distance 35% · size 25% · config 20% · recency 20%. Top-matched comps best support the ARV.
Projected returns pro-forma
-3.0% appreciation · 3.0% rent growth · sell at horizon
- IRR
- 4.4%
- Equity multiple
- 1.17×
- Total profit
- $5,473
- Equity at exit
- $17,147
- IRR
- 14.1%
- Equity multiple
- 2.15×
- Total profit
- $36,924
- Equity at exit
- $9,943
Cash invested: $32,200 (down + closing). Projections, not guarantees.
Landlord ↔ Tenant lean methodology
- Overall (STATE)
- 62 Landlord-Friendly
- State Pennsylvania
- 62 Landlord-Friendly · EVEN
- County
- — inherits STATE
- City
- — inherits STATE
ZIP-level market 18343
- Home prices YoY
- -11.5%
- Active inventory
- 35
- Price-to-rent
- 4.3×
Monthly cashflow live
- Estimated rent
- $2,237 medium interval (Pro) →
- Mortgage (P&I)
- −$603
- Tax est. 1.5%
- −$144 /mo · $1,725/yr
- Insurance
- −$48
- HOA
- −$600
- Vacancy / Maint / Mgmt
- −$470
- Net cashflow
- $372
Break-even live
UW: 25.0% down · 7.5% · 30yr · 1.5% tax · 5.0% vac · 8.0% maint · 8.0% mgmt
Financing live
Cash to close
- Down payment
- $28,750
- Closing costs
- $3,450
- Reserves months
- —
- Total cash needed
- —
Loan-product check · same deal, 3 products live
Conventional
25% down · 7.5% · 30yr
- Down + closing
- —
- Monthly P&I
- —
- Monthly cashflow
- —
- DSCR
- —
- Eligible?
- —
Personal DTI + credit; lowest rate.
DSCR
20% down · 8.5% · 30yr
- Down + closing
- —
- Monthly P&I
- —
- Monthly cashflow
- —
- DSCR
- —
- Eligible?
- —
No personal income docs; deal must DSCR.
Hard money
10% down · 12.0% · 12mo
- Down + closing
- —
- Monthly P&I
- —
- Monthly cashflow
- —
- DSCR
- —
- Eligible?
- —
Short-term bridge; refi at stabilization.
Rent comps 2 comps
| Address | Beds | Baths | Sqft | Rent | $/sqft | DOM | Units | Dist |
|---|---|---|---|---|---|---|---|---|
| 2500 N Delaware Dr Mt Bethel, PA | 2.0 | 1.0 | 900 | $2,500 | $2.78 | 2d | 1 | 0.56mi |
| 2057 S Delaware Dr Mount Bethel, PA | 2.0 | 1.0 | 896 | $1,650 | $1.84 | 11d | 1 | 1.26mi |
HOA detail
- Monthly dues
- $600 · $7,200/yr
Listing history 16 events
-
2026-06-18days on market $115,000 Active 22 DOM
-
2026-06-17days on market $115,000 Active 21 DOM
-
2026-06-16days on market $115,000 Active 20 DOM
-
2026-06-15days on market $115,000 Active 19 DOM
-
2026-06-14days on market $115,000 Active 17 DOM
-
2026-06-13days on market $115,000 Active 16 DOM
-
2026-06-10days on market $115,000 Active 14 DOM
-
2026-06-09days on market $115,000 Active 13 DOM
-
2026-06-08days on market $115,000 Active 12 DOM
-
2026-06-07days on market $115,000 Active 11 DOM
-
2026-06-03days on market $115,000 Active 7 DOM
-
2026-06-02days on market $115,000 Active 6 DOM
-
2026-06-01days on market $115,000 Active 5 DOM
-
2026-05-31days on market $115,000 Active 4 DOM
-
2026-05-31days on market $115,000 Active 3 DOM
-
2026-05-27$115,000 Active
ⓘ Source: listings_history table (triggers on properties + properties_extension) + one-shot
backfill from property_details.listing_events for pre-trigger history.
Climate risk First Street
- Flood 1/10 Low FEMA zone X (unshaded) · 0% chance over 30 yrs
- Wildfire 1/10 Low
- Heat 4/10 Moderate 7 d/yr ≥97°F today · 15 d/yr by 30 yrs out
- Wind 4/10 Moderate 14% chance of damaging wind over 30 yrs
- Air quality 2/10 Low 1 unhealthy d/yr today · 3 by 30 yrs out
Nearby sold comps map
Loading sold comps map…
Walkable amenities ~0.75 mi
Loading nearby amenities…
Taxation est. · year 1
- Rental income
- $26,839
- − Mortgage interest
- −$6,442
- − Property taxes
- −$1,725
- − Insurance
- −$575
- − Repairs & maintenance
- −$2,147
- − Management
- −$2,147
- − HOA
- −$7,200
- − Depreciation
- −$3,345
- Taxable income
- $3,258
- Est. tax owed @ 24.0%
- −$782
- After-tax cash flow
- $3,684/yr
For passive investors: Depreciation is non-cash, so a rental often shows a tax loss while cash-flowing — sheltering income. Rental losses are passive: they offset passive income freely, and up to $25,000/yr can offset ordinary (W-2) income if you actively participate and your MAGI is under $100k (phasing out to $0 by $150k); unused losses carry forward. On sale, claimed depreciation is recaptured at up to 25%, and gains may owe capital-gains tax (a 1031 exchange can defer both). Figures are a year-1 estimate at your 24.0% rate — not tax advice; consult a CPA.
Condition & rehab AI · 11 photos
This move-in-ready manufactured home offers a good condition with new appliances, flooring, and a new deck, making it an attractive option for both resale and rental.
Value-add opportunities
- Both Paint interior walls — Fresh paint enhances curb appeal and interior aesthetics
- Both Replace countertops — Modern countertops improve functionality and aesthetics
- Both Install new lighting fixtures — Updated lighting enhances safety and ambiance
- Both Add decorative elements to bathrooms — Decorative elements can make bathrooms more inviting and stylish
Renovation cost estimate screening
Value-add ROI direction
- Both Paint interior walls — Fresh paint enhances curb appeal and interior aesthetics ↑
- Both Replace countertops — Modern countertops improve functionality and aesthetics ↑
- Both Install new lighting fixtures — Updated lighting enhances safety and ambiance ↑
- Both Add decorative elements to bathrooms — Decorative elements can make bathrooms more inviting and stylish ↑
ⓘ Cost ranges are severity-bucket heuristics (US national rule-of-thumb). Get contractor quotes + a written scope before underwriting a rehab budget.
Schools (NCES district)
- District
- Bangor Area SD
- NCES district ID
- 4203000
- Math proficiency
- 50% ▲ 1.00%
- Reading proficiency
- 60% ▼ -5.00%
- Median HH income
- $57,818
- Composite
- 47.64/100
- National rank
- #2250
- State rank
- #107 of 539 in PA
Livability — Upper Mount Bethel
No livability data for this city. (Only ~50 U.S. cities are tracked.)
Census & demographics
- Census place
- Mount Bethel, PA
- Population (ZIP)
- 3,877
Population outlook (Northampton County) Hauer SSP2
- Today (2025)
- 312,227 people
- By 2030
- 314,769 · +0.8%
- By 2040
- 316,914 · +1.5%
- By 2050
- 318,037 · +1.9%
- By 2075
- 334,003 · +7.0%
- By 2100
- 344,696 · +10.4%
Race, ethnicity, and origin ACS 2023
- Neighborhood character
- Predominantly White (85%)
- Race & ethnicity
- White 85% Hispanic / Latino 9% Two or more races 4% Black 2% Asian 2%
- Hispanic origin (detail)
- Puerto Rican 5% Cuban 1% Dominican 2%
- Common ancestry
- Romanian 5% Portuguese 4% Italian 2%
- Foreign-born
- 9% · Canada, China, South Korea
- Languages at home
- 93% English-only · Spanish 4% Russian/Polish/Slavic 2% Chinese 1%
Political lean MEDSL · Northampton
- 2024 margin
- Toss-up / Even · D 48.6% · R 50.4%
- 2008→2024 swing
- -14.1pp toward R · 2008: 12.3pp · 2024: -1.8pp
- All cycles
- 2024: R+1.8 2020: D+0.7 2016: R+3.8 2012: D+4.6 2008: D+12.3
Not yet ingested
- Civics
- —
Market trends
- HPI YoY
- ▼ -24.19%
- Current HPI
- 185.8592
- Rent YoY
- —
- Metro
- —
- State GDP YoY
- ▲ 1.68%
- F500 in state
- 34
Industry mix (Fortune 500 HQ in PA)
| Industry | F500 HQs | Revenue |
|---|---|---|
| Healthcare | 2 | $309B |
|
||
| Insurance | 2 | $27B |
|
||
| Telecommunications / Media | 1 | $124B |
|
||
| Industrial Distribution | 1 | $22B |
|
||
| Financial Services | 1 | $20B |
|
||
| Chemicals / Materials | 1 | $18B |
|
||
Price history
1 event — show timeline
- 2026-05-27 Listed $115,000 GLVRMLS
Cash-flow waterfall
monthlySold comps — $/sqft
last 12 mo · ≤1 miLoading sold comps…