 Multi-family
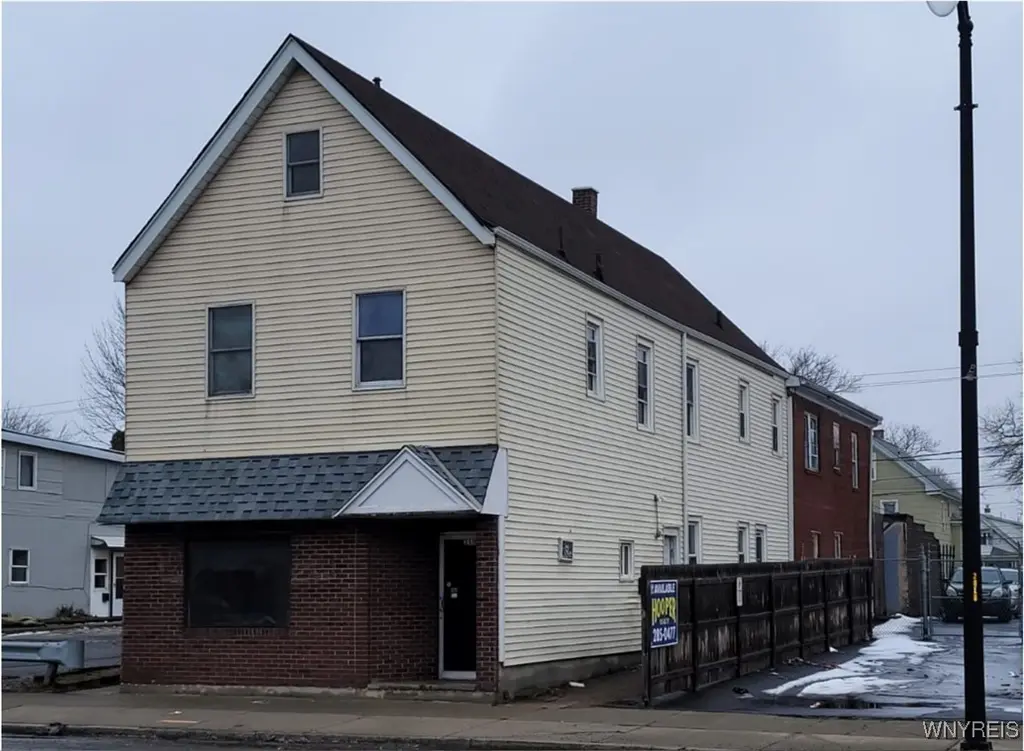
2510 Pine Ave · Niagara Falls, NY
Flood risk No data
- FEMA flood zone
- —
- Chance of flooding over 30 yrs
- —
- Est. flood insurance / yr
- —
Fire risk No data
- Est. fire insurance / yr
- —
Heat risk No data
- Hot days now (above threshold)
- —
- Hot days in 30 yrs
- —
Wind risk No data
- Chance of severe wind over 30 yrs
- —
Air-quality risk No data
- Unhealthy air days now
- —
- Unhealthy air days in 30 yrs
- —
Risk factors via First Street. Map © Google.
Why this score? — see what drove the B+ grade
The composite is a weighted blend of 9 inputs, each scored 0–100. Each bar is that input's sub-score; the figure is the points it added to the 100-point composite (weight × sub-score).
- Cash flow +30.0/30.0
- 1% rule +10.0/10.0
- DSCR +10.0/10.0
- Appreciation +10.0/10.0
- ARV discount +4.8/15.0
- Rent growth +4.7/5.0
- Livability +3.0/5.0
- Schools +2.5/10.0
- Condition / age +2.5/5.0
$324,000
🖨 Deal sheet (PDF) 📄 Offer letter ✓ Due diligence
Multi-family units
County records classify this as Multi-Family (5+ Unit). Listing-text estimate: 1 unit. estimate disagrees with records
5+ unit building — per-unit beds/baths from public records are typically unavailable; the breakdown below (if shown) is an estimate from the listing text.
Listing remarks MLS
10+ bedrooms, 4.5 bath property. A rare opportunity to own this unique building with 5-Units on Pine Avenue, surrounded by active businesses, presenting a combination of 4-residential units and 1-commercial unit. Out of the 4-residential units, 3 units have 2 bedrooms each, 1 unit has 4+ bedrooms. All of the 4 residential units are rented and occupied, with good tenants. Storefront is vacant and available to accommodate your own plans and suit your needs. Current monthly rents total $3763. The whole building and apartments are renovated to pass inspections from Leased Housing Section 8, per their requirements. The building has separate metered utilities; heating is by gas/ electric. It has electrical circuit breakers, and been provided with new hot water tanks, updated panels and flooring. Additional space is available in attic for storage. The property has two car parking places and storage space in its rear.
Key facts
- 4 residential units
- Renovated apartments
- New hot water tanks
Tags
Neighborhood map
What this means for you Summary
Snapshot
- This is a 4-bed/?-bath multifamily listed at $324k.
Deal economics
- At list price, monthly cash flow is $2k ($23k/yr) — positive.
- The deal already cash-flows at list — no discount required.
- Meets the 1% rule at list price ($5k rent vs $324k).
- Recommended offer: $285k (12.0% below list) — sets the bar for market timing.
- Cap rate 13.4% vs local median 7.7% in Niagara Falls — top-decile yield for the area; either an underpriced asset or a hidden risk that comps aren't pricing in. Stress-test before assuming the spread holds.
Location & tenants
- Location reads 60/100 on livability (#956 in NY) — a middle-class / working-renter tenant base. Strengths: cost of living A+, housing A+; Watch: schools F, crime F, amenities F.
- Niagara Falls City School District (urban): math 26% / reading 34% proficiency, ranked #578 of 590 in NY (top 98%) — families likely to look elsewhere, expect single-tenant / working-renter base with shorter leases; 66% free/reduced lunch — lower-income household profile, screen leases tightly.
- Market conditions: Rents rising fast (+8.8%/yr); 164 active listings in the ZIP; lower-income renter base — watch delinquency; 167 units permitted in Niagara County in 2024 (0 in 5+ unit buildings).
- At $5,262/mo this rent would consume 183% of the median local household income ($35k/yr) (locally 954% of renters already pay >50% of income on rent) — very limited rent-growth headroom before tenants either downsize or default.
Forward outlook
- In year one you build about $35k of equity ($2k loan paydown + $32k appreciation (10.0% local appreciation)).
- Niagara County population projected at -19% by 2050 — secular population decline; favor cash flow + early exit over multi-decade hold.
- At projected returns (10.0% appreciation + 8.0% rent growth), your $91k cash investment doubles in ~2 years — after that, you're playing with house money.
- By year 2, paydown + projected appreciation supports a ~$56k cash-out refi (75% LTV) — recoverable capital for the next deal without selling this one.
Negotiation context
- It's been on market 160 days — a 12% lower offer ($285k) is reasonable based on typical stale-listing flexibility.
- 4 sale attempts since 14y ago with the ask held roughly flat each time — persistent listings suggest the price (not the market) is what's stuck; bring a comps-based counter.
- Current owner paid $128k; list at $324k implies a 153% gain — meaningful room to come down on a strong offer.
Risks & watch-outs
- Watch-outs: built in 1920 — expect roof / HVAC / electrical / plumbing capex.
Questions for the listing agent
- It's been on market 160 days. Have you received any prior offers? Is the seller open to a 12% concession, seller financing, or rate buy-down credit?
- Built in 1920 — when were the roof, HVAC, electrical panel, plumbing, and water heater last replaced?
- Why hasn't it sold? Are there any deal-killer items the seller is aware of (foundation, flood, title, zoning, code violations)?
- Is there a deadline driving the sale (1031 exchange, divorce, estate, relocation)? That informs how much negotiation room exists.
- Schools are F-rated, which usually means shorter tenancies and higher turnover. Who's the typical renter profile here, and what's been the actual vacancy rate?
- Crime grade is F in this area — have there been break-ins, vandalism, or insurance claims at this property in the last 3 years? What carrier currently insures it and at what premium?
- What's the average days-on-market for RENTAL listings here right now (not sales)? A rising rental-DOM trend means longer vacancies and softer asking-rent achievability than the comps imply.
- What's the recent tenant-quality profile in this submarket — average credit score on applications, eviction rate, late-payment / NSF rate, and stable-employment percentage? A property-management company in the area should have these aggregated.
- How much new apartment / multifamily construction is in the pipeline within 1–3 miles? Heavy new supply (>2% of stock underway) typically softens rents 12–24 months out; light construction supports rent growth.
Investment metrics
- 1% rule
- 1.62% ✓
- Cap rate
- 13.40%
- Cash-on-cash
- 25.37%
- DSCR
- 2.13
- GRM
- 5.1
CMA / ARV
- ARV (median comp)
- $305,918
- List price
- $324,000
- Delta
- 5.91%
- Verdict
- FAIR
- Comps
- 20 within 1.0 mi
Show comp detail 3 sales within ~0.75 mi
| Address | Dist | Beds/Ba | Sqft | Sold | Price | $/sf | Match |
|---|---|---|---|---|---|---|---|
| 1957 Cudaback Ave | 0.71mi | 5/5.0 (+1) | 4,440 (-14%) | 8mo | $155,000 | $35 | 32 |
| 1952 Cudaback Ave | 0.69mi | 5/— (+1) | 4,463 (-14%) | 14mo | $196,000 | $44 | 28 |
| 1624 Niagara St | 0.69mi | 5/— (+1) | 5,643 (+9%) | 24mo | $175,000 | $31 | 27 |
Match score weights: distance 35% · size 25% · config 20% · recency 20%. Top-matched comps best support the ARV.
Projected returns pro-forma
10.0% appreciation · 8.0% rent growth · sell at horizon
- IRR
- 46.3%
- Equity multiple
- 4.60×
- Total profit
- $326,498
- Equity at exit
- $291,885
- IRR
- 42.3%
- Equity multiple
- 11.30×
- Total profit
- $934,474
- Equity at exit
- $629,461
Cash invested: $90,720 (down + closing). Projections, not guarantees.
Landlord ↔ Tenant lean methodology
- Overall (STATE)
- 15 Strongly Tenant-Friendly
- State New York
- 15 Strongly Tenant-Friendly · D+10
- County
- — inherits STATE
- City
- — inherits STATE
ZIP-level market 14301
- Home prices YoY
- 6.2%
- Rents YoY
- 8.8%
- Active inventory
- 164
- Price-to-rent
- 21.4×
Monthly cashflow live
- Estimated rent
- $5,262 high interval (Pro) →
- Mortgage (P&I)
- −$1,699
- Tax est. 1.5%
- −$405 /mo · $4,860/yr
- Insurance
- −$135
- HOA
- −$0
- Vacancy / Maint / Mgmt
- −$1,105
- Net cashflow
- $1,918
Break-even live
Sensitivity live
| Price | -10% $2,142 | -5% $2,030 | +0% $1,918 | +5% $1,806 | +10% $1,694 |
|---|---|---|---|---|---|
| Rent | -10% $1,502 | -5% $1,710 | +0% $1,918 | +5% $2,126 | +10% $2,334 |
| Rate | -1.0pp $2,081 | -0.5pp $2,000 | base $1,918 | +0.5pp $1,834 | +1.0pp $1,749 |
4-unit breakdown (identical units grouped — click to expand)
| Units | Beds | Baths | Est. rent |
|---|---|---|---|
| 3× units | 2 | 1 | $3,795 |
| #1 | 2 | 1 | $1,265 |
| #2 | 2 | 1 | $1,265 |
| #3 | 2 | 1 | $1,265 |
| 1× unit | 4 | 1 | $1,468 |
| Total (4 units) | $5,262 | ||
UW: 25.0% down · 7.5% · 30yr · 1.5% tax · 5.0% vac · 8.0% maint · 8.0% mgmt
Financing live
Cash to close
- Down payment
- $81,000
- Closing costs
- $9,720
- Reserves months
- —
- Total cash needed
- —
Loan-product check · same deal, 3 products live
Conventional
25% down · 7.5% · 30yr
- Down + closing
- —
- Monthly P&I
- —
- Monthly cashflow
- —
- DSCR
- —
- Eligible?
- —
Personal DTI + credit; lowest rate.
DSCR
20% down · 8.5% · 30yr
- Down + closing
- —
- Monthly P&I
- —
- Monthly cashflow
- —
- DSCR
- —
- Eligible?
- —
No personal income docs; deal must DSCR.
Hard money
10% down · 12.0% · 12mo
- Down + closing
- —
- Monthly P&I
- —
- Monthly cashflow
- —
- DSCR
- —
- Eligible?
- —
Short-term bridge; refi at stabilization.
Listing history 20 events
-
2026-06-18days on market $324,000 Active 160 DOM
-
2026-06-17days on market $324,000 Active 159 DOM
-
2026-06-16days on market $324,000 Active 158 DOM
-
2026-06-15days on market $324,000 Active 157 DOM
-
2026-06-13days on market $324,000 Active 155 DOM
-
2026-06-13days on market $324,000 Active 154 DOM
-
2026-06-10days on market $324,000 Active 152 DOM
-
2026-06-09days on market $324,000 Active 151 DOM
-
2026-06-08days on market $324,000 Active 150 DOM
-
2026-06-07days on market $324,000 Active 149 DOM
-
2026-06-03days on market $324,000 Active 145 DOM
-
2026-06-02days on market $324,000 Active 144 DOM
-
2026-06-01days on market $324,000 Active 143 DOM
-
2026-05-31days on market $324,000 Active 142 DOM
-
2026-01-09$324,000 Active 923-char remark
Show marketing remark (923 chars)
10+ bedrooms, 4.5 bath property. A rare opportunity to own this unique building with 5-Units on Pine Avenue, surrounded by active businesses, presenting a combination of 4-residential units and 1-commercial unit. Out of the 4-residential units, 3 units have 2 bedrooms each, 1 unit has 4+ bedrooms. All of the 4 residential units are rented and occupied, with good tenants. Storefront is vacant and available to accommodate your own plans and suit your needs. Current monthly rents total $3763. The whole building and apartments are renovated to pass inspections from Leased Housing Section 8, per their requirements. The building has separate metered utilities; heating is by gas/ electric. It has electrical circuit breakers, and been provided with new hot water tanks, updated panels and flooring. Additional space is available in attic for storage. The property has two car parking places and storage space in its rear.
-
2022-06-03soldstatus $128,000 Closed Sale or Rented 292-char remark
Show marketing remark (292 chars)
Welcome to 2510 Pine avenue! Where you have the opportunity to open your very own business in the storefront and even live in one of the apartments! With four apartments and one storefront unit, this property that is located in a popular business district can generate passive income for you!
-
2021-10-26status Under Contract- Do Not Show 292-char remark
Show marketing remark (292 chars)
Welcome to 2510 Pine avenue! Where you have the opportunity to open your very own business in the storefront and even live in one of the apartments! With four apartments and one storefront unit, this property that is located in a popular business district can generate passive income for you!
-
2021-08-13$175,000 Active 292-char remark
Show marketing remark (292 chars)
Welcome to 2510 Pine avenue! Where you have the opportunity to open your very own business in the storefront and even live in one of the apartments! With four apartments and one storefront unit, this property that is located in a popular business district can generate passive income for you!
-
2013-06-05$79,900
-
2012-04-02$109,000
ⓘ Source: listings_history table (triggers on properties + properties_extension) + one-shot
backfill from property_details.listing_events for pre-trigger history.
Nearby sold comps map
Loading sold comps map…
Walkable amenities ~0.75 mi
Loading nearby amenities…
Taxation est. · year 1
- Rental income
- $63,144
- − Mortgage interest
- −$18,149
- − Property taxes
- −$4,860
- − Insurance
- −$1,620
- − Repairs & maintenance
- −$5,052
- − Management
- −$5,052
- − Depreciation
- −$9,425
- Taxable income
- $18,986
- Est. tax owed @ 24.0%
- −$4,557
- After-tax cash flow
- $18,458/yr
For passive investors: Depreciation is non-cash, so a rental often shows a tax loss while cash-flowing — sheltering income. Rental losses are passive: they offset passive income freely, and up to $25,000/yr can offset ordinary (W-2) income if you actively participate and your MAGI is under $100k (phasing out to $0 by $150k); unused losses carry forward. On sale, claimed depreciation is recaptured at up to 25%, and gains may owe capital-gains tax (a 1031 exchange can defer both). Figures are a year-1 estimate at your 24.0% rate — not tax advice; consult a CPA.
Schools (NCES district)
- District
- Niagara Falls City School District
- NCES district ID
- 3620820
- Math proficiency
- 26% ▼ -10.00%
- Reading proficiency
- 34% ▲ 3.00%
- Median HH income
- $32,488
- Composite
- 24.5/100
- National rank
- #7655
- State rank
- #578 of 590 in NY
Livability — Niagara Falls
- Score
- 60/100
- State rank
- #956
- US rank
- #18749
Category grades
Schools grade is shown separately in the Schools card above.
Census & demographics
- Census place
- Niagara Falls, NY
- County
- Niagara County · 157,377 people
- City population
- 62,983
- Metro
- Buffalo-Cheektowaga, NY
- Population (ZIP)
- 10,923
- Household income
- $34,549
- Rent vs Own
- Severe rent burden
- 954.0
Population outlook (Niagara County) Hauer SSP2
- Today (2025)
- 204,149 people
- By 2030
- 197,900 · -3.1%
- By 2040
- 182,239 · -10.7%
- By 2050
- 165,198 · -19.1%
- By 2075
- 129,416 · -36.6%
- By 2100
- 96,222 · -52.9%
Race, ethnicity, and origin ACS 2023
- Neighborhood character
- Diverse neighborhood (Simpson 0.58)
- Race & ethnicity
- White 59% Black 25% Two or more races 8% Hispanic / Latino 8% Asian 2%
- Hispanic origin (detail)
- Puerto Rican 3% Cuban 2%
- Common ancestry
- Romanian 6% Slovak 2% Lithuanian 1%
- Foreign-born
- 5% · Canada, China, Dominican Republic
- Languages at home
- 90% English-only · Spanish 6% Other Indo-European 3% Chinese 1%
Political lean MEDSL · Niagara
- 2024 margin
- R (+14.9) · D 42.5% · R 57.5%
- 2008→2024 swing
- -15.9pp toward R · 2008: 1.0pp · 2024: -14.9pp
- All cycles
- 2024: R+14.9 2020: R+9.7 2016: R+19.0 2012: D+0.6 2008: D+1.0
Not yet ingested
- Civics
- —
Market trends
- HPI YoY
- ▲ 15.41%
- Current HPI
- 266.1457
- Rent YoY
- ▲ 8.79%
- Metro
- Buffalo-Cheektowaga, NY
- State GDP YoY
- ▲ 2.60%
- F500 in state
- 92
Industry mix (Fortune 500 HQ in NY)
| Industry | F500 HQs | Revenue |
|---|---|---|
| Financial Services | 10 | $950B |
|
||
| Consumer Goods | 9 | $162B |
|
||
| Insurance | 4 | $225B |
|
||
| Telecommunications | 2 | $144B |
|
||
| Pharmaceuticals | 2 | $112B |
|
||
| Media / Entertainment | 2 | $69B |
|
||
Price history
+197.2% since first listed6 events — show timeline
- 2026-01-09 Listed $324,000 WNYREIS
- 2022-06-03 Sold (MLS) $128,000 WNYREIS
- 2021-10-26 Pending — WNYREIS
- 2021-08-13 Listed $175,000 WNYREIS
- 2013-06-05 Listed $79,900 WNYREIS
- 2012-04-02 Listed $109,000 WNYREIS
Cash-flow waterfall
monthlySold comps — $/sqft
last 12 mo · ≤1 miLoading sold comps…