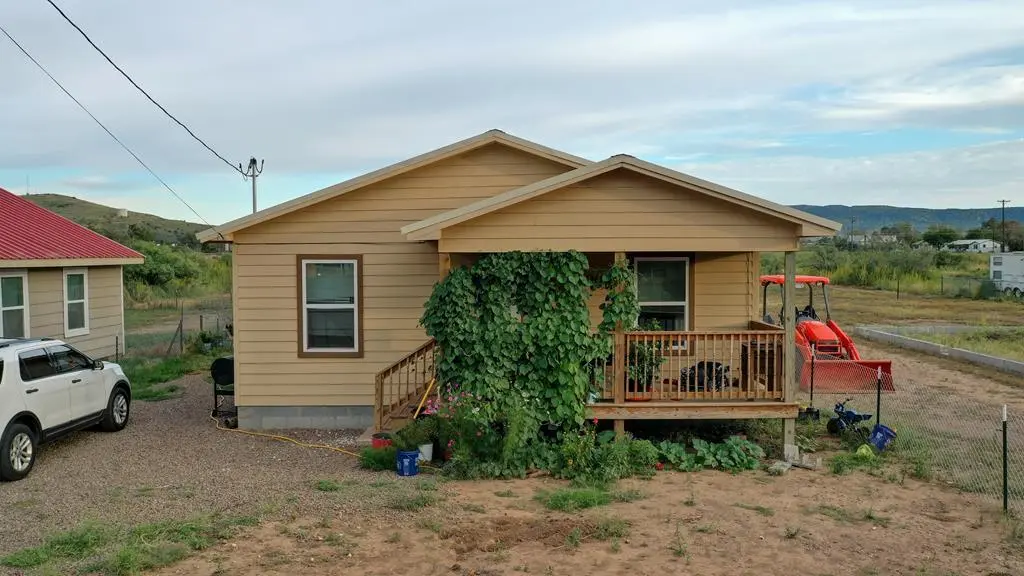
1002 W Brown St · Alpine, TX
Flood risk No data
- FEMA flood zone
- —
- Chance of flooding over 30 yrs
- —
- Est. flood insurance / yr
- —
Fire risk No data
- Est. fire insurance / yr
- —
Heat risk No data
- Hot days now (above threshold)
- —
- Hot days in 30 yrs
- —
Wind risk No data
- Chance of severe wind over 30 yrs
- —
Air-quality risk No data
- Unhealthy air days now
- —
- Unhealthy air days in 30 yrs
- —
Risk factors via First Street. Map © Google.
Why this score? — see what drove the D- grade
The composite is a weighted blend of 9 inputs, each scored 0–100. Each bar is that input's sub-score; the figure is the points it added to the 100-point composite (weight × sub-score).
- Cash flow +16.8/30.0
- DSCR +5.2/10.0
- 1% rule +4.1/10.0
- Schools +4.0/10.0
- Livability +3.9/5.0
- Rent growth +2.5/5.0
- Condition / age +2.2/5.0
- ARV discount +0.0/15.0
- Appreciation +0.0/10.0
$199,000
🖨 Deal sheet 📄 Offer letter ✓ Due diligence
Listing remarks MLS
Tucked away on a quiet street, this charming 3-bedroom, 2-bathroom home offers an ideal opportunity for both first-time buyers and savvy investors. Featuring inviting curb appeal and generous living spaces, it's move-in ready for a new homeowner. OR, an investor can take advantage of a unique opportunity to acquire this property along with the next-door house and the four adjacent lots—making this a rare and versatile offering.
Key facts
- 6,969 sq ft lot
- Built 2018
- Listed 262 days
Neighborhood map
What this means for you Summary
Snapshot
- This is a 3-bed/2.0-bath single-family listed at $199k. Condition is rated fair.
Deal economics
- At list price, monthly cash flow is $126 ($2k/yr) — positive.
- The deal already cash-flows at list — no discount required.
- To meet the 1% rule (rent ≥ 1% of price), the offer needs to be $181k (8.9% below list).
- Recommended offer: $175k (12.0% below list) — sets the bar for market timing.
Location & tenants
- Location reads 78/100 on livability (#73 in TX, #2,631 nationally) — a middle-class / working-renter tenant base. Strengths: crime A+, cost of living A+, housing A+; Watch: amenities D+, commute F, employment F.
- Alpine ISD (town): math 43% / reading 53% proficiency, ranked #235 of 826 in TX (top 28%) — families likely to look elsewhere, expect single-tenant / working-renter base with shorter leases.
- Market conditions: 167 active listings in the ZIP; 2 comparable units currently listed for rent nearby; 7 units permitted in Brewster County in 2024 (0 in 5+ unit buildings).
- This rent runs 33% of the median local income ($67k/yr) — at the standard rent-burdened threshold; future hikes will face affordability resistance.
Forward outlook
- Local home prices are declining (-3.0%/yr); year-one equity from $1k of loan paydown is wiped out by about $6k of value loss. Plan a longer hold.
- Brewster County population projected at -17% by 2050 — secular population decline; favor cash flow + early exit over multi-decade hold.
Negotiation context
- It's been on market 262 days — a 12% lower offer ($175k) is reasonable based on typical stale-listing flexibility.
Questions for the listing agent
- It's been on market 262 days. Have you received any prior offers? Is the seller open to a 12% concession, seller financing, or rate buy-down credit?
- Have any recent inspections been done? Can we get a copy of the seller's disclosures and any deferred-maintenance estimates?
- Why hasn't it sold? Are there any deal-killer items the seller is aware of (foundation, flood, title, zoning, code violations)?
- Is there a deadline driving the sale (1031 exchange, divorce, estate, relocation)? That informs how much negotiation room exists.
- The area grade is low — what's the realistic commute time and amenity access for the typical tenant pool here? Any planned neighborhood developments (good or bad) we should know about?
- What's the average days-on-market for RENTAL listings here right now (not sales)? A rising rental-DOM trend means longer vacancies and softer asking-rent achievability than the comps imply.
- What's the recent tenant-quality profile in this submarket — average credit score on applications, eviction rate, late-payment / NSF rate, and stable-employment percentage? A property-management company in the area should have these aggregated.
- How much new for-sale + rental construction is in the pipeline within 1–3 miles? Heavy new supply typically softens prices + rents 12–24 months out; constrained supply supports both.
Investment metrics
- 1% rule
- 0.91% ✗
- Cap rate
- 7.06%
- Cash-on-cash
- 2.72%
- DSCR
- 1.12
- GRM
- 9.1
CMA / ARV
- ARV (median comp)
- $162,278
- List price
- $199,000
- Delta
- 22.63%
- Verdict
- OVERPRICED
- Comps
- 1 within 2.0 mi
Projected returns pro-forma
-3.0% appreciation · 3.0% rent growth · sell at horizon
- IRR
- -12.0%
- Equity multiple
- 0.57×
- Total profit
- $-24,210
- Equity at exit
- $29,672
- IRR
- -2.9%
- Equity multiple
- 0.81×
- Total profit
- $-10,776
- Equity at exit
- $17,206
Cash invested: $55,720 (down + closing). Projections, not guarantees.
Landlord ↔ Tenant lean methodology
- Overall (STATE)
- 87 Strongly Landlord-Friendly
- State Texas
- 87 Strongly Landlord-Friendly · R+5
- County
- — inherits STATE
- City
- — inherits STATE
ZIP-level market 79830
- Home prices YoY
- -32.6%
- Active inventory
- 167
- Price-to-rent
- 9.1×
Monthly cashflow live
- Estimated rent
- $1,814 medium interval (Pro) →
- Mortgage (P&I)
- −$1,044
- Tax from tax record
- −$180 /mo · $2,160/yr
- Insurance
- −$83
- HOA
- −$0
- Vacancy / Maint / Mgmt
- −$381
- Net cashflow
- $126
Break-even live
UW: 25.0% down · 7.5% · 30yr · 1.5% tax · 5.0% vac · 8.0% maint · 8.0% mgmt
Financing live
Cash to close
- Down payment
- $49,750
- Closing costs
- $5,970
- Reserves months
- —
- Total cash needed
- —
Loan-product check · same deal, 3 products live
Conventional
25% down · 7.5% · 30yr
- Down + closing
- —
- Monthly P&I
- —
- Monthly cashflow
- —
- DSCR
- —
- Eligible?
- —
Personal DTI + credit; lowest rate.
DSCR
20% down · 8.5% · 30yr
- Down + closing
- —
- Monthly P&I
- —
- Monthly cashflow
- —
- DSCR
- —
- Eligible?
- —
No personal income docs; deal must DSCR.
Hard money
10% down · 12.0% · 12mo
- Down + closing
- —
- Monthly P&I
- —
- Monthly cashflow
- —
- DSCR
- —
- Eligible?
- —
Short-term bridge; refi at stabilization.
Rent comps 2 comps
| Address | Beds | Baths | Sqft | Rent | $/sqft | DOM | Units | Dist |
|---|---|---|---|---|---|---|---|---|
| 205 S 11th St Alpine, TX | 2.0 | 1.0 | 754 | $1,800 | $2.39 | 14d | 1 | 0.49mi |
| 2400 U.S. 90 Unit 10 Alpine, TX | 3.0 | 2.0 | 1216 | $1,100 | $0.90 | 14d | 1 | 1.37mi |
Listing history 18 events
-
2026-06-18days on market $199,000 Active 262 DOM
-
2026-06-17days on market $199,000 Active 261 DOM
-
2026-06-16days on market $199,000 Active 260 DOM
-
2026-06-15days on market $199,000 Active 259 DOM
-
2026-06-14days on market $199,000 Active 257 DOM
-
2026-06-13days on market $199,000 Active 256 DOM
-
2026-06-10days on market $199,000 Active 254 DOM
-
2026-06-09days on market $199,000 Active 253 DOM
-
2026-06-08days on market $199,000 Active 252 DOM
-
2026-06-07days on market $199,000 Active 251 DOM
-
2026-06-03days on market $199,000 Active 247 DOM
-
2026-06-02days on market $199,000 Active 246 DOM
-
2026-06-01days on market $199,000 Active 245 DOM
-
2026-05-31days on market $199,000 Active 244 DOM
-
2026-05-31days on market $199,000 Active 243 DOM
-
2026-04-14price $199,000 437-char remark
Show marketing remark (437 chars)
Tucked away on a quiet street, this charming 3-bedroom, 2-bathroom home offers an ideal opportunity for both first-time buyers and savvy investors. Featuring inviting curb appeal and generous living spaces, it's move-in ready for a new homeowner. OR, an investor can take advantage of a unique opportunity to acquire this property along with the next-door house and the four adjacent lots—making this a rare and versatile offering.
-
2026-01-22price $215,000 437-char remark
Show marketing remark (437 chars)
Tucked away on a quiet street, this charming 3-bedroom, 2-bathroom home offers an ideal opportunity for both first-time buyers and savvy investors. Featuring inviting curb appeal and generous living spaces, it's move-in ready for a new homeowner. OR, an investor can take advantage of a unique opportunity to acquire this property along with the next-door house and the four adjacent lots—making this a rare and versatile offering.
-
2025-09-29$244,500 Active 437-char remark
Show marketing remark (437 chars)
Tucked away on a quiet street, this charming 3-bedroom, 2-bathroom home offers an ideal opportunity for both first-time buyers and savvy investors. Featuring inviting curb appeal and generous living spaces, it's move-in ready for a new homeowner. OR, an investor can take advantage of a unique opportunity to acquire this property along with the next-door house and the four adjacent lots—making this a rare and versatile offering.
ⓘ Source: listings_history table (triggers on properties + properties_extension) + one-shot
backfill from property_details.listing_events for pre-trigger history.
Tax reassessment forecast TX · Resets to sale price
- Current annual tax
- $2,160 · $180/mo
- Projected year-2 tax
- $3,642 · $303/mo
- Expected delta
- +$1,482/yr (+$123/mo · 68.6%)
ⓘ Screening estimate from a state-policy table — verify with the county assessor before closing.
Nearby sold comps map
Loading sold comps map…
Walkable amenities ~0.75 mi
Loading nearby amenities…
Taxation est. · year 1
- Rental income
- $21,766
- − Mortgage interest
- −$11,147
- − Property taxes
- −$2,160
- − Insurance
- −$995
- − Repairs & maintenance
- −$1,741
- − Management
- −$1,741
- − Depreciation
- −$5,789
- Taxable loss
- −$1,808
- Est. tax savings @ 24.0%
- +$434
- After-tax cash flow
- $1,951/yr
For passive investors: Depreciation is non-cash, so a rental often shows a tax loss while cash-flowing — sheltering income. Rental losses are passive: they offset passive income freely, and up to $25,000/yr can offset ordinary (W-2) income if you actively participate and your MAGI is under $100k (phasing out to $0 by $150k); unused losses carry forward. On sale, claimed depreciation is recaptured at up to 25%, and gains may owe capital-gains tax (a 1031 exchange can defer both). Figures are a year-1 estimate at your 24.0% rate — not tax advice; consult a CPA.
Condition & rehab AI · 3 photos
This 3-bedroom, 2-bathroom home requires moderate renovations to improve its condition and increase its value. Key areas for improvement include exterior siding, flooring, interior walls, and kitchen and bathroom updates.
Repairs flagged
- Major Exterior siding — Significant weathering and discoloration.
- Major Flooring — Worn appearance and potential need for replacement.
- Major Interior walls/paint — Chipped paint and potential need for repainting.
- Major Bathroom fixtures — Aged appearance and potential need for replacement.
- Major Kitchen cabinets — Dated appearance and potential need for replacement.
- Major HVAC/mechanicals — No visible systems, but may require inspection for functionality and efficiency.
Value-add opportunities
- Both Painting interior walls and repainting exterior siding — Enhances curb appeal and interior aesthetics.
- Both Replacing worn flooring and kitchen cabinets — Improves functionality and aesthetics, attracting more buyers.
- Both Upgrading bathroom fixtures and appliances — Enhances functionality and aesthetics, attracting more buyers.
- Both Upgrading HVAC system — Improves comfort and energy efficiency, attracting more buyers and renters.
Renovation cost estimate screening
| Repair item | Severity | Est. cost |
|---|---|---|
| Exterior siding · Significant weathering and discoloration. | Major | $15,000–50,000 |
| Flooring · Worn appearance and potential need for replacement. | Major | $15,000–50,000 |
| Interior walls/paint · Chipped paint and potential need for repainting. | Major | $15,000–50,000 |
| Bathroom fixtures · Aged appearance and potential need for replacement. | Major | $15,000–50,000 |
| Kitchen cabinets · Dated appearance and potential need for replacement. | Major | $15,000–50,000 |
| HVAC/mechanicals · No visible systems, but may require inspection for functionality and efficiency. | Major | $15,000–50,000 |
| Total estimated repair cost · 6 items | $90,000–300,000 |
Value-add ROI direction
- Both Painting interior walls and repainting exterior siding — Enhances curb appeal and interior aesthetics. ↑
- Both Replacing worn flooring and kitchen cabinets — Improves functionality and aesthetics, attracting more buyers. ↑
- Both Upgrading bathroom fixtures and appliances — Enhances functionality and aesthetics, attracting more buyers. ↑
- Both Upgrading HVAC system — Improves comfort and energy efficiency, attracting more buyers and renters. ↑
ⓘ Cost ranges are severity-bucket heuristics (US national rule-of-thumb). Get contractor quotes + a written scope before underwriting a rehab budget.
Schools (NCES district)
- District
- Alpine ISD
- NCES district ID
- 4807950
- Math proficiency
- 43% ▼ -4.00%
- Reading proficiency
- 53% ▲ 2.00%
- Median HH income
- $39,184
- Composite
- 40.06/100
- National rank
- #3814
- State rank
- #235 of 826 in TX
Livability — Alpine
- Score
- 78/100
- State rank
- #73
- US rank
- #2631
Category grades
Schools grade is shown separately in the Schools card above.
Census & demographics
- Census place
- Alpine, TX
- County
- Brewster County · 7,853 people
- City population
- 7,853
- Metro
- nan
- Population (ZIP)
- 7,853
- Household income
- $66,546
- Rent vs Own
- Severe rent burden
- 229.0
Population outlook (Brewster County) Hauer SSP2
- Today (2025)
- 8,850 people
- By 2030
- 8,577 · -3.1%
- By 2040
- 7,903 · -10.7%
- By 2050
- 7,338 · -17.1%
- By 2075
- 5,950 · -32.8%
- By 2100
- 4,678 · -47.1%
Race, ethnicity, and origin ACS 2023
- Neighborhood character
- Majority White (52%)
- Race & ethnicity
- White 52% Hispanic / Latino 46% Two or more races 15% Asian 1%
- Hispanic origin (detail)
- Mexican 37%
- Common ancestry
- Serbian 5% Slovak 3% Romanian 2%
- Foreign-born
- 9% · Canada
- Languages at home
- 69% English-only · Spanish 29% Tagalog/Filipino 1%
Political lean MEDSL · Brewster
- 2024 margin
- R (+12.6) · D 43.0% · R 55.6% · Other 1.4%
- 2008→2024 swing
- -15.5pp toward R · 2008: 3.0pp · 2024: -12.6pp
- All cycles
- 2024: R+12.6 2020: R+4.2 2016: R+4.8 2012: R+5.4 2008: D+3.0
Not yet ingested
- Civics
- —
Market trends
- HPI YoY
- ▼ -86.21%
- Current HPI
- 178.4899
- Rent YoY
- —
- Metro
- nan
- State GDP YoY
- ▲ 3.95%
- F500 in state
- 110
Industry mix (Fortune 500 HQ in TX)
| Industry | F500 HQs | Revenue |
|---|---|---|
| Energy | 16 | $1,198B |
|
||
| Technology | 5 | $198B |
|
||
| Engineering / Construction | 4 | $72B |
|
||
| Energy Services | 3 | $60B |
|
||
| Utilities | 3 | $41B |
|
||
| Healthcare | 2 | $330B |
|
||
Price history
-18.6% since first listed3 events — show timeline
- 2026-04-14 Price Changed $199,000 ODMLS
- 2026-01-22 Price Changed $215,000 ODMLS
- 2025-09-29 Listed $244,500 ODMLS
Property tax history
-9.8%/yrLatest (2025): $2,160 · -9.8% YoY. Source: county tax records.
Cash-flow waterfall
monthlySold comps — $/sqft
last 12 mo · ≤1 miLoading sold comps…