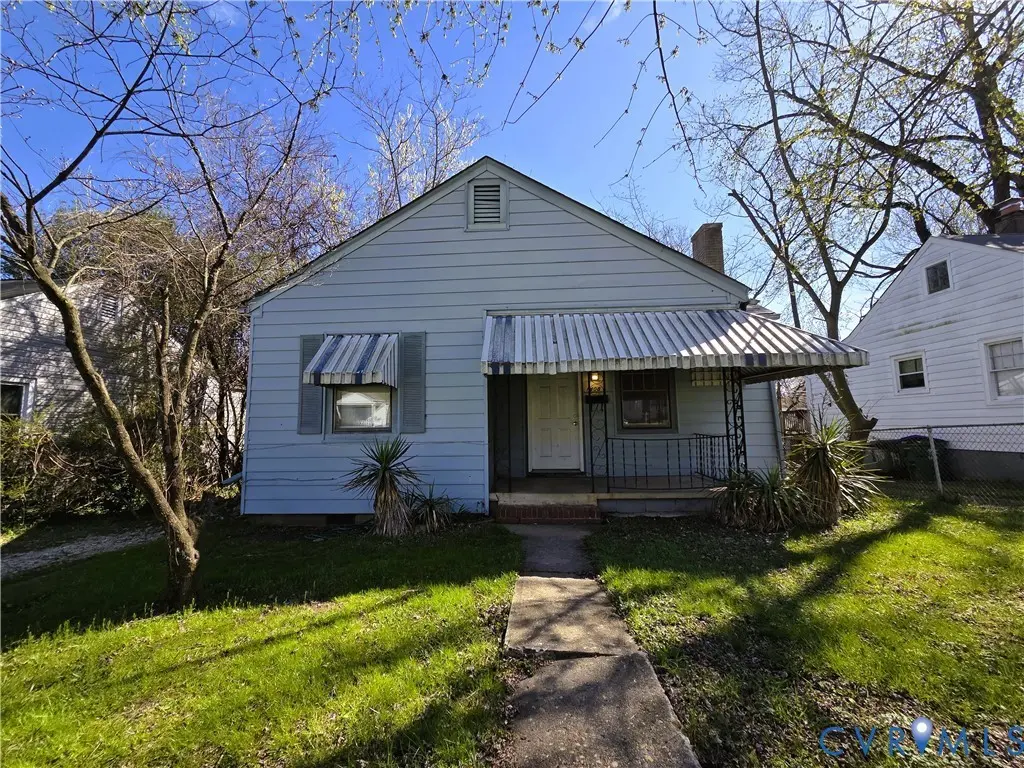
1408 Overlook St · Richmond, VA
Flood risk 1/10 · Minimal
- FEMA flood zone
- X (unshaded)
- Chance of flooding over 30 yrs
- 0.0%
- Est. flood insurance / yr
- $507 – $1,088
Fire risk 1/10 · Minimal
- Est. fire insurance / yr
- $666 – $1,236
Heat risk 7/10 · Major
- Hot days now (above 105°F)
- 7 days/yr
- Hot days in 30 yrs
- 16 days/yr
Wind risk 6/10 · Moderate
- Chance of severe wind over 30 yrs
- 27.0%
Air-quality risk 2/10 · Minimal
- Unhealthy air days now
- 1 days/yr
- Unhealthy air days in 30 yrs
- 2 days/yr
Risk factors via First Street. Map © Google.
Why this score? — see what drove the C+ grade
The composite is a weighted blend of 9 inputs, each scored 0–100. Each bar is that input's sub-score; the figure is the points it added to the 100-point composite (weight × sub-score).
- Cash flow +23.1/30.0
- ARV discount +15.0/15.0
- DSCR +7.4/10.0
- 1% rule +5.2/10.0
- Livability +4.2/5.0
- Rent growth +3.6/5.0
- Schools +3.3/10.0
- Condition / age +2.5/5.0
- Appreciation +0.0/10.0
$160,000
🖨 Deal sheet 📄 Offer letter ✓ Due diligence
Listing remarks MLS
Property is being sold as-is, where-is. Heatpump was put in around 10 years ago. Property is tenant occupied at $750/mo.
Key facts
- 6,499 sq ft lot
- Parking
- Built 1946
Neighborhood map
What this means for you Summary
Snapshot
- This is a 3-bed/1.0-bath single-family listed at $160k.
Deal economics
- At list price, monthly cash flow is $288 ($3k/yr) — positive.
- The deal already cash-flows at list — no discount required.
- Meets the 1% rule at list price ($2k rent vs $160k).
- Cap rate 8.5% vs local median 3.3% in Richmond — top-decile yield for the area; either an underpriced asset or a hidden risk that comps aren't pricing in. Stress-test before assuming the spread holds.
Location & tenants
- Location reads 84/100 on livability (#33 in VA, #793 nationally) — a professional / high-income tenant draw. Strengths: amenities A+, commute A+, health & safety A+; Watch: crime D-.
- Richmond City Public School District (urban): math 32% / reading 47% proficiency, ranked #123 of 131 in VA (top 94%) — families likely to look elsewhere, expect single-tenant / working-renter base with shorter leases; 74% free/reduced lunch — lower-income household profile, screen leases tightly.
- Market conditions: Rents rising fast (+4.5%/yr); 173 active listings in the ZIP; 30 comparable units currently listed for rent nearby; rentals leasing fast (median 11d on market — plan ~1-2 weeks tenant-placement turnaround); 2,540 units permitted in Richmond city in 2024 (2,077 in 5+ unit buildings).
- This rent runs 39% of the median local income ($50k/yr) — at the standard rent-burdened threshold; future hikes will face affordability resistance.
Forward outlook
- Local home prices are declining (-3.0%/yr); year-one equity from $1k of loan paydown is wiped out by about $5k of value loss. Plan a longer hold.
- Richmond County population projected at +40% by 2050 — long-run rental-demand tailwind backs the buy-and-hold thesis.
Negotiation context
- Only 4 days on market — expect competitive offers; lowballing is unlikely to land.
- 8 sale attempts since 23y ago with the ask held roughly flat each time — persistent listings suggest the price (not the market) is what's stuck; bring a comps-based counter.
- Current owner paid $67k; list at $160k implies a 139% gain — meaningful room to come down on a strong offer.
Risks & watch-outs
- Watch-outs: built in 1946 — expect roof / HVAC / electrical / plumbing capex.
- Climate carrying-cost: major wind risk, 27% chance of damaging wind over 30y; extreme-heat days projected 7→16/yr by 2055 (HVAC capex compounding) — expect insurance premiums to compound above CPI over the hold.
Questions for the listing agent
- Built in 1946 — when were the roof, HVAC, electrical panel, plumbing, and water heater last replaced?
- Is there a deadline driving the sale (1031 exchange, divorce, estate, relocation)? That informs how much negotiation room exists.
- Schools are A-rated — typically a magnet for longer-tenancy family renters. What's the average tenant stay here, and is there a school-zone premium baked into asking?
- Crime grade is D in this area — have there been break-ins, vandalism, or insurance claims at this property in the last 3 years? What carrier currently insures it and at what premium?
- What's the average days-on-market for RENTAL listings here right now (not sales)? A rising rental-DOM trend means longer vacancies and softer asking-rent achievability than the comps imply.
- What's the recent tenant-quality profile in this submarket — average credit score on applications, eviction rate, late-payment / NSF rate, and stable-employment percentage? A property-management company in the area should have these aggregated.
- How much new for-sale + rental construction is in the pipeline within 1–3 miles? Heavy new supply typically softens prices + rents 12–24 months out; constrained supply supports both.
Investment metrics
- 1% rule
- 1.02% ✓
- Cap rate
- 8.45%
- Cash-on-cash
- 7.71%
- DSCR
- 1.34
- GRM
- 8.2
CMA / ARV
- ARV (on-the-fly)
- $192,500
- Comps found
- 12
Show comp detail 12 sales within ~0.75 mi
| Address | Dist | Beds/Ba | Sqft | Sold | Price | $/sf | Match |
|---|---|---|---|---|---|---|---|
| 1421 Drewry St | 0.21mi | 3/1.0 | 867 (-1%) | 4mo | $205,000 | $236 | 85 |
| 1700 Presson Blvd | 0.23mi | 3/1.0 | 888 (+2%) | 3mo | $195,000 | $220 | 84 |
| 2304 Oakland Pl | 0.23mi | 2/1.0 (-1) | 884 (+1%) | 4mo | $220,000 | $249 | 79 |
| 1313 Chambers St | 0.12mi | 2/1.0 (-1) | 912 (+4%) | 5mo | $194,950 | $214 | 78 |
| 2405 Royall Ave | 0.40mi | 3/1.0 | 864 (-1%) | 2mo | $168,000 | $194 | 78 |
| 1411 Lynhaven Ave | 0.10mi | 2/1.0 (-1) | 780 (-11%) | 4mo | $79,000 | $101 | 69 |
| 1800 Ingram Ave | 0.45mi | 2/1.0 (-1) | 900 (+3%) | 2mo | $235,000 | $261 | 68 |
| 2318 Gordon Ave | 0.42mi | 2/1.0 (-1) | 912 (+4%) | 3mo | $222,000 | $243 | 66 |
| 2020 Ingram Ave | 0.36mi | 3/1.0 | 985 (+13%) | 2mo | $157,000 | $159 | 61 |
| 2005 Ingram Ave | 0.41mi | 2/1.0 (-1) | 971 (+11%) | 4mo | $165,000 | $170 | 54 |
| 2209 Wright Ave | 0.46mi | 3/1.0 | 1,000 (+14%) | 2mo | $233,000 | $233 | 53 |
| 1718 Fairfax Ave | 0.62mi | 3/1.0 | 986 (+13%) | 3mo | $184,950 | $188 | 48 |
Match score weights: distance 35% · size 25% · config 20% · recency 20%. Top-matched comps best support the ARV.
Projected returns pro-forma
-3.0% appreciation · 4.55% rent growth · sell at horizon
- IRR
- -3.0%
- Equity multiple
- 0.89×
- Total profit
- $-5,062
- Equity at exit
- $23,857
- IRR
- 8.3%
- Equity multiple
- 1.67×
- Total profit
- $29,961
- Equity at exit
- $13,834
Cash invested: $44,800 (down + closing). Projections, not guarantees.
Landlord ↔ Tenant lean methodology
- Overall (STATE)
- 55 Moderately Landlord-Leaning
- State Virginia
- 55 Moderately Landlord-Leaning · D+2
- County
- — inherits STATE
- City
- — inherits STATE
ZIP-level market 23224
- Rents YoY
- 4.5%
- Active inventory
- 173
- Price-to-rent
- 8.2×
Monthly cashflow live
- Estimated rent
- $1,631 high interval (Pro) →
- Mortgage (P&I)
- −$839
- Tax from tax record
- −$95 /mo · $1,140/yr
- Insurance
- −$67
- HOA
- −$0
- Vacancy / Maint / Mgmt
- −$342
- Net cashflow
- $288
Break-even live
UW: 25.0% down · 7.5% · 30yr · 1.5% tax · 5.0% vac · 8.0% maint · 8.0% mgmt
Financing live
Cash to close
- Down payment
- $40,000
- Closing costs
- $4,800
- Reserves months
- —
- Total cash needed
- —
Loan-product check · same deal, 3 products live
Conventional
25% down · 7.5% · 30yr
- Down + closing
- —
- Monthly P&I
- —
- Monthly cashflow
- —
- DSCR
- —
- Eligible?
- —
Personal DTI + credit; lowest rate.
DSCR
20% down · 8.5% · 30yr
- Down + closing
- —
- Monthly P&I
- —
- Monthly cashflow
- —
- DSCR
- —
- Eligible?
- —
No personal income docs; deal must DSCR.
Hard money
10% down · 12.0% · 12mo
- Down + closing
- —
- Monthly P&I
- —
- Monthly cashflow
- —
- DSCR
- —
- Eligible?
- —
Short-term bridge; refi at stabilization.
Rent comps 30 comps
| Address | Beds | Baths | Sqft | Rent | $/sqft | DOM | Units | Dist |
|---|---|---|---|---|---|---|---|---|
| 1305 Chambers St Richmond, VA | 2.0 | 1.0 | 966 | $1,100 | $1.14 | 23d | 1 | 0.15mi |
| 1410 Enfield Ave Unit 1410 Richmond, VA | 3.0 | 1.0 | 912 | $1,500 | $1.64 | 43d | 1 | 0.15mi |
| 2208 Keswick Ave Richmond, VA | 3.0 | 1.0 | 916 | $1,775 | $1.94 | 20d | 1 | 0.21mi |
| 2200 Ingram Ave Richmond, VA | 2.0 | 1.0–2.0 | 711 | $1,668 | $2.35 | 4d | 1 | 0.31mi |
| 1100 Richmond Hwy Richmond, VA | 1.0–3.0 | 1.0–2.0 | 1062 | $2,345 | $2.21 | 1d | 16 | 0.49mi |
| 2100 Wright Ave Richmond, VA | 3.0 | 1.0 | 1014 | $1,695 | $1.67 | 2d | 1 | 0.53mi |
| 2200 Lynhaven Ave Richmond, VA | 1.0–2.0 | 1.0 | 785 | $1,230 | $1.57 | 4d | 2 | 0.60mi |
| 2146 Afton Ave Richmond, VA | 2.0 | 1.0 | 785 | $1,080 | $1.38 | 43d | 1 | 0.60mi |
| 1132 E 15th St Richmond, VA | 2.0 | 1.0 | 672 | $1,255 | $1.87 | 10d | 1 | 0.63mi |
| 1808 Edwards Ave Richmond, VA | 3.0 | 2.0 | 1040 | $1,750 | $1.68 | 23d | 1 | 0.66mi |
| 800 Richmond Hwy Richmond, VA | 1.0–2.0 | 1.0–2.0 | 778 | $2,044 | $2.63 | 43d | 1 | 0.66mi |
| 1913 Dinwiddie Ave Unit 1546196P Richmond, VA | 2.0 | 1.0 | 1044 | $2,519 | $2.41 | 14d | 1 | 0.73mi |
| 1801 Chicago Ave Richmond, VA | 2.0 | 1.0 | 850 | $995 | $1.17 | 23d | 1 | 0.82mi |
| 622 E 18th St Richmond, VA | 2.0 | 1.0 | 850 | $995 | $1.17 | 43d | 1 | 0.83mi |
| 1707 Chicago Ave Richmond, VA | 2.0 | 1.0 | 750 | $995 | $1.33 | 43d | 1 | 0.84mi |
| 1125 Commerce Rd Richmond, VA | 1.0–2.0 | 1.0–1.5 | 685 | $1,409 | $2.06 | 3d | 5 | 0.90mi |
| 2010 Maury St Richmond, VA | 2.0 | 1.0 | 883 | $1,675 | $1.90 | 4d | 1 | 0.91mi |
| 2503 Lynhaven Ave Richmond, VA | 2.0–3.0 | 1.0 | 750 | $1,600 | $2.13 | 1d | 2 | 0.91mi |
| 2908 Richmond Hwy Richmond, VA | 1.0–2.0 | 1.0 | 592 | $1,200 | $2.03 | 2d | 3 | 1.20mi |
| 1021 E 4th St Richmond, VA | 1.0–2.0 | 1.0–2.0 | 759 | $1,449 | $1.91 | 1d | 87 | 1.23mi |
| 10 W 27th St Unit P P Richmond, VA | 2.0 | 1.0 | 975 | $1,300 | $1.33 | 43d | 1 | 1.29mi |
| 700 Everett St Richmond, VA | 1.0–2.0 | 1.0–2.0 | 809 | $1,849 | $2.28 | 4d | 14 | 1.34mi |
| 1514 Bainbridge St Unit A Richmond, VA | 2.0 | 1.0 | 800 | $1,299 | $1.62 | 11d | 1 | 1.34mi |
| 1422 Bainbridge St Richmond, VA | 2.0 | 2.0 | 1121 | $2,399 | $2.14 | 2d | 1 | 1.35mi |
| 700 Stockton St Richmond, VA | 1.0–2.0 | 1.0 | 1035 | $1,805 | $1.74 | 1d | 31 | 1.40mi |
| 500 Maury St Richmond, VA | 2.0 | 1.0–2.0 | 665 | $2,295 | $3.45 | 3d | 17 | 1.41mi |
| 1207 Bainbridge St Richmond, VA | 2.0 | 2.0 | 937 | $2,250 | $2.40 | 11d | 1 | 1.46mi |
| 1203 Bainbridge St Apt A Richmond, VA | 2.0 | 2.0 | 927 | $1,495 | $1.61 | 43d | 1 | 1.46mi |
| 500 Stockton St Richmond, VA | 1.0–2.0 | 1.0–2.0 | 748 | $1,346 | $1.80 | 3d | 16 | 1.48mi |
| 1212 Porter St Apt A Richmond, VA | 2.0 | 2.0 | 980 | $1,995 | $2.04 | 4d | 1 | 1.49mi |
Listing history 20 events
-
2026-03-22status Pending
-
2026-03-17$160,000 Active
-
2018-12-17soldstatus $67,000 Closed 120-char remark
Show marketing remark (120 chars)
Property is being sold as-is, where-is. Heatpump was put in around 10 years ago. Property is tenant occupied at $750/mo.
-
2018-12-17soldstatus $67,000
Show marketing remark (120 chars)
Property is being sold as-is, where-is. Heatpump was put in around 10 years ago. Property is tenant occupied at $750/mo.
-
2018-12-06status Pending 120-char remark
Show marketing remark (120 chars)
Property is being sold as-is, where-is. Heatpump was put in around 10 years ago. Property is tenant occupied at $750/mo.
-
2018-11-05status Active 120-char remark
Show marketing remark (120 chars)
Property is being sold as-is, where-is. Heatpump was put in around 10 years ago. Property is tenant occupied at $750/mo.
-
2018-10-30status Pending 120-char remark
Show marketing remark (120 chars)
Property is being sold as-is, where-is. Heatpump was put in around 10 years ago. Property is tenant occupied at $750/mo.
-
2018-10-25status Active 120-char remark
Show marketing remark (120 chars)
Property is being sold as-is, where-is. Heatpump was put in around 10 years ago. Property is tenant occupied at $750/mo.
-
2018-10-15status Pending 120-char remark
Show marketing remark (120 chars)
Property is being sold as-is, where-is. Heatpump was put in around 10 years ago. Property is tenant occupied at $750/mo.
-
2018-09-17price $75,000 120-char remark
Show marketing remark (120 chars)
Property is being sold as-is, where-is. Heatpump was put in around 10 years ago. Property is tenant occupied at $750/mo.
-
2018-08-22$80,000 Active 120-char remark
Show marketing remark (120 chars)
Property is being sold as-is, where-is. Heatpump was put in around 10 years ago. Property is tenant occupied at $750/mo.
-
2006-08-09soldstatus $42,500 198-char remark
Show marketing remark (198 chars)
PROPERTY CONDITION IE $1175.00, CASE NUMBER 541-593736, GREAT AREA AND ON THE BUS LINE TOO, VINYL RANCH WITH 1/2 PORCH 12X6, DETACHED SHED 10X12, FENCED YARD, GAS STOVE AND CENTRAL A/C. 38000/36100
-
2006-08-09soldstatus $42,500
Show marketing remark (198 chars)
PROPERTY CONDITION IE $1175.00, CASE NUMBER 541-593736, GREAT AREA AND ON THE BUS LINE TOO, VINYL RANCH WITH 1/2 PORCH 12X6, DETACHED SHED 10X12, FENCED YARD, GAS STOVE AND CENTRAL A/C. 38000/36100
-
2006-05-23historical
-
2006-05-23historical
-
2006-02-17$40,000 198-char remark
Show marketing remark (198 chars)
PROPERTY CONDITION IE $1175.00, CASE NUMBER 541-593736, GREAT AREA AND ON THE BUS LINE TOO, VINYL RANCH WITH 1/2 PORCH 12X6, DETACHED SHED 10X12, FENCED YARD, GAS STOVE AND CENTRAL A/C. 38000/36100
-
2006-02-17$40,000
Show marketing remark (198 chars)
PROPERTY CONDITION IE $1175.00, CASE NUMBER 541-593736, GREAT AREA AND ON THE BUS LINE TOO, VINYL RANCH WITH 1/2 PORCH 12X6, DETACHED SHED 10X12, FENCED YARD, GAS STOVE AND CENTRAL A/C. 38000/36100
-
2003-03-13$34,500
-
2003-03-13$34,500
-
1974-01-17soldstatus $14,500
ⓘ Source: listings_history table (triggers on properties + properties_extension) + one-shot
backfill from property_details.listing_events for pre-trigger history.
Tax reassessment forecast VA · Resets to sale price
- Current annual tax
- $1,140 · $95/mo
- Projected year-2 tax
- $1,312 · $109/mo
- Expected delta
- +$172/yr (+$14/mo · 15.1%)
ⓘ Screening estimate from a state-policy table — verify with the county assessor before closing.
Climate risk First Street
- Flood 1/10 Low FEMA zone X (unshaded) · 0% chance over 30 yrs
- Wildfire 1/10 Low
- Heat 7/10 Severe 7 d/yr ≥105°F today · 16 d/yr by 30 yrs out
- Wind 6/10 Major 27% chance of damaging wind over 30 yrs
- Air quality 2/10 Low 1 unhealthy d/yr today · 2 by 30 yrs out
Nearby sold comps map
Loading sold comps map…
Walkable amenities ~0.75 mi
Loading nearby amenities…
Taxation est. · year 1
- Rental income
- $19,571
- − Mortgage interest
- −$8,962
- − Property taxes
- −$1,140
- − Insurance
- −$800
- − Repairs & maintenance
- −$1,566
- − Management
- −$1,566
- − Depreciation
- −$4,655
- Taxable income
- $882
- Est. tax owed @ 24.0%
- −$212
- After-tax cash flow
- $3,240/yr
For passive investors: Depreciation is non-cash, so a rental often shows a tax loss while cash-flowing — sheltering income. Rental losses are passive: they offset passive income freely, and up to $25,000/yr can offset ordinary (W-2) income if you actively participate and your MAGI is under $100k (phasing out to $0 by $150k); unused losses carry forward. On sale, claimed depreciation is recaptured at up to 25%, and gains may owe capital-gains tax (a 1031 exchange can defer both). Figures are a year-1 estimate at your 24.0% rate — not tax advice; consult a CPA.
Schools (NCES district)
- District
- Richmond City Public School District
- NCES district ID
- 5103240
- Math proficiency
- 32% ▼ -24.00%
- Reading proficiency
- 47% ▼ -9.00%
- Median HH income
- $40,276
- Composite
- 33.09/100
- National rank
- #5564
- State rank
- #123 of 131 in VA
Livability — Richmond
- Score
- 84/100
- State rank
- #33
- US rank
- #793
Category grades
Schools grade is shown separately in the Schools card above.
Census & demographics
- Census place
- Richmond, VA
- County
- Richmond City · 178,280 people
- City population
- 287,109
- Metro
- Richmond, VA
- Population (ZIP)
- 40,575
- Household income
- $50,475
- Rent vs Own
- Severe rent burden
- 3584.0
Population outlook (Richmond County) Hauer SSP2
- Today (2025)
- 262,263 people
- By 2030
- 284,503 · +8.5%
- By 2040
- 327,353 · +24.8%
- By 2050
- 367,946 · +40.3%
- By 2075
- 449,560 · +71.4%
- By 2100
- 500,301 · +90.8%
Race, ethnicity, and origin ACS 2023
- Neighborhood character
- Diverse neighborhood (Simpson 0.58)
- Race & ethnicity
- Black 59% Hispanic / Latino 22% White 15% Two or more races 6%
- Hispanic origin (detail)
- Mexican 5% Puerto Rican 2%
- Common ancestry
- Romanian 1% Lithuanian 1% Serbian 1%
- Foreign-born
- 17% · Canada
- Languages at home
- 78% English-only · Spanish 19% French/Haitian/Cajun 1%
Political lean MEDSL · Richmond
- 2024 margin
- Solid D (+66.3) · D 82.0% · R 15.8% · Other 2.2%
- 2008→2024 swing
- +7.2pp toward D · 2008: 59.1pp · 2024: 66.3pp
- All cycles
- 2024: D+66.3 2020: D+68.0 2016: D+63.8 2012: D+55.7 2008: D+59.1
Not yet ingested
- Civics
- —
Market trends
- HPI YoY
- ▼ -283.99%
- Current HPI
- 336.9345
- Rent YoY
- ▲ 4.55%
- Metro
- Richmond, VA
- State GDP YoY
- ▲ 2.40%
- F500 in state
- 50
Industry mix (Fortune 500 HQ in VA)
| Industry | F500 HQs | Revenue |
|---|---|---|
| Aerospace / Defense | 4 | $236B |
|
||
| Technology / Defense | 3 | $32B |
|
||
| Financial Services | 2 | $176B |
|
||
| Utilities | 2 | $27B |
|
||
| Insurance | 2 | $25B |
|
||
| Technology | 2 | $15B |
|
||
Price history
+1003.4% since first listed20 events — show timeline
- 2026-03-22 Pending — CVRMLS
- 2026-03-17 Listed $160,000 CVRMLS
- 2018-12-17 Sold (Public Records) $67,000 Public Records
- 2018-12-17 Sold (MLS) $67,000 CVRMLS
- 2018-12-06 Pending — CVRMLS
- 2018-11-05 Relisted — CVRMLS
- 2018-10-30 Pending — CVRMLS
- 2018-10-25 Relisted — CVRMLS
- 2018-10-15 Pending — CVRMLS
- 2018-09-17 Price Changed $75,000 CVRMLS
- 2018-08-22 Listed $80,000 CVRMLS
- 2006-08-09 Sold (MLS) $42,500 CVRMLS
- 2006-08-09 Sold (MLS) $42,500 CVRMLS
- 2006-05-23 Listing Removed — CVRMLS
- 2006-05-23 Listing Removed — CVRMLS
- 2006-02-17 Listed $40,000 CVRMLS
- 2006-02-17 Listed $40,000 CVRMLS
- 2003-03-13 Listed $34,500 CVRMLS
- 2003-03-13 Listed $34,500 CVRMLS
- 1974-01-17 Sold (Public Records) $14,500 Public Records
Property tax history
+7.2%/yrLatest (2022): $1,140 · +111.1% YoY. Source: county tax records.
Cash-flow waterfall
monthlySold comps — $/sqft
last 12 mo · ≤1 miLoading sold comps…