 Duplex
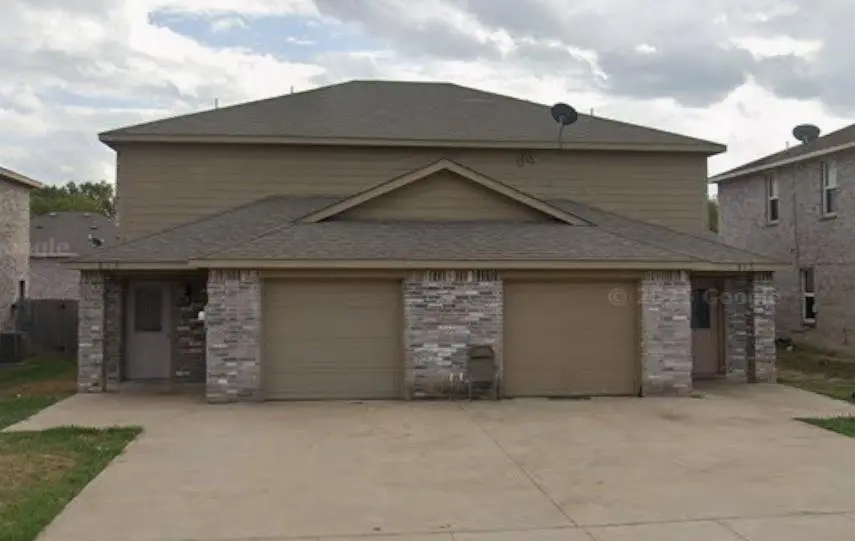
813 E College Ave · Princeton, TX
Flood risk 1/10 · Minimal
- FEMA flood zone
- X (unshaded)
- Chance of flooding over 30 yrs
- 0.0%
- Est. flood insurance / yr
- $507 – $1,088
Fire risk 5/10 · Moderate
- Est. fire insurance / yr
- $1,222 – $2,270
Heat risk 7/10 · Major
- Hot days now (above 110°F)
- 7 days/yr
- Hot days in 30 yrs
- 24 days/yr
Wind risk 6/10 · Moderate
- Chance of severe wind over 30 yrs
- 27.0%
Air-quality risk 3/10 · Minor
- Unhealthy air days now
- 3 days/yr
- Unhealthy air days in 30 yrs
- 3 days/yr
Risk factors via First Street. Map © Google.
Why this score? — see what drove the D- grade
The composite is a weighted blend of 9 inputs, each scored 0–100. Each bar is that input's sub-score; the figure is the points it added to the 100-point composite (weight × sub-score).
- Cash flow +14.4/30.0
- ARV discount +5.2/15.0
- DSCR +4.4/10.0
- Schools +4.2/10.0
- 1% rule +3.3/10.0
- Livability +3.1/5.0
- Condition / age +2.5/5.0
- Rent growth +2.2/5.0
- Appreciation +0.0/10.0
$520,000
🖨 Deal sheet (PDF) 📄 Offer letter ✓ Due diligence
Multi-family units
County records classify this as Multi-Family (2-4 Unit). Listing-text estimate: 2 units. confirmed
Listing remarks MLS
Vanguard Real Estate Advisors is pleased to present the exclusive opportunity to purchase the Princeton Duplexes located in Princeton, Texas. This investment opportunity totals 9 units spread over 4.5 duplexes, all of which are part of a larger stand-alone subdivision, these average a spacious 1,642 square feet and are situated one mile north of Highway 380. The two-story duplex rental units were constructed in 2014, each with four bedrooms with the exception of one unit being a three bedroom configuration. The Princeton Duplexes can benefit from a new investor making light interior renovations to the units and increasing occupancy in order to further enhance revenue. Upon a future exit, the Property provides investors the flexibility either to sell homes individually at full market or retail value to capitalize on the strong Duplex and Townhome demand or to exit as a rental portfolio. Call us to schedule a tour.
Key facts
- 6,970 sq ft lot
- Garage
- Built 2014
Neighborhood map
What this means for you Summary
Snapshot
- This is a 2 × 4-bed/2-bath units multifamily listed at $520k.
Deal economics
- At list price, monthly cash flow is $108 ($1k/yr) — positive. Per door: $54/mo.
- The deal already cash-flows at list — no discount required.
- To meet the 1% rule (rent ≥ 1% of price), the offer needs to be $432k (16.8% below list).
- Recommended offer: $432k (16.8% below list) — sets the bar for 1% rule.
- Cap rate 6.5% vs local median 4.5% in Princeton — top-decile yield for the area; either an underpriced asset or a hidden risk that comps aren't pricing in. Stress-test before assuming the spread holds.
Location & tenants
- Location reads 62/100 on livability (#969 in TX) — a middle-class / working-renter tenant base. Strengths: employment A+, housing A+, cost of living A; Watch: schools C-, amenities F, commute F.
- Princeton ISD (suburban): math 51% / reading 47% proficiency, ranked #188 of 826 in TX (top 23%) — families likely to look elsewhere, expect single-tenant / working-renter base with shorter leases.
- Market conditions: Rents soft (-1.0%/yr); 1404 active listings in the ZIP; 40 comparable units currently listed for rent nearby; rentals at typical pace (median 25d on market — plan ~3-4 weeks tenant-placement turnaround); 40% of comp listings sitting > 30 days — soft ceiling on asking rent; solid renter incomes; 19,194 units permitted in Collin County in 2024 (3,988 in 5+ unit buildings).
- At $4,325/mo this rent would consume 52% of the median local household income ($100k/yr) (locally 368% of renters already pay >50% of income on rent) — very limited rent-growth headroom before tenants either downsize or default.
Forward outlook
- Local home prices are declining (-3.0%/yr); year-one equity from $4k of loan paydown is wiped out by about $16k of value loss. Plan a longer hold.
- Collin County population projected at +60% by 2050 — long-run rental-demand tailwind backs the buy-and-hold thesis.
Negotiation context
- It's been on market 177 days — a 12% lower offer ($458k) is reasonable based on typical stale-listing flexibility.
- 4 sale attempts since 2y ago; this cycle's ask has dropped $2.68M (84%) from the opening price — seller is motivated, your offer sets the floor, not the list.
Risks & watch-outs
- Climate carrying-cost: major wind risk, 27% chance of damaging wind over 30y; moderate wildfire risk; extreme-heat days projected 7→24/yr by 2055 (HVAC capex compounding) — expect insurance premiums to compound above CPI over the hold.
Questions for the listing agent
- It's been on market 177 days. Have you received any prior offers? Is the seller open to a 17% concession, seller financing, or rate buy-down credit?
- Can we see the unit-by-unit rent roll, current vacancy, and any below-market leases? What's the average tenancy length?
- What capital expenditures (roof, boiler, parking lot, exteriors) have been made in the last 5 years, and what's planned in the next 2?
- Why hasn't it sold? Are there any deal-killer items the seller is aware of (foundation, flood, title, zoning, code violations)?
- Is there a deadline driving the sale (1031 exchange, divorce, estate, relocation)? That informs how much negotiation room exists.
- The area grade is low — what's the realistic commute time and amenity access for the typical tenant pool here? Any planned neighborhood developments (good or bad) we should know about?
- What's the average days-on-market for RENTAL listings here right now (not sales)? A rising rental-DOM trend means longer vacancies and softer asking-rent achievability than the comps imply.
- What's the recent tenant-quality profile in this submarket — average credit score on applications, eviction rate, late-payment / NSF rate, and stable-employment percentage? A property-management company in the area should have these aggregated.
- How much new apartment / multifamily construction is in the pipeline within 1–3 miles? Heavy new supply (>2% of stock underway) typically softens rents 12–24 months out; light construction supports rent growth.
Investment metrics
- 1% rule
- 0.83% ✗
- Cap rate
- 6.54%
- Cash-on-cash
- 0.89%
- DSCR
- 1.04
- GRM
- 10.0
CMA / ARV
- ARV (median comp)
- $495,092
- List price
- $520,000
- Delta
- 5.03%
- Verdict
- FAIR
- Comps
- 4 within 1.0 mi
Projected returns pro-forma
-3.0% appreciation · 0.0% rent growth · sell at horizon
- IRR
- -18.1%
- Equity multiple
- 0.38×
- Total profit
- $-90,193
- Equity at exit
- $77,534
- IRR
- -16.9%
- Equity multiple
- 0.18×
- Total profit
- $-119,141
- Equity at exit
- $44,960
Cash invested: $145,600 (down + closing). Projections, not guarantees.
Landlord ↔ Tenant lean methodology
- Overall (STATE)
- 87 Strongly Landlord-Friendly
- State Texas
- 87 Strongly Landlord-Friendly · R+5
- County
- — inherits STATE
- City
- — inherits STATE
ZIP-level market 75407
- Home prices YoY
- -30.3%
- Rents YoY
- -1.0%
- Active inventory
- 1404
- Price-to-rent
- 20.0×
Monthly cashflow live
- Estimated rent
- $4,325 high interval (Pro) →
- Mortgage (P&I)
- −$2,727
- Tax from tax record
- −$366 /mo · $4,386/yr
- Insurance
- −$217
- HOA
- −$0
- Vacancy / Maint / Mgmt
- −$908
- Net cashflow
- $108
Break-even live
Sensitivity live
| Price | -10% $402 | -5% $255 | +0% $108 | +5% $-40 | +10% $-187 |
|---|---|---|---|---|---|
| Rent | -10% $-234 | -5% $-63 | +0% $108 | +5% $278 | +10% $449 |
| Rate | -1.0pp $369 | -0.5pp $240 | base $108 | +0.5pp $-27 | +1.0pp $-164 |
2-unit breakdown (identical units grouped — click to expand)
| Units | Beds | Baths | Est. rent |
|---|---|---|---|
| 2× units | 4 | 2 | $4,324 |
| #1 | 4 | 2 | $2,162 |
| #2 | 4 | 2 | $2,162 |
| Total (2 units) | $4,325 | ||
UW: 25.0% down · 7.5% · 30yr · 1.5% tax · 5.0% vac · 8.0% maint · 8.0% mgmt
Financing live
Cash to close
- Down payment
- $130,000
- Closing costs
- $15,600
- Reserves months
- —
- Total cash needed
- —
Loan-product check · same deal, 3 products live
Conventional
25% down · 7.5% · 30yr
- Down + closing
- —
- Monthly P&I
- —
- Monthly cashflow
- —
- DSCR
- —
- Eligible?
- —
Personal DTI + credit; lowest rate.
DSCR
20% down · 8.5% · 30yr
- Down + closing
- —
- Monthly P&I
- —
- Monthly cashflow
- —
- DSCR
- —
- Eligible?
- —
No personal income docs; deal must DSCR.
Hard money
10% down · 12.0% · 12mo
- Down + closing
- —
- Monthly P&I
- —
- Monthly cashflow
- —
- DSCR
- —
- Eligible?
- —
Short-term bridge; refi at stabilization.
Rent comps 40 comps
| Address | Beds | Baths | Sqft | Rent | $/sqft | DOM | Units | Dist |
|---|---|---|---|---|---|---|---|---|
| 837 E College St Princeton, TX | 4.0 | 2.5 | 1575 | $1,500 | $0.95 | 44d | 1 | 0.04mi |
| 1001 Weiss Ave Princeton, TX | 3.0 | 2.0 | 1209 | $1,595 | $1.32 | 44d | 1 | 0.05mi |
| 812 Parkplace Rdg Princeton, TX | 4.0 | 2.5 | 1514 | $1,575 | $1.04 | 13d | 1 | 0.06mi |
| 806 Parkplace Rdg Princeton, TX | 4.0 | 2.5 | 1600 | $1,500 | $0.94 | 19d | 1 | 0.07mi |
| 819 Parkplace Rdg Princeton, TX | 3.0 | 2.5 | 1669 | $1,700 | $1.02 | 44d | 1 | 0.09mi |
| 1106 Parkway Trl Princeton, TX | 3.0 | 2.5 | 1404 | $1,500 | $1.07 | 44d | 1 | 0.10mi |
| 704 E College St Princeton, TX | 4.0 | 2.0 | 1710 | $1,575 | $0.92 | 44d | 1 | 0.14mi |
| 907 Princeton Hts Princeton, TX | 3.0 | 2.5 | 1627 | $1,995 | $1.23 | 25d | 1 | 0.20mi |
| 1206 Dye Blvd Princeton, TX | 4.0 | 6.0 | 1845 | $2,199 | $1.19 | 44d | 1 | 0.22mi |
| 804 Princeton Hts Princeton, TX | 3.0 | 2.5 | 2232 | $2,225 | $1.00 | 5d | 1 | 0.25mi |
| 1215 Bullock Dr Princeton, TX | 4.0 | 2.5 | 1836 | $2,095 | $1.14 | 44d | 1 | 0.25mi |
| 1106 Princeton Hts Princeton, TX | 3.0 | 2.0 | 1399 | $1,795 | $1.28 | 2d | 1 | 0.26mi |
| 1210 Bullock Dr Princeton, TX | 3.0 | 3.0 | 1627 | $1,850 | $1.14 | 44d | 1 | 0.26mi |
| 604 Princeton Hts Princeton, TX | 3.0–5.0 | 2.0–2.5 | 1882 | $2,348 | $1.25 | 1d | 1 | 0.27mi |
| 1211 Princeton Hts Princeton, TX | 3.0 | 2.0 | 1401 | $1,770 | $1.26 | 18d | 1 | 0.28mi |
| 1211 Princeton Hts Princeton, TX | 3.0 | 2.0 | 1401 | $1,995 | $1.42 | 44d | 1 | 0.28mi |
| 1105 Butler Ave Princeton, TX | 3.0 | 2.0 | 1399 | $1,749 | $1.25 | 17d | 1 | 0.28mi |
| 600 Jefferson Ave Princeton, TX | 3.0 | 2.0 | 1300 | $1,800 | $1.38 | 19d | 1 | 0.31mi |
| 1104 Witherspoon Ln Princeton, TX | 4.0 | 3.0 | 1845 | $2,200 | $1.19 | 44d | 1 | 0.36mi |
| 912 N 4th St Princeton, TX | 4.0 | 2.0 | 1448 | $2,249 | $1.55 | 13d | 1 | 0.39mi |
| 1008 N 4th St Princeton, TX | 3.0 | 2.0 | 1245 | $1,776 | $1.43 | 5d | 1 | 0.39mi |
| 1414 Windermere Way Princeton, TX | 3.0 | 2.5 | 1635 | $1,995 | $1.22 | 21d | 1 | 0.42mi |
| 1421 Butler Ave Princeton, TX | 3.0 | 2.5 | 2225 | $1,999 | $0.90 | 25d | 1 | 0.43mi |
| 228 N 4th St Princeton, TX | 3.0 | 2.0 | 1466 | $1,450 | $0.99 | 44d | 1 | 0.55mi |
| 1605 Fox DR Princeton, TX | 3.0 | 2.0 | 1435 | $2,208 | $1.54 | 1d | 11 | 0.56mi |
| 712 Prairie Creek Dr Princeton, TX | 4.0 | 3.0 | 2049 | $2,350 | $1.15 | 44d | 1 | 0.70mi |
| 100 E Brown St Princeton, TX | 3.0 | 1.0 | 1196 | $2,870 | $2.40 | 1d | 1 | 0.73mi |
| 236 Cr-454 Princeton, TX | 3.0 | 2.5 | 1680 | $2,025 | $1.21 | 4d | 1 | 0.75mi |
| 512 E Hazelwood St Unit A Princeton, TX | 3.0 | 2.0 | 1295 | $1,349 | $1.04 | 44d | 1 | 0.75mi |
| 514 E Hazelwood St Unit B Princeton, TX | 3.0 | 2.0 | 1380 | $1,475 | $1.07 | 7d | 1 | 0.77mi |
| 514 E Hazelwood St Princeton, TX | 3.0 | 2.0 | 1380 | $1,475 | $1.07 | 25d | 1 | 0.77mi |
| 514 E Hazelwood St Unit B Princeton, TX | 3.0 | 2.0 | 1380 | $1,495 | $1.08 | 44d | 1 | 0.77mi |
| 502 E Hazelwood St Princeton, TX | 3.0 | 2.0 | 1295 | $1,550 | $1.20 | 44d | 1 | 0.78mi |
| 414 E Hazelwood St Princeton, TX | 3.0 | 2.0 | 1328 | $1,595 | $1.20 | 25d | 1 | 0.80mi |
| 514 Virginia Way Princeton, TX | 4.0 | 2.0 | 1980 | $2,200 | $1.11 | 5d | 1 | 0.80mi |
| 512 Virginia Way Princeton, TX | 3.0 | 2.5 | 2133 | $2,150 | $1.01 | 25d | 1 | 0.81mi |
| 200 Cole St Princeton, TX | 1.0–3.0 | 1.0–2.0 | 960 | $1,733 | $1.80 | 1d | 9 | 0.81mi |
| 200 Cole St Princeton, TX | 1.0–3.0 | 1.0–2.0 | 960 | $1,799 | $1.87 | 44d | 23 | 0.81mi |
| 1710 Washington St Princeton, TX | 3.0 | 2.0 | 1437 | $1,770 | $1.23 | 2d | 1 | 0.81mi |
| 508 Virginia Way Princeton, TX | 4.0 | 2.0 | 1900 | $2,200 | $1.16 | 13d | 1 | 0.82mi |
Listing history 25 events
-
2026-06-18days on market $520,000 Active 177 DOM
-
2026-06-17days on market $520,000 Active 176 DOM
-
2026-06-16days on market $520,000 Active 175 DOM
-
2026-06-15days on market $520,000 Active 174 DOM
-
2026-06-13days on market $520,000 Active 172 DOM
-
2026-06-13days on market $520,000 Active 171 DOM
-
2026-06-09days on market $520,000 Active 168 DOM
-
2026-06-08days on market $520,000 Active 167 DOM
-
2026-06-07days on market $520,000 Active 166 DOM
-
2026-06-04days on market $520,000 Active 163 DOM
-
2026-06-03days on market $520,000 Active 162 DOM
-
2026-06-02days on market $520,000 Active 161 DOM
-
2026-06-01days on market $520,000 Active 160 DOM
-
2026-05-31days on market $520,000 Active 159 DOM
-
2026-05-01price $2,340,000 933-char remark
Show marketing remark (933 chars)
Vanguard Real Estate Advisors is pleased to present the exclusive opportunity to purchase the Princeton Duplexes located in Princeton, Texas. This investment opportunity totals 9 units spread over 4.5 duplexes, all of which are part of a larger stand-alone subdivision, these average a spacious 1,642 square feet and are situated one mile north of Highway 380. The two-story duplex rental units were constructed in 2014, each with four bedrooms with the exception of one unit being a three bedroom configuration. The Princeton Duplexes can benefit from a new investor making light interior renovations to the units and increasing occupancy in order to further enhance revenue. Upon a future exit, the Property provides investors the flexibility either to sell homes individually at full market or retail value to capitalize on the strong Duplex and Townhome demand or to exit as a rental portfolio. Call us to schedule a tour.
-
2026-04-30price $520,000 564-char remark
Show marketing remark (564 chars)
813 & 815 E College St are adjacent, matching duplex-style assets in Princeton, offering a clean, scalable two-address acquisition for investors or an owner-user looking for flexible use. Each property is recorded at ~1,614 SF and built in 2014, with a functional 4-bed, 2-bath layout and ~0.16-acre lot sizing—ideal for stable rental demand, house-hack potential, or a small portfolio foothold with side-by-side control on the same block. Contact agent as there are additional duplexes for sale in the same subdivision in conjunction with this offering.
-
2026-02-13price $508,571 564-char remark
Show marketing remark (933 chars)
Vanguard Real Estate Advisors is pleased to present the exclusive opportunity to purchase the Princeton Duplexes located in Princeton, Texas. This investment opportunity totals 9 units spread over 4.5 duplexes, all of which are part of a larger stand-alone subdivision, these average a spacious 1,642 square feet and are situated one mile north of Highway 380. The two-story duplex rental units were constructed in 2014, each with four bedrooms with the exception of one unit being a three bedroom configuration. The Princeton Duplexes can benefit from a new investor making light interior renovations to the units and increasing occupancy in order to further enhance revenue. Upon a future exit, the Property provides investors the flexibility either to sell homes individually at full market or retail value to capitalize on the strong Duplex and Townhome demand or to exit as a rental portfolio. Call us to schedule a tour.
-
2026-02-13price $2,860,000 933-char remark
Show marketing remark (933 chars)
Vanguard Real Estate Advisors is pleased to present the exclusive opportunity to purchase the Princeton Duplexes located in Princeton, Texas. This investment opportunity totals 9 units spread over 4.5 duplexes, all of which are part of a larger stand-alone subdivision, these average a spacious 1,642 square feet and are situated one mile north of Highway 380. The two-story duplex rental units were constructed in 2014, each with four bedrooms with the exception of one unit being a three bedroom configuration. The Princeton Duplexes can benefit from a new investor making light interior renovations to the units and increasing occupancy in order to further enhance revenue. Upon a future exit, the Property provides investors the flexibility either to sell homes individually at full market or retail value to capitalize on the strong Duplex and Townhome demand or to exit as a rental portfolio. Call us to schedule a tour.
-
2026-01-14$3,200,000 Active 933-char remark
Show marketing remark (933 chars)
Vanguard Real Estate Advisors is pleased to present the exclusive opportunity to purchase the Princeton Duplexes located in Princeton, Texas. This investment opportunity totals 9 units spread over 4.5 duplexes, all of which are part of a larger stand-alone subdivision, these average a spacious 1,642 square feet and are situated one mile north of Highway 380. The two-story duplex rental units were constructed in 2014, each with four bedrooms with the exception of one unit being a three bedroom configuration. The Princeton Duplexes can benefit from a new investor making light interior renovations to the units and increasing occupancy in order to further enhance revenue. Upon a future exit, the Property provides investors the flexibility either to sell homes individually at full market or retail value to capitalize on the strong Duplex and Townhome demand or to exit as a rental portfolio. Call us to schedule a tour.
-
2025-12-23$569,032 Active 564-char remark
Show marketing remark (564 chars)
813 & 815 E College St are adjacent, matching duplex-style assets in Princeton, offering a clean, scalable two-address acquisition for investors or an owner-user looking for flexible use. Each property is recorded at ~1,614 SF and built in 2014, with a functional 4-bed, 2-bath layout and ~0.16-acre lot sizing—ideal for stable rental demand, house-hack potential, or a small portfolio foothold with side-by-side control on the same block. Contact agent as there are additional duplexes for sale in the same subdivision in conjunction with this offering.
-
2025-06-13historical
-
2025-05-12price $275,000
-
2025-04-10$287,500 Active
-
2025-03-27historical
-
2024-12-02$575,000 Active
ⓘ Source: listings_history table (triggers on properties + properties_extension) + one-shot
backfill from property_details.listing_events for pre-trigger history.
Tax reassessment forecast TX · Resets to sale price
- Current annual tax
- $4,386 · $366/mo
- Projected year-2 tax
- $9,516 · $793/mo
- Expected delta
- +$5,130/yr (+$427/mo · 116.9%)
ⓘ Screening estimate from a state-policy table — verify with the county assessor before closing.
Climate risk First Street
- Flood 1/10 Low FEMA zone X (unshaded) · 0% chance over 30 yrs
- Wildfire 5/10 Major
- Heat 7/10 Severe 7 d/yr ≥110°F today · 24 d/yr by 30 yrs out
- Wind 6/10 Major 27% chance of damaging wind over 30 yrs
- Air quality 3/10 Moderate 3 unhealthy d/yr today · 3 by 30 yrs out
Nearby sold comps map
Loading sold comps map…
Walkable amenities ~0.75 mi
Loading nearby amenities…
Taxation est. · year 1
- Rental income
- $51,900
- − Mortgage interest
- −$29,128
- − Property taxes
- −$4,386
- − Insurance
- −$2,600
- − Repairs & maintenance
- −$4,152
- − Management
- −$4,152
- − Depreciation
- −$15,127
- Taxable loss
- −$7,646
- Est. tax savings @ 24.0%
- +$1,835
- After-tax cash flow
- $3,126/yr
For passive investors: Depreciation is non-cash, so a rental often shows a tax loss while cash-flowing — sheltering income. Rental losses are passive: they offset passive income freely, and up to $25,000/yr can offset ordinary (W-2) income if you actively participate and your MAGI is under $100k (phasing out to $0 by $150k); unused losses carry forward. On sale, claimed depreciation is recaptured at up to 25%, and gains may owe capital-gains tax (a 1031 exchange can defer both). Figures are a year-1 estimate at your 24.0% rate — not tax advice; consult a CPA.
Schools (NCES district)
- District
- Princeton ISD
- NCES district ID
- 4835850
- Math proficiency
- 51% ▼ -8.00%
- Reading proficiency
- 47% ▬ 0.00%
- Median HH income
- $54,827
- Composite
- 42.44/100
- National rank
- #3226
- State rank
- #188 of 826 in TX
Livability — Princeton
- Score
- 62/100
- State rank
- #969
- US rank
- #17215
Category grades
Schools grade is shown separately in the Schools card above.
Census & demographics
- Census place
- Princeton, TX
- County
- Collin County · 1,159,394 people
- City population
- 34,171
- Metro
- Dallas-Fort Worth-Arlington, TX
- Population (ZIP)
- 34,171
- Household income
- $100,037
- Rent vs Own
- Severe rent burden
- 368.0
Population outlook (Collin County) Hauer SSP2
- Today (2025)
- 1,210,074 people
- By 2030
- 1,358,201 · +12.2%
- By 2040
- 1,654,061 · +36.7%
- By 2050
- 1,937,359 · +60.1%
- By 2075
- 2,567,039 · +112.1%
- By 2100
- 2,952,048 · +144.0%
Race, ethnicity, and origin ACS 2023
- Neighborhood character
- Diverse neighborhood (Simpson 0.66)
- Race & ethnicity
- White 47% Hispanic / Latino 30% Black 17% Two or more races 10% Asian 4% Native American 1%
- Hispanic origin (detail)
- Mexican 26%
- Common ancestry
- Lithuanian 2% Romanian 1% Russian 1%
- Foreign-born
- 15% · Canada, China, Mexico
- Languages at home
- 70% English-only · Spanish 22% Other Indo-European 2% Other Asian/Pacific 1%
Political lean MEDSL · Collin
- 2024 margin
- R (+11.1) · D 43.1% · R 54.3% · Other 2.6%
- 2008→2024 swing
- +14.4pp toward D · 2008: -25.6pp · 2024: -11.1pp
- All cycles
- 2024: R+11.1 2020: R+4.3 2016: R+17.0 2012: R+31.6 2008: R+25.6
Not yet ingested
- Civics
- —
Market trends
- HPI YoY
- ▼ -103.99%
- Current HPI
- 238.9373
- Rent YoY
- ▼ -1.02%
- Metro
- Dallas-Fort Worth-Arlington, TX
- State GDP YoY
- ▲ 3.95%
- F500 in state
- 110
Industry mix (Fortune 500 HQ in TX)
| Industry | F500 HQs | Revenue |
|---|---|---|
| Energy | 16 | $1,198B |
|
||
| Technology | 5 | $198B |
|
||
| Engineering / Construction | 4 | $72B |
|
||
| Energy Services | 3 | $60B |
|
||
| Utilities | 3 | $41B |
|
||
| Healthcare | 2 | $330B |
|
||
Price history
+307.0% since first listed11 events — show timeline
- 2026-05-01 Price Changed $2,340,000 NTREIS
- 2026-04-30 Price Changed $520,000 NTREIS
- 2026-02-13 Price Changed $508,571 NTREIS
- 2026-02-13 Price Changed $2,860,000 NTREIS
- 2026-01-14 Listed $3,200,000 NTREIS
- 2025-12-23 Listed $569,032 NTREIS
- 2025-06-13 Listing Removed — NTREIS
- 2025-05-12 Price Changed $275,000 NTREIS
- 2025-04-10 Listed $287,500 NTREIS
- 2025-03-27 Listing Removed — NTREIS
- 2024-12-02 Listed $575,000 NTREIS
Property tax history
+16.5%/yrLatest (2025): $4,386 · -13.4% YoY. Source: county tax records.
Cash-flow waterfall
monthlySold comps — $/sqft
last 12 mo · ≤1 miLoading sold comps…