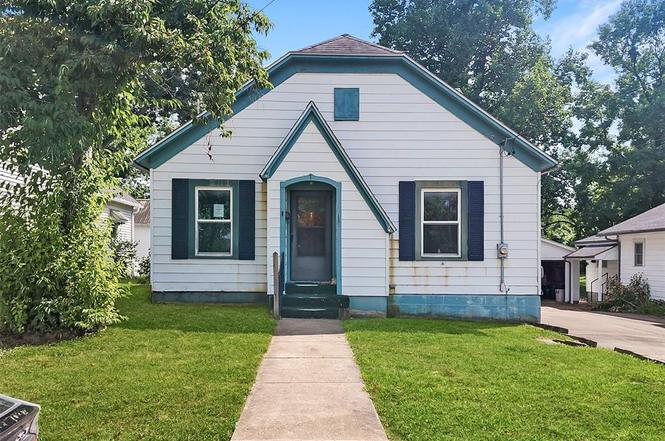
7 Mill St · Bonne Terre, MO
Flood risk 1/10 · Minimal
- FEMA flood zone
- X (unshaded)
- Chance of flooding over 30 yrs
- 0.0%
- Est. flood insurance / yr
- $473 – $860
Fire risk 3/10 · Minor
- Est. fire insurance / yr
- $1,054 – $1,958
Heat risk 4/10 · Minor
- Hot days now (above 105°F)
- 7 days/yr
- Hot days in 30 yrs
- 21 days/yr
Wind risk 2/10 · Minimal
- Chance of severe wind over 30 yrs
- 1.0%
Air-quality risk 1/10 · Minimal
- Unhealthy air days now
- 0 days/yr
- Unhealthy air days in 30 yrs
- 0 days/yr
Risk factors via First Street. Map © Google.
Why this score? — see what drove the B- grade
The composite is a weighted blend of 9 inputs, each scored 0–100. Each bar is that input's sub-score; the figure is the points it added to the 100-point composite (weight × sub-score).
- Cash flow +30.0/30.0
- DSCR +10.0/10.0
- 1% rule +7.8/10.0
- ARV discount +7.5/15.0
- Schools +3.0/10.0
- Livability +2.8/5.0
- Rent growth +2.5/5.0
- Condition / age +2.5/5.0
- Appreciation +0.0/10.0
$92,500
🖨 Deal sheet 📄 Offer letter ✓ Due diligence
Listing remarks
Step into the opportunity of a lifetime with this 3-bedroom, 1-bath home brimming with character and ready for your personal touch. Nestled in a well-established neighborhood, this diamond in the rough is perfect for buyers with vision and heart—those who can see the beauty behind the brushstrokes and are ready to create something truly special. With a little TLC, this could be the cozy haven you’ve been dreaming of. The generous yard, natural light, make this property a standout for those seeking both potential and value.
Key facts
- 0.25 acre lot
- 2 garage spots
- Built 1920
Property features AI
Exterior
- Parking: Attached garage with 2 spaces
- Utilities: Electric service by Ameren; Electricity available
- Home design: Single-family residence; One level
- Construction: Aluminum siding
- Exterior features: Front yard; Back yard
Interior
- Bedrooms: 3 bedrooms total (2 on the main level, 1 on the upper level)
- Bathrooms: 1 full bathroom
- Heating & cooling: Forced air heating; Central air conditioning
- Interior features: Full basement
Neighborhood map
What this means for you Summary
Snapshot
- This is a 3-bed/1.0-bath other listed at $92k.
Deal economics
- At list price, monthly cash flow is $347 ($4k/yr) — positive.
- The deal already cash-flows at list — no discount required.
- Meets the 1% rule at list price ($1k rent vs $92k).
- Recommended offer: $81k (12.0% below list) — sets the bar for market timing.
- Cap rate 10.8% vs local median 4.4% in Bonne Terre — top-decile yield for the area; either an underpriced asset or a hidden risk that comps aren't pricing in. Stress-test before assuming the spread holds.
Location & tenants
- Location reads 56/100 on livability (#721 in MO) — a working-class tenant base; expect higher turnover. Strengths: cost of living A+, housing A+, crime B+; Watch: employment D, amenities F, commute F.
- North St. Francois County R-I (town): math 29% / reading 42% proficiency, ranked #214 of 324 in MO (top 66%) — families likely to look elsewhere, expect single-tenant / working-renter base with shorter leases.
- Zoned schools: North County Primary (750 students, 56% FRL); North Co. Sr. High (math 25% / reading 56%, grade F, #240 of 521 statewide, top 46%, 873 students, 48% FRL) — zoned schools at 52% FRL track the district average.
- Market conditions: 131 active listings in the ZIP; 134 units permitted in St. Francois County in 2024 (32 in 5+ unit buildings).
Forward outlook
- Local home prices are declining (-3.0%/yr); year-one equity from $640 of loan paydown is wiped out by about $3k of value loss. Plan a longer hold.
- At projected returns (-3.0% appreciation + 3.0% rent growth), your $26k cash investment doubles in ~8 years — after that, you're playing with house money.
Negotiation context
- It's been on market 295 days — a 12% lower offer ($81k) is reasonable based on typical stale-listing flexibility.
Risks & watch-outs
- Watch-outs: built in 1920 — expect roof / HVAC / electrical / plumbing capex.
Questions for the listing agent
- It's been on market 295 days. Have you received any prior offers? Is the seller open to a 12% concession, seller financing, or rate buy-down credit?
- Built in 1920 — when were the roof, HVAC, electrical panel, plumbing, and water heater last replaced?
- Why hasn't it sold? Are there any deal-killer items the seller is aware of (foundation, flood, title, zoning, code violations)?
- Is there a deadline driving the sale (1031 exchange, divorce, estate, relocation)? That informs how much negotiation room exists.
- Schools are F-rated, which usually means shorter tenancies and higher turnover. Who's the typical renter profile here, and what's been the actual vacancy rate?
- What's the average days-on-market for RENTAL listings here right now (not sales)? A rising rental-DOM trend means longer vacancies and softer asking-rent achievability than the comps imply.
- What's the recent tenant-quality profile in this submarket — average credit score on applications, eviction rate, late-payment / NSF rate, and stable-employment percentage? A property-management company in the area should have these aggregated.
- How much new for-sale + rental construction is in the pipeline within 1–3 miles? Heavy new supply typically softens prices + rents 12–24 months out; constrained supply supports both.
Investment metrics
- 1% rule
- 1.28% ✓
- Cap rate
- 10.80%
- Cash-on-cash
- 16.09%
- DSCR
- 1.72
- GRM
- 6.5
CMA / ARV
No comps found within radius.
Projected returns pro-forma
-3.0% appreciation · 3.0% rent growth · sell at horizon
- IRR
- 7.0%
- Equity multiple
- 1.27×
- Total profit
- $7,116
- Equity at exit
- $13,792
- IRR
- 16.3%
- Equity multiple
- 2.34×
- Total profit
- $34,622
- Equity at exit
- $7,998
Cash invested: $25,900 (down + closing). Projections, not guarantees.
Landlord ↔ Tenant lean methodology
- Overall (STATE)
- 81 Strongly Landlord-Friendly
- State Missouri
- 81 Strongly Landlord-Friendly · R+10
- County
- — inherits STATE
- City
- — inherits STATE
ZIP-level market 63628
- Home prices YoY
- -7.2%
- Active inventory
- 131
- Price-to-rent
- 6.5×
Monthly cashflow live
- Estimated rent
- $1,184 medium interval (Pro) →
- Mortgage (P&I)
- −$485
- Tax from tax record
- −$64 /mo · $774/yr
- Insurance
- −$39
- HOA
- −$0
- Vacancy / Maint / Mgmt
- −$249
- Net cashflow
- $347
Break-even live
UW: 25.0% down · 7.5% · 30yr · 1.5% tax · 5.0% vac · 8.0% maint · 8.0% mgmt
Financing live
Cash to close
- Down payment
- $23,125
- Closing costs
- $2,775
- Reserves months
- —
- Total cash needed
- —
Loan-product check · same deal, 3 products live
Conventional
25% down · 7.5% · 30yr
- Down + closing
- —
- Monthly P&I
- —
- Monthly cashflow
- —
- DSCR
- —
- Eligible?
- —
Personal DTI + credit; lowest rate.
DSCR
20% down · 8.5% · 30yr
- Down + closing
- —
- Monthly P&I
- —
- Monthly cashflow
- —
- DSCR
- —
- Eligible?
- —
No personal income docs; deal must DSCR.
Hard money
10% down · 12.0% · 12mo
- Down + closing
- —
- Monthly P&I
- —
- Monthly cashflow
- —
- DSCR
- —
- Eligible?
- —
Short-term bridge; refi at stabilization.
Listing history 13 events
-
2026-05-31status $92,500 Pending 295 DOM
-
2026-05-13price $92,500
-
2026-04-11price $99,900
-
2026-03-18price $104,900
-
2026-02-16price $109,900
-
2026-02-06price $112,000
-
2026-01-06price $117,500
-
2025-12-11price $123,500
-
2025-11-11price $129,900
-
2025-10-10price $134,900
-
2025-09-09price $139,900
-
2025-08-09$144,900 Active
-
2019-07-01soldstatus
ⓘ Source: listings_history table (triggers on properties + properties_extension) + one-shot
backfill from property_details.listing_events for pre-trigger history.
Tax reassessment forecast MO · Resets to sale price
- Current annual tax
- $774 · $64/mo
- Projected year-2 tax
- $897 · $75/mo
- Expected delta
- +$123/yr (+$10/mo · 15.9%)
ⓘ Screening estimate from a state-policy table — verify with the county assessor before closing.
Climate risk First Street
- Flood 1/10 Low FEMA zone X (unshaded) · 0% chance over 30 yrs
- Wildfire 3/10 Moderate
- Heat 4/10 Moderate 7 d/yr ≥105°F today · 21 d/yr by 30 yrs out
- Wind 2/10 Low 100% chance of damaging wind over 30 yrs
- Air quality 1/10 Low 0 unhealthy d/yr today · 0 by 30 yrs out
Nearby sold comps map
Loading sold comps map…
Walkable amenities ~0.75 mi
Loading nearby amenities…
Taxation est. · year 1
- Rental income
- $14,209
- − Mortgage interest
- −$5,181
- − Property taxes
- −$774
- − Insurance
- −$462
- − Repairs & maintenance
- −$1,137
- − Management
- −$1,137
- − Depreciation
- −$2,691
- Taxable income
- $2,826
- Est. tax owed @ 24.0%
- −$678
- After-tax cash flow
- $3,489/yr
For passive investors: Depreciation is non-cash, so a rental often shows a tax loss while cash-flowing — sheltering income. Rental losses are passive: they offset passive income freely, and up to $25,000/yr can offset ordinary (W-2) income if you actively participate and your MAGI is under $100k (phasing out to $0 by $150k); unused losses carry forward. On sale, claimed depreciation is recaptured at up to 25%, and gains may owe capital-gains tax (a 1031 exchange can defer both). Figures are a year-1 estimate at your 24.0% rate — not tax advice; consult a CPA.
Schools (NCES district)
- District
- North St. Francois County R-I
- NCES district ID
- 2905430
- Math proficiency
- 29% ▼ -15.00%
- Reading proficiency
- 42% ▼ -5.00%
- Median HH income
- $40,156
- Composite
- 29.77/100
- National rank
- #6431
- State rank
- #214 of 324 in MO
Livability — Bonne Terre
- Score
- 56/100
- State rank
- #721
- US rank
- #23087
Category grades
Schools grade is shown separately in the Schools card above.
Census & demographics
- Census place
- Bonne Terre, MO
- Population (ZIP)
- 15,864
Population outlook (St. Francois County) Hauer SSP2
- Today (2025)
- 68,683 people
- By 2030
- 69,574 · +1.3%
- By 2040
- 70,665 · +2.9%
- By 2050
- 70,708 · +2.9%
- By 2075
- 67,917 · -1.1%
- By 2100
- 56,563 · -17.6%
Race, ethnicity, and origin ACS 2023
- Neighborhood character
- Predominantly White (87%)
- Race & ethnicity
- White 87% Black 5% Two or more races 5% Asian 1%
- Common ancestry
- Lithuanian 6% Italian 3% Slovak 2%
- Foreign-born
- 1% · Canada
- Languages at home
- 98% English-only · Other Indo-European 1%
Political lean MEDSL · St. Francois
- 2024 margin
- Solid R (+51.4) · D 23.8% · R 75.2%
- 2008→2024 swing
- -46.8pp toward R · 2008: -4.6pp · 2024: -51.4pp
- All cycles
- 2024: R+51.4 2020: R+48.1 2016: R+45.4 2012: R+19.5 2008: R+4.6
Not yet ingested
- Civics
- —
Market trends
- HPI YoY
- ▼ -18.15%
- Current HPI
- 234.0946
- Rent YoY
- —
- Metro
- —
- State GDP YoY
- ▲ 1.84%
- F500 in state
- 20
Industry mix (Fortune 500 HQ in MO)
| Industry | F500 HQs | Revenue |
|---|---|---|
| Healthcare | 1 | $163B |
|
||
| Insurance | 1 | $21B |
|
||
| Industrial Technology | 1 | $17B |
|
||
| Retail | 1 | $16B |
|
||
| Industrial Distribution | 1 | $10B |
|
||
| Utilities | 1 | $9B |
|
||
Price history
-36.2% since first listed12 events — show timeline
- 2026-05-13 Price Changed $92,500 MARIS as Distributed by MLS Grid
- 2026-04-11 Price Changed $99,900 MARIS as Distributed by MLS Grid
- 2026-03-18 Price Changed $104,900 MARIS as Distributed by MLS Grid
- 2026-02-16 Price Changed $109,900 MARIS as Distributed by MLS Grid
- 2026-02-06 Price Changed $112,000 MARIS as Distributed by MLS Grid
- 2026-01-06 Price Changed $117,500 MARIS as Distributed by MLS Grid
- 2025-12-11 Price Changed $123,500 MARIS as Distributed by MLS Grid
- 2025-11-11 Price Changed $129,900 MARIS as Distributed by MLS Grid
- 2025-10-10 Price Changed $134,900 MARIS as Distributed by MLS Grid
- 2025-09-09 Price Changed $139,900 MARIS as Distributed by MLS Grid
- 2025-08-09 Listed $144,900 MARIS as Distributed by MLS Grid
- 2019-07-01 Sold (Public Records) — Public Records
Property tax history
+1.8%/yrLatest (2025): $774 · +12.2% YoY. Source: county tax records.
Cash-flow waterfall
monthlySold comps — $/sqft
last 12 mo · ≤1 miLoading sold comps…