2212 Holly St · Fayetteville, AR
Flood risk 1/10 · Minimal
- FEMA flood zone
- X (unshaded)
- Chance of flooding over 30 yrs
- 0.0%
- Est. flood insurance / yr
- $507 – $1,088
Fire risk 4/10 · Minor
- Est. fire insurance / yr
- $1,499 – $2,785
Heat risk 5/10 · Moderate
- Hot days now (above 105°F)
- 7 days/yr
- Hot days in 30 yrs
- 20 days/yr
Wind risk 2/10 · Minimal
- Chance of severe wind over 30 yrs
- 2.0%
Air-quality risk 1/10 · Minimal
- Unhealthy air days now
- 0 days/yr
- Unhealthy air days in 30 yrs
- 0 days/yr
Risk factors via First Street. Map © Google.
Why this score? — see what drove the C- grade
The composite is a weighted blend of 9 inputs, each scored 0–100. Each bar is that input's sub-score; the figure is the points it added to the 100-point composite (weight × sub-score).
- Cash flow +15.8/30.0
- ARV discount +12.9/15.0
- DSCR +4.9/10.0
- Livability +4.2/5.0
- Schools +4.1/10.0
- 1% rule +3.6/10.0
- Rent growth +3.0/5.0
- Condition / age +2.5/5.0
- Appreciation +0.0/10.0
$349,000
🖨 Deal sheet 📄 Offer letter ✓ Due diligence
Listing remarks
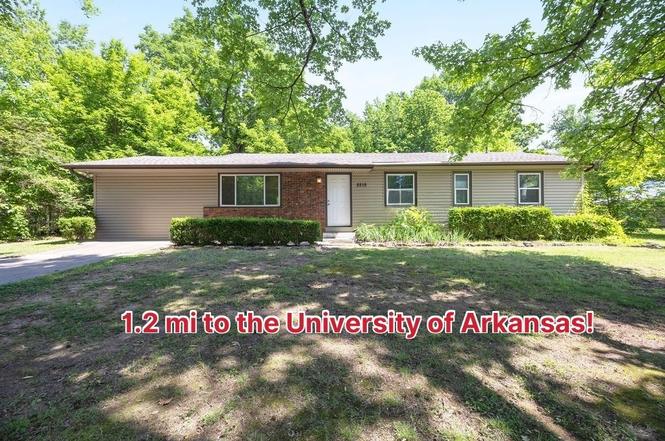
Tucked beneath a canopy of mature trees just 1.2 mi to the University of Arkansas, this quaint 5-bed, 3-bath ranch offers 1838 sq ft of character in one of Fayetteville's easiest locations, just off Porter Rd. Spacious rooms and picture windows bring room to spread out and lots of natural light. Enjoy the large fenced backyard with a patio, fire pit area, and room to play. 5 bedrooms is a commodity in this neighborhood- a big advantage for anyone looking for those extra rooms! Walk to Asbell Park just a half mile down the road with Wilson Park also just 2 miles away. The roof was replaced in June 2020. Full home plumbing replaced in March 2026. Welcome home to Holly Street!
Key facts
- Walk to asbell park
- Fire pit area
- Patio
Tags
Property features AI
Finance
- HOA & community: Monthly HOA/association fee; Community features include biking trails, sidewalks, parks, and proximity to schools
Exterior
- Parking: Concrete driveway
- Security: Smoke detector(s)
- Utilities: Electricity available; Public water; Public sewer; Recycling collection
- Home design: Single-story home; Brick and vinyl siding construction; Architectural shingle roof
- Construction: Brick and vinyl siding; Architectural and shingle roof
- Exterior features: Concrete driveway; Patio; Outbuilding; Chain link and partial fencing; Cleared, level city lot near a park in a subdivision; Public, paved road frontage
Interior
- Kitchen: Electric cooktop; Electric range; Range hood; Microwave; Dishwasher; Refrigerator
- Flooring: Laminate; Simulated wood; Wood
- Bathrooms: 3 full bathrooms
- Heating & cooling: Gas heating; Central air conditioning
- Interior features: Ceiling fans; Blinds and window treatments
- Laundry & utility: Washer hookup; Dryer hookup; Washer; Dryer; Gas water heater
Neighborhood map
What this means for you Summary
Snapshot
- This is a 5-bed/3.0-bath single-family listed at $349k.
Deal economics
- At list price, monthly cash flow is $162 ($2k/yr) — positive.
- The deal already cash-flows at list — no discount required.
- To meet the 1% rule (rent ≥ 1% of price), the offer needs to be $300k (14.0% below list).
- Recommended offer: $300k (14.0% below list) — sets the bar for 1% rule.
- Cap rate 6.9% vs local median 3.5% in Fayetteville — top-decile yield for the area; either an underpriced asset or a hidden risk that comps aren't pricing in. Stress-test before assuming the spread holds.
Location & tenants
- Location reads 83/100 on livability (#3 in AR, #871 nationally) — a professional / high-income tenant draw. Strengths: amenities A+, commute A+, health & safety A+; Watch: employment D+, crime D-.
- Fayetteville School District (urban): math 50% / reading 49% proficiency, ranked #19 of 238 in AR (top 8%) — families likely to look elsewhere, expect single-tenant / working-renter base with shorter leases.
- Market conditions: Rents rising (+2.0%/yr); 309 active listings in the ZIP; 18 comparable units currently listed for rent nearby; rentals lingering (median 44d on market — plan ~5-8 weeks vacancy on turnover, expect pricing pressure); 56% of comp listings sitting > 30 days — soft ceiling on asking rent; 3,494 units permitted in Washington County in 2024 (1,497 in 5+ unit buildings).
- At $3,002/mo this rent would consume 59% of the median local household income ($61k/yr) (locally 2372% of renters already pay >50% of income on rent) — very limited rent-growth headroom before tenants either downsize or default.
Forward outlook
- Local home prices are declining (-3.0%/yr); year-one equity from $2k of loan paydown is wiped out by about $10k of value loss. Plan a longer hold.
- Washington County population projected at +47% by 2050 — long-run rental-demand tailwind backs the buy-and-hold thesis.
Negotiation context
- Only 1 days on market — expect competitive offers; lowballing is unlikely to land.
- Current owner paid $250k; 40% above their basis — modest negotiation headroom, anchor on the comps not their cost.
Risks & watch-outs
- Climate carrying-cost: extreme-heat days projected 7→20/yr by 2055 (HVAC capex compounding) — expect insurance premiums to compound above CPI over the hold.
Questions for the listing agent
- Built in 1963 — when were the roof, HVAC, electrical panel, plumbing, and water heater last replaced?
- Is there a deadline driving the sale (1031 exchange, divorce, estate, relocation)? That informs how much negotiation room exists.
- Schools are B-rated — typically a magnet for longer-tenancy family renters. What's the average tenant stay here, and is there a school-zone premium baked into asking?
- Crime grade is D in this area — have there been break-ins, vandalism, or insurance claims at this property in the last 3 years? What carrier currently insures it and at what premium?
- What's the average days-on-market for RENTAL listings here right now (not sales)? A rising rental-DOM trend means longer vacancies and softer asking-rent achievability than the comps imply.
- What's the recent tenant-quality profile in this submarket — average credit score on applications, eviction rate, late-payment / NSF rate, and stable-employment percentage? A property-management company in the area should have these aggregated.
- How much new for-sale + rental construction is in the pipeline within 1–3 miles? Heavy new supply typically softens prices + rents 12–24 months out; constrained supply supports both.
Investment metrics
- 1% rule
- 0.86% ✗
- Cap rate
- 6.85%
- Cash-on-cash
- 1.99%
- DSCR
- 1.09
- GRM
- 9.7
CMA / ARV
- ARV (on-the-fly)
- $397,008
- Comps found
- 6
Show comp detail 6 sales within ~0.75 mi
| Address | Dist | Beds/Ba | Sqft | Sold | Price | $/sf | Match |
|---|---|---|---|---|---|---|---|
| 1237 N Vista Pl | 0.20mi | 4/2.0 (-1) | 1,849 (+1%) | 9mo | $280,000 | $151 | 73 |
| 2401 Valley Dr | 0.21mi | 4/2.0 (-1) | 1,819 (-1%) | 24mo | $280,000 | $154 | 60 |
| 2547 W Arthur Hart St | 0.35mi | 4/2.0 (-1) | 1,953 (+6%) | 6mo | $421,000 | $216 | 60 |
| 2029 Lawson St | 0.10mi | 4/3.0 (-1) | 1,644 (-11%) | 20mo | $373,500 | $227 | 56 |
| 629 N Gray Ave | 0.68mi | 4/2.5 (-1) | 1,830 (-0%) | 9mo | $475,000 | $260 | 53 |
| 1363 Hendrix St | 0.62mi | 4/2.0 (-1) | 1,728 (-6%) | 20mo | $348,500 | $202 | 36 |
Match score weights: distance 35% · size 25% · config 20% · recency 20%. Top-matched comps best support the ARV.
Projected returns pro-forma
-3.0% appreciation · 2.01% rent growth · sell at horizon
- IRR
- -14.2%
- Equity multiple
- 0.50×
- Total profit
- $-49,257
- Equity at exit
- $52,037
- IRR
- -7.0%
- Equity multiple
- 0.57×
- Total profit
- $-41,815
- Equity at exit
- $30,175
Cash invested: $97,720 (down + closing). Projections, not guarantees.
Landlord ↔ Tenant lean methodology
- Overall (STATE)
- 92 Strongly Landlord-Friendly
- State Arkansas
- 92 Strongly Landlord-Friendly · R+14
- County
- — inherits STATE
- City
- — inherits STATE
ZIP-level market 72703
- Rents YoY
- 2.0%
- Active inventory
- 309
- Price-to-rent
- 9.7×
Monthly cashflow live
- Estimated rent
- $3,002 high interval (Pro) →
- Mortgage (P&I)
- −$1,830
- Tax from tax record
- −$234 /mo · $2,803/yr
- Insurance
- −$145
- HOA
- −$0
- Vacancy / Maint / Mgmt
- −$630
- Net cashflow
- $162
Break-even live
UW: 25.0% down · 7.5% · 30yr · 1.5% tax · 5.0% vac · 8.0% maint · 8.0% mgmt
Financing live
Cash to close
- Down payment
- $87,250
- Closing costs
- $10,470
- Reserves months
- —
- Total cash needed
- —
Loan-product check · same deal, 3 products live
Conventional
25% down · 7.5% · 30yr
- Down + closing
- —
- Monthly P&I
- —
- Monthly cashflow
- —
- DSCR
- —
- Eligible?
- —
Personal DTI + credit; lowest rate.
DSCR
20% down · 8.5% · 30yr
- Down + closing
- —
- Monthly P&I
- —
- Monthly cashflow
- —
- DSCR
- —
- Eligible?
- —
No personal income docs; deal must DSCR.
Hard money
10% down · 12.0% · 12mo
- Down + closing
- —
- Monthly P&I
- —
- Monthly cashflow
- —
- DSCR
- —
- Eligible?
- —
Short-term bridge; refi at stabilization.
Rent comps 18 comps
| Address | Beds | Baths | Sqft | Rent | $/sqft | DOM | Units | Dist |
|---|---|---|---|---|---|---|---|---|
| 1708 N Sang Ave Fayetteville, AR | 4.0 | 3.0 | 1660 | $2,400 | $1.45 | 21d | 3 | 0.37mi |
| 1140 N Valley View Dr Fayetteville, AR | 4.0 | 2.0 | 1400 | $700 | $0.50 | 44d | 1 | 0.42mi |
| 2110 Loren Cir Unit 1241309P Fayetteville, AR | 4.0 | 2.0 | 1722 | $5,101 | $2.96 | 14d | 1 | 0.59mi |
| 1223 Haven Dr Fayetteville, AR | 2.0–4.0 | 2.0–4.0 | 1146 | $2,660 | $2.32 | 21d | 1 | 0.71mi |
| 3001 W Wedington Dr Fayetteville, AR | 1.0–4.0 | 1.0–2.5 | 1000 | $1,595 | $1.59 | 44d | 3 | 0.82mi |
| 2085 N Penelope Ln Fayetteville, AR | 4.0 | 2.5 | 2101 | $2,500 | $1.19 | 44d | 1 | 0.89mi |
| 1150 N Oakland Ave Fayetteville, AR | 4.0 | 3.0 | 1800 | $3,300 | $1.83 | 21d | 1 | 0.97mi |
| 909 W Eagle St Unit 1297036P Fayetteville, AR | 6.0 | 6.5 | 2615 | $16,490 | $6.31 | 44d | 1 | 1.03mi |
| 667 N Salem Rd Fayetteville, AR | 4.0 | 3.5 | 1763 | $2,895 | $1.64 | 44d | 1 | 1.15mi |
| 740 N Malbec Rd Fayetteville, AR | 4.0 | 2.5 | 1785 | $2,895 | $1.62 | 44d | 1 | 1.17mi |
| 3219 W Thornbrook St Fayetteville, AR | 4.0 | 2.0 | 1846 | $2,150 | $1.16 | 23d | 1 | 1.28mi |
| 1345 N Hog Trough Dr Fayetteville, AR | 4.0 | 3.5 | 1850 | $3,200 | $1.73 | 44d | 1 | 1.30mi |
| 1275 N Gregg Ave Fayetteville, AR | 4.0 | 2.0 | 2308 | $3,000 | $1.30 | 23d | 1 | 1.31mi |
| 515 N Salem Rd Fayetteville, AR | 4.0 | 3.5 | 2202 | $2,895 | $1.31 | 44d | 1 | 1.32mi |
| 1399 N Hog Trough Dr Fayetteville, AR | 2.0–4.0 | 2.5–3.5 | 1660 | $3,600 | $2.17 | 14d | 5 | 1.32mi |
| 393 N Ainsley Loop Unit 1221838P Fayetteville, AR | 4.0 | 3.0 | 2217 | $5,866 | $2.65 | 44d | 1 | 1.37mi |
| 873 W Clinton Dr Unit 1 Fayetteville, AR | 4.0 | 2.0 | 1450 | $2,800 | $1.93 | 44d | 1 | 1.49mi |
| 614 W Lafayette St Unit 1221896P Fayetteville, AR | 5.0 | 4.0 | 2443 | $13,330 | $5.46 | 23d | 1 | 1.50mi |
Listing history 2 events
-
2026-06-18remarks 682-char remark
-
2026-06-18$349,000 Active 1 DOM
ⓘ Source: listings_history table (triggers on properties + properties_extension) + one-shot
backfill from property_details.listing_events for pre-trigger history.
Tax reassessment forecast AR · Resets to sale price
- Current annual tax
- $2,803 · $234/mo
- Projected year-2 tax
- $2,803 · $234/mo
- Expected delta
- $0/yr ($0/mo · 0.0%)
ⓘ Screening estimate from a state-policy table — verify with the county assessor before closing.
Climate risk First Street
- Flood 1/10 Low FEMA zone X (unshaded) · 0% chance over 30 yrs
- Wildfire 4/10 Moderate
- Heat 5/10 Major 7 d/yr ≥105°F today · 20 d/yr by 30 yrs out
- Wind 2/10 Low 2% chance of damaging wind over 30 yrs
- Air quality 1/10 Low 0 unhealthy d/yr today · 0 by 30 yrs out
Nearby sold comps map
Loading sold comps map…
Walkable amenities ~0.75 mi
Loading nearby amenities…
Taxation est. · year 1
- Rental income
- $36,022
- − Mortgage interest
- −$19,549
- − Property taxes
- −$2,803
- − Insurance
- −$1,745
- − Repairs & maintenance
- −$2,882
- − Management
- −$2,882
- − Depreciation
- −$10,153
- Taxable loss
- −$3,991
- Est. tax savings @ 24.0%
- +$958
- After-tax cash flow
- $2,905/yr
For passive investors: Depreciation is non-cash, so a rental often shows a tax loss while cash-flowing — sheltering income. Rental losses are passive: they offset passive income freely, and up to $25,000/yr can offset ordinary (W-2) income if you actively participate and your MAGI is under $100k (phasing out to $0 by $150k); unused losses carry forward. On sale, claimed depreciation is recaptured at up to 25%, and gains may owe capital-gains tax (a 1031 exchange can defer both). Figures are a year-1 estimate at your 24.0% rate — not tax advice; consult a CPA.
Schools (NCES district)
- District
- Fayetteville School District
- NCES district ID
- 0506120
- Math proficiency
- 50% ▼ -11.00%
- Reading proficiency
- 49% ▼ -8.00%
- Median HH income
- $39,595
- Composite
- 41.39/100
- National rank
- #3477
- State rank
- #19 of 238 in AR
Livability — Fayetteville
- Score
- 83/100
- State rank
- #3
- US rank
- #871
Category grades
Schools grade is shown separately in the Schools card above.
Census & demographics
- Census place
- Fayetteville, AR
- County
- Washington County · 252,056 people
- City population
- 118,228
- Metro
- Fayetteville-Springdale-Rogers, AR
- Population (ZIP)
- 35,896
- Household income
- $60,568
- Rent vs Own
- Severe rent burden
- 2372.0
Population outlook (Washington County) Hauer SSP2
- Today (2025)
- 271,748 people
- By 2030
- 296,414 · +9.1%
- By 2040
- 346,874 · +27.6%
- By 2050
- 398,552 · +46.7%
- By 2075
- 523,309 · +92.6%
- By 2100
- 615,280 · +126.4%
Race, ethnicity, and origin ACS 2023
- Neighborhood character
- Predominantly White (75%)
- Race & ethnicity
- White 75% Two or more races 12% Hispanic / Latino 7% Black 5% Asian 3%
- Hispanic origin (detail)
- Mexican 4%
- Common ancestry
- Lithuanian 3% Slovak 2% Italian 2%
- Foreign-born
- 7% · Canada, China
- Languages at home
- 92% English-only · Spanish 3% Chinese 1% French/Haitian/Cajun 1%
Political lean MEDSL · Washington
- 2024 margin
- Lean R (+6.7) · D 45.1% · R 51.7% · Other 3.2%
- 2008→2024 swing
- +6.4pp toward D · 2008: -13.1pp · 2024: -6.7pp
- All cycles
- 2024: R+6.7 2020: R+3.9 2016: R+10.4 2012: R+16.3 2008: R+13.1
Not yet ingested
- Civics
- —
Market trends
- HPI YoY
- ▼ -269.77%
- Current HPI
- 317.7085
- Rent YoY
- ▲ 2.01%
- Metro
- Fayetteville-Springdale-Rogers, AR
- State GDP YoY
- ▲ 3.80%
- F500 in state
- 10
Industry mix (Fortune 500 HQ in AR)
| Industry | F500 HQs | Revenue |
|---|---|---|
| Retail | 1 | $681B |
|
||
| Food / Agriculture | 1 | $53B |
|
||
| Retail / Energy | 1 | $22B |
|
||
| Transportation / Logistics | 1 | $12B |
|
||
| Energy | 1 | $4B |
|
||
Price history
+405.8% since first listed5 events — show timeline
- 2026-06-18 Listed $349,000 NWARMLS
- 2021-09-27 Sold (Public Records) $250,000 Public Records
- 2016-10-06 Sold (Public Records) $128,000 Public Records
- 2003-10-31 Sold (Public Records) $97,000 Public Records
- 1999-07-23 Sold (Public Records) $69,000 Public Records
Property tax history
+9.9%/yrLatest (2025): $2,803 · +8.3% YoY. Source: county tax records.
Cash-flow waterfall
monthlySold comps — $/sqft
last 12 mo · ≤1 miLoading sold comps…