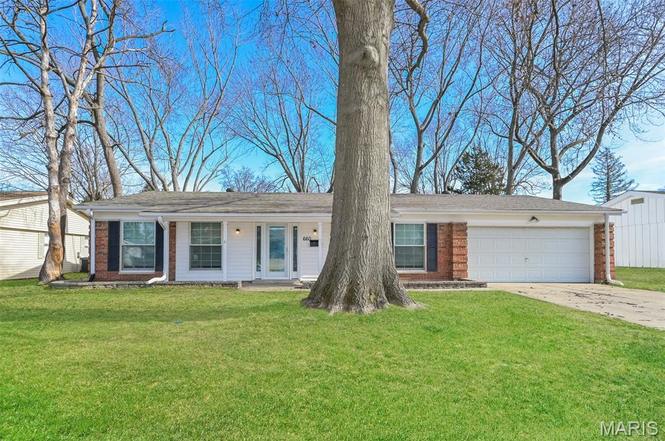
660 Brookstone Dr · Florissant, MO
Flood risk 1/10 · Minimal
- FEMA flood zone
- X (unshaded)
- Chance of flooding over 30 yrs
- 0.0%
- Est. flood insurance / yr
- $507 – $1,088
Fire risk 1/10 · Minimal
- Est. fire insurance / yr
- $1,054 – $1,958
Heat risk 5/10 · Moderate
- Hot days now (above 106°F)
- 7 days/yr
- Hot days in 30 yrs
- 21 days/yr
Wind risk 2/10 · Minimal
- Chance of severe wind over 30 yrs
- 1.0%
Air-quality risk 3/10 · Minor
- Unhealthy air days now
- 3 days/yr
- Unhealthy air days in 30 yrs
- 5 days/yr
Risk factors via First Street. Map © Google.
Why this score? — see what drove the C+ grade
The composite is a weighted blend of 9 inputs, each scored 0–100. Each bar is that input's sub-score; the figure is the points it added to the 100-point composite (weight × sub-score).
- Cash flow +17.5/30.0
- ARV discount +11.8/15.0
- Appreciation +10.0/10.0
- DSCR +5.5/10.0
- Rent growth +4.4/5.0
- 1% rule +4.2/10.0
- Livability +3.7/5.0
- Condition / age +2.5/5.0
- Schools +1.2/10.0
$205,500
🖨 Deal sheet 📄 Offer letter ✓ Due diligence
Listing remarks MLS
One owner home, in a quiet neighborhood, is looking for its new family! Lovely front porch & double door entry welcomes you into the open floorplan. This home is an entertainer’s dream w/kitchen positioned in the center of the home surrounded by the living/dining combo, spacious family rm & sunporch. Kitchen features 42-inch cabinets & plenty of counter space w/a view to backyard. Split 4 bedrm floorplan has the master suite at the front of the home and remaining 3 bedrms in the back. Master suite boasts a renovated bathrm w/new shower, toilet, vanity & flooring. Bedrms 2-4 are conveniently located outside of bathrm number 2, which was also completely renovated. Just off the family rm is a main floor mud/laundry rm w/plenty of cabinets & service door. Many rooms have been recently painted, new carpet in lvng, dining, fam, all 4 bedrms & sunrm. Sunroom overlooks fenced-in yard w/mature trees. New windows in bedrms & living rm and new front door & service door to be installed May 2021.
Key facts
- New door entry
- Renovated bathroom
- Front porch
Tags
Neighborhood map
What this means for you Summary
Snapshot
- This is a 4-bed/2.0-bath single-family listed at $206k.
Deal economics
- At list price, monthly cash flow is $158 ($2k/yr) — positive.
- The deal already cash-flows at list — no discount required.
- To meet the 1% rule (rent ≥ 1% of price), the offer needs to be $189k (8.2% below list).
- Recommended offer: $189k (8.2% below list) — sets the bar for 1% rule.
Location & tenants
- Location reads 73/100 on livability (#82 in MO) — a middle-class / working-renter tenant base. Strengths: cost of living A+, housing A+, health & safety B+; Watch: crime C-, amenities D+, commute F.
- Ferguson-Florissant R-II (suburban): math 7% / reading 20% proficiency, ranked #311 of 324 in MO (top 96%) — low school quality limits family demand, transient renter base, plan for 1-2y turnover; 70% free/reduced lunch — lower-income household profile, screen leases tightly.
- Zoned schools: Commons Lane Elementary (291 students, 99% FRL); Mccluer North High (math 5% / reading 28%, grade F, #487 of 521 statewide, top 93%, 1,136 students, 100% FRL) — zoned schools average 99% FRL vs 70% district-wide (30 pts higher); higher-poverty schools than district average — tighter screening recommended.
- Market conditions: Rents rising fast (+7.5%/yr); 218 active listings in the ZIP; 21 comparable units currently listed for rent nearby; rentals at typical pace (median 18d on market — plan ~3-4 weeks tenant-placement turnaround); 920 units permitted in St. Louis County in 2024 (250 in 5+ unit buildings).
- This rent runs 34% of the median local income ($67k/yr) — at the standard rent-burdened threshold; future hikes will face affordability resistance.
Forward outlook
- In year one you build about $22k of equity ($1k loan paydown + $21k appreciation (10.0% local appreciation)).
- At projected returns (10.0% appreciation + 7.5% rent growth), your $58k cash investment doubles in ~3 years — after that, you're playing with house money.
- By year 2, paydown + projected appreciation supports a ~$35k cash-out refi (75% LTV) — recoverable capital for the next deal without selling this one.
Negotiation context
- It's been on market 68 days — a 6% lower offer ($193k) is reasonable based on typical stale-listing flexibility.
- 2 sale attempts since 5y ago with the ask held roughly flat each time — persistent listings suggest the price (not the market) is what's stuck; bring a comps-based counter.
- Current owner paid $160k; 29% above their basis — modest negotiation headroom, anchor on the comps not their cost.
Risks & watch-outs
- Climate carrying-cost: extreme-heat days projected 7→21/yr by 2055 (HVAC capex compounding) — expect insurance premiums to compound above CPI over the hold.
Questions for the listing agent
- It's been on market 68 days. Have you received any prior offers? Is the seller open to a 8% concession, seller financing, or rate buy-down credit?
- Built in 1964 — when were the roof, HVAC, electrical panel, plumbing, and water heater last replaced?
- Why hasn't it sold? Are there any deal-killer items the seller is aware of (foundation, flood, title, zoning, code violations)?
- Is there a deadline driving the sale (1031 exchange, divorce, estate, relocation)? That informs how much negotiation room exists.
- Schools are D-rated, which usually means shorter tenancies and higher turnover. Who's the typical renter profile here, and what's been the actual vacancy rate?
- What's the average days-on-market for RENTAL listings here right now (not sales)? A rising rental-DOM trend means longer vacancies and softer asking-rent achievability than the comps imply.
- What's the recent tenant-quality profile in this submarket — average credit score on applications, eviction rate, late-payment / NSF rate, and stable-employment percentage? A property-management company in the area should have these aggregated.
- How much new for-sale + rental construction is in the pipeline within 1–3 miles? Heavy new supply typically softens prices + rents 12–24 months out; constrained supply supports both.
Investment metrics
- 1% rule
- 0.92% ✗
- Cap rate
- 7.21%
- Cash-on-cash
- 3.29%
- DSCR
- 1.15
- GRM
- 9.1
CMA / ARV
- ARV (on-the-fly)
- $227,286
- Comps found
- 12
Show comp detail 12 sales within ~0.75 mi
| Address | Dist | Beds/Ba | Sqft | Sold | Price | $/sf | Match |
|---|---|---|---|---|---|---|---|
| 660 Brookstone Dr | 0.00mi | 4/2.0 | 1,647 (0%) | 0mo | $205,500 | $125 | 100 |
| 3175 Harness Dr | 0.39mi | 4/2.0 | 1,608 (-2%) | 0mo | $240,000 | $149 | 78 |
| 2390 Grassland Dr | 0.51mi | 4/2.0 | 1,653 (+0%) | 4mo | $175,000 | $106 | 72 |
| 3940 Parker Rd | 0.37mi | 3/1.5 (-1) | 1,705 (+4%) | 4mo | $182,000 | $107 | 67 |
| 2345 Derhake Rd | 0.31mi | 3/2.5 (-1) | 1,470 (-11%) | 2mo | $215,000 | $146 | 59 |
| 100 Broadmere Dr | 0.54mi | 4/2.5 | 1,756 (+7%) | 3mo | $220,000 | $125 | 59 |
| 3075 Blackwood Dr | 0.63mi | 3/2.0 (-1) | 1,620 (-2%) | 5mo | $205,000 | $127 | 59 |
| 890 Meadowgrass Dr | 0.30mi | 4/2.5 | 1,883 (+14%) | 2mo | $224,500 | $119 | 59 |
| 2185 Pohlman Rd | 0.46mi | 4/3.0 | 1,797 (+9%) | 2mo | $299,000 | $166 | 58 |
| 1480 Stallion Dr | 0.70mi | 4/2.0 | 1,737 (+6%) | 4mo | $239,900 | $138 | 55 |
| 2325 Grassland Dr | 0.58mi | 3/2.0 (-1) | 1,525 (-7%) | 2mo | $239,000 | $157 | 54 |
| 3255 Classic Dr | 0.37mi | 3/2.0 (-1) | 1,416 (-14%) | 0mo | $250,000 | $177 | 54 |
Match score weights: distance 35% · size 25% · config 20% · recency 20%. Top-matched comps best support the ARV.
Projected returns pro-forma
10.0% appreciation · 7.51% rent growth · sell at horizon
- IRR
- 28.3%
- Equity multiple
- 3.27×
- Total profit
- $130,878
- Equity at exit
- $185,131
- IRR
- 25.9%
- Equity multiple
- 7.94×
- Total profit
- $399,225
- Equity at exit
- $399,241
Cash invested: $57,540 (down + closing). Projections, not guarantees.
Landlord ↔ Tenant lean methodology
- Overall (STATE)
- 81 Strongly Landlord-Friendly
- State Missouri
- 81 Strongly Landlord-Friendly · R+10
- County
- — inherits STATE
- City
- — inherits STATE
ZIP-level market 63033
- Home prices YoY
- 2.5%
- Rents YoY
- 7.5%
- Active inventory
- 218
- Price-to-rent
- 9.1×
Monthly cashflow live
- Estimated rent
- $1,886 high interval (Pro) →
- Mortgage (P&I)
- −$1,078
- Tax from tax record
- −$169 /mo · $2,034/yr
- Insurance
- −$86
- HOA
- −$0
- Vacancy / Maint / Mgmt
- −$396
- Net cashflow
- $158
Break-even live
UW: 25.0% down · 7.5% · 30yr · 1.5% tax · 5.0% vac · 8.0% maint · 8.0% mgmt
Financing live
Cash to close
- Down payment
- $51,375
- Closing costs
- $6,165
- Reserves months
- —
- Total cash needed
- —
Loan-product check · same deal, 3 products live
Conventional
25% down · 7.5% · 30yr
- Down + closing
- —
- Monthly P&I
- —
- Monthly cashflow
- —
- DSCR
- —
- Eligible?
- —
Personal DTI + credit; lowest rate.
DSCR
20% down · 8.5% · 30yr
- Down + closing
- —
- Monthly P&I
- —
- Monthly cashflow
- —
- DSCR
- —
- Eligible?
- —
No personal income docs; deal must DSCR.
Hard money
10% down · 12.0% · 12mo
- Down + closing
- —
- Monthly P&I
- —
- Monthly cashflow
- —
- DSCR
- —
- Eligible?
- —
Short-term bridge; refi at stabilization.
Rent comps 21 comps
| Address | Beds | Baths | Sqft | Rent | $/sqft | DOM | Units | Dist |
|---|---|---|---|---|---|---|---|---|
| 4583 Whisper Lake Dr Black Jack, MO | 1.0–5.0 | 1.0–2.5 | 1225 | $1,354 | $1.10 | 2d | 17 | 0.88mi |
| 4440 Parker Rd Black Jack, MO | 3.0 | 2.0 | 1900 | $1,711 | $0.90 | 2d | 1 | 0.89mi |
| 1600 Horseshoe Dr Florissant, MO | 3.0 | 2.0 | 1314 | $1,550 | $1.18 | 44d | 1 | 0.96mi |
| 945 Paddock Dr Florissant, MO | 4.0 | 2.0 | 1875 | $1,850 | $0.99 | 4d | 1 | 1.06mi |
| 12 Country Ln Florissant, MO | 3.0 | 2.0 | 1881 | $2,250 | $1.20 | 44d | 1 | 1.06mi |
| 3 Cantabrian Ct Florissant, MO | 3.0 | 2.0 | 1436 | $1,881 | $1.31 | 15d | 1 | 1.07mi |
| 560 Jamaica Pl Florissant, MO | 3.0 | 2.0 | 1350 | $1,653 | $1.22 | 44d | 1 | 1.14mi |
| 2075 Cordoba Dr Florissant, MO | 3.0 | 2.0 | 1523 | $1,850 | $1.21 | 15d | 1 | 1.14mi |
| 1536 Springlet Ct #31 Florissant, MO | 3.0 | 2.5 | 1161 | $1,450 | $1.25 | 7d | 1 | 1.16mi |
| 4872 Bristol Rock Rd Black Jack, MO | 4.0 | 2.0 | 1448 | $2,061 | $1.42 | 2d | 1 | 1.18mi |
| 410 Ridge Dr Florissant, MO | 3.0 | 2.0 | 1226 | $1,650 | $1.35 | 18d | 1 | 1.20mi |
| 1785 Trotter Way Florissant, MO | 3.0 | 2.0 | 1297 | $1,806 | $1.39 | 7d | 1 | 1.21mi |
| 765 Bobbins Ln Florissant, MO | 3.0 | 1.0 | 1107 | $1,450 | $1.31 | 44d | 1 | 1.23mi |
| 805 Robinwood Dr Florissant, MO | 3.0 | 1.5 | 1729 | $1,571 | $0.91 | 20d | 1 | 1.23mi |
| 790 Pebble Ln Florissant, MO | 3.0 | 2.0 | 1242 | $1,795 | $1.45 | 24d | 1 | 1.24mi |
| 100 Taney Dr Florissant, MO | 3.0 | 1.0 | 1148 | $1,495 | $1.30 | 22d | 1 | 1.28mi |
| 11635 Hazeloak Dr Black Jack, MO | 3.0 | 2.0 | 1124 | $1,728 | $1.54 | 17d | 1 | 1.28mi |
| 3585 Pershall Rd Unit Moor Ferguson, MO | 3.0 | 2.0 | 1577 | $1,500 | $0.95 | 44d | 1 | 1.35mi |
| 20 Saint Benedict Ln Florissant, MO | 3.0 | 1.5 | 1092 | $1,525 | $1.40 | 20d | 1 | 1.41mi |
| 3930 Belcroft Dr Florissant, MO | 3.0 | 3.0 | 1408 | $1,935 | $1.37 | 44d | 1 | 1.44mi |
| 1725 Saint Catherine St Florissant, MO | 3.0 | 1.0 | 1107 | $1,800 | $1.63 | 15d | 1 | 1.46mi |
Listing history 13 events
-
2026-04-27status Pending
-
2026-04-17price $205,500
-
2026-03-20price $208,600
-
2026-03-04price $211,800
-
2026-02-18$215,000 Active
-
2022-11-16historical
-
2021-08-16soldstatus
-
2021-06-18soldstatus Closed 1036-char remark
Show marketing remark (1036 chars)
One owner home, in a quiet neighborhood, is looking for its new family! Lovely front porch & double door entry welcomes you into the open floorplan. This home is an entertainer’s dream w/kitchen positioned in the center of the home surrounded by the living/dining combo, spacious family rm & sunporch. Kitchen features 42-inch cabinets & plenty of counter space w/a view to backyard. Split 4 bedrm floorplan has the master suite at the front of the home and remaining 3 bedrms in the back. Master suite boasts a renovated bathrm w/new shower, toilet, vanity & flooring. Bedrms 2-4 are conveniently located outside of bathrm number 2, which was also completely renovated. Just off the family rm is a main floor mud/laundry rm w/plenty of cabinets & service door. Many rooms have been recently painted, new carpet in lvng, dining, fam, all 4 bedrms & sunrm. Sunroom overlooks fenced-in yard w/mature trees. New windows in bedrms & living rm and new front door & service door to be installed May 2021.
-
2021-05-28soldstatus $159,500
-
2021-04-20status Pending 1036-char remark
Show marketing remark (1036 chars)
One owner home, in a quiet neighborhood, is looking for its new family! Lovely front porch & double door entry welcomes you into the open floorplan. This home is an entertainer’s dream w/kitchen positioned in the center of the home surrounded by the living/dining combo, spacious family rm & sunporch. Kitchen features 42-inch cabinets & plenty of counter space w/a view to backyard. Split 4 bedrm floorplan has the master suite at the front of the home and remaining 3 bedrms in the back. Master suite boasts a renovated bathrm w/new shower, toilet, vanity & flooring. Bedrms 2-4 are conveniently located outside of bathrm number 2, which was also completely renovated. Just off the family rm is a main floor mud/laundry rm w/plenty of cabinets & service door. Many rooms have been recently painted, new carpet in lvng, dining, fam, all 4 bedrms & sunrm. Sunroom overlooks fenced-in yard w/mature trees. New windows in bedrms & living rm and new front door & service door to be installed May 2021.
-
2021-04-16$160,000 Active 1036-char remark
Show marketing remark (1036 chars)
One owner home, in a quiet neighborhood, is looking for its new family! Lovely front porch & double door entry welcomes you into the open floorplan. This home is an entertainer’s dream w/kitchen positioned in the center of the home surrounded by the living/dining combo, spacious family rm & sunporch. Kitchen features 42-inch cabinets & plenty of counter space w/a view to backyard. Split 4 bedrm floorplan has the master suite at the front of the home and remaining 3 bedrms in the back. Master suite boasts a renovated bathrm w/new shower, toilet, vanity & flooring. Bedrms 2-4 are conveniently located outside of bathrm number 2, which was also completely renovated. Just off the family rm is a main floor mud/laundry rm w/plenty of cabinets & service door. Many rooms have been recently painted, new carpet in lvng, dining, fam, all 4 bedrms & sunrm. Sunroom overlooks fenced-in yard w/mature trees. New windows in bedrms & living rm and new front door & service door to be installed May 2021.
-
2021-04-14historical $160,000 1036-char remark
Show marketing remark (1036 chars)
One owner home, in a quiet neighborhood, is looking for its new family! Lovely front porch & double door entry welcomes you into the open floorplan. This home is an entertainer’s dream w/kitchen positioned in the center of the home surrounded by the living/dining combo, spacious family rm & sunporch. Kitchen features 42-inch cabinets & plenty of counter space w/a view to backyard. Split 4 bedrm floorplan has the master suite at the front of the home and remaining 3 bedrms in the back. Master suite boasts a renovated bathrm w/new shower, toilet, vanity & flooring. Bedrms 2-4 are conveniently located outside of bathrm number 2, which was also completely renovated. Just off the family rm is a main floor mud/laundry rm w/plenty of cabinets & service door. Many rooms have been recently painted, new carpet in lvng, dining, fam, all 4 bedrms & sunrm. Sunroom overlooks fenced-in yard w/mature trees. New windows in bedrms & living rm and new front door & service door to be installed May 2021.
-
1997-01-24soldstatus
ⓘ Source: listings_history table (triggers on properties + properties_extension) + one-shot
backfill from property_details.listing_events for pre-trigger history.
Tax reassessment forecast MO · Resets to sale price
- Current annual tax
- $2,034 · $169/mo
- Projected year-2 tax
- $2,034 · $169/mo
- Expected delta
- $0/yr ($0/mo · 0.0%)
ⓘ Screening estimate from a state-policy table — verify with the county assessor before closing.
Climate risk First Street
- Flood 1/10 Low FEMA zone X (unshaded) · 0% chance over 30 yrs
- Wildfire 1/10 Low
- Heat 5/10 Major 7 d/yr ≥106°F today · 21 d/yr by 30 yrs out
- Wind 2/10 Low 100% chance of damaging wind over 30 yrs
- Air quality 3/10 Moderate 3 unhealthy d/yr today · 5 by 30 yrs out
Nearby sold comps map
Loading sold comps map…
Walkable amenities ~0.75 mi
Loading nearby amenities…
Taxation est. · year 1
- Rental income
- $22,637
- − Mortgage interest
- −$11,511
- − Property taxes
- −$2,034
- − Insurance
- −$1,028
- − Repairs & maintenance
- −$1,811
- − Management
- −$1,811
- − Depreciation
- −$5,978
- Taxable loss
- −$1,535
- Est. tax savings @ 24.0%
- +$368
- After-tax cash flow
- $2,259/yr
For passive investors: Depreciation is non-cash, so a rental often shows a tax loss while cash-flowing — sheltering income. Rental losses are passive: they offset passive income freely, and up to $25,000/yr can offset ordinary (W-2) income if you actively participate and your MAGI is under $100k (phasing out to $0 by $150k); unused losses carry forward. On sale, claimed depreciation is recaptured at up to 25%, and gains may owe capital-gains tax (a 1031 exchange can defer both). Figures are a year-1 estimate at your 24.0% rate — not tax advice; consult a CPA.
Schools (NCES district)
- District
- Ferguson-Florissant R-II
- NCES district ID
- 2912010
- Math proficiency
- 7% ▼ -9.00%
- Reading proficiency
- 20% ▼ -6.00%
- Median HH income
- $44,610
- Composite
- 11.96/100
- National rank
- #9666
- State rank
- #311 of 324 in MO
Livability — Florissant
- Score
- 73/100
- State rank
- #82
- US rank
- #5406
Category grades
Schools grade is shown separately in the Schools card above.
Census & demographics
- Census place
- Florissant, MO
- County
- Saint Louis County · 888,823 people
- City population
- 69,104
- Metro
- St. Louis, MO-IL
- Population (ZIP)
- 43,056
- Household income
- $66,776
- Rent vs Own
- Severe rent burden
- 1429.0
Population outlook (St. Louis County) Hauer SSP2
- Today (2025)
- 1,025,227 people
- By 2030
- 1,028,023 · +0.3%
- By 2040
- 1,020,940 · -0.4%
- By 2050
- 1,007,280 · -1.8%
- By 2075
- 987,277 · -3.7%
- By 2100
- 921,984 · -10.1%
Race, ethnicity, and origin ACS 2023
- Neighborhood character
- Predominantly Black (71%)
- Race & ethnicity
- Black 71% White 23% Two or more races 4% Hispanic / Latino 1%
- Common ancestry
- Romanian 1% Lithuanian 1% Italian 1%
- Foreign-born
- 3% · Canada, Vietnam
- Languages at home
- 95% English-only · Spanish 1% French/Haitian/Cajun 1%
Political lean MEDSL · St. Louis
- 2024 margin
- Strong D (+23.4) · D 60.8% · R 37.4% · Other 1.7%
- 2008→2024 swing
- +3.5pp toward D · 2008: 19.9pp · 2024: 23.4pp
- All cycles
- 2024: D+23.4 2020: D+24.0 2016: D+16.2 2012: D+13.7 2008: D+19.9
Not yet ingested
- Civics
- —
Market trends
- HPI YoY
- ▲ 13.78%
- Current HPI
- 570.6
- Rent YoY
- ▲ 7.51%
- Metro
- St. Louis, MO-IL
- State GDP YoY
- ▲ 1.84%
- F500 in state
- 20
Industry mix (Fortune 500 HQ in MO)
| Industry | F500 HQs | Revenue |
|---|---|---|
| Healthcare | 1 | $163B |
|
||
| Insurance | 1 | $21B |
|
||
| Industrial Technology | 1 | $17B |
|
||
| Retail | 1 | $16B |
|
||
| Industrial Distribution | 1 | $10B |
|
||
| Utilities | 1 | $9B |
|
||
Price history
+28.4% since first listed13 events — show timeline
- 2026-04-27 Pending — MARIS as Distributed by MLS Grid
- 2026-04-17 Price Changed $205,500 MARIS as Distributed by MLS Grid
- 2026-03-20 Price Changed $208,600 MARIS as Distributed by MLS Grid
- 2026-03-04 Price Changed $211,800 MARIS as Distributed by MLS Grid
- 2026-02-18 Listed $215,000 MARIS as Distributed by MLS Grid
- 2022-11-16 Rental Removed — RENT.
- 2021-08-16 Sold (Public Records) — Public Records
- 2021-06-18 Sold (MLS) — MARIS as Distributed by MLS Grid
- 2021-05-28 Sold (Public Records) $159,500 Public Records
- 2021-04-20 Pending — MARIS as Distributed by MLS Grid
- 2021-04-16 Listed $160,000 MARIS as Distributed by MLS Grid
- 2021-04-14 Coming Soon $160,000 MARIS as Distributed by MLS Grid
- 1997-01-24 Sold (Public Records) — Public Records
Property tax history
+0.8%/yrLatest (2022): $2,034 · +1.7% YoY. Source: county tax records.
Cash-flow waterfall
monthlySold comps — $/sqft
last 12 mo · ≤1 miLoading sold comps…