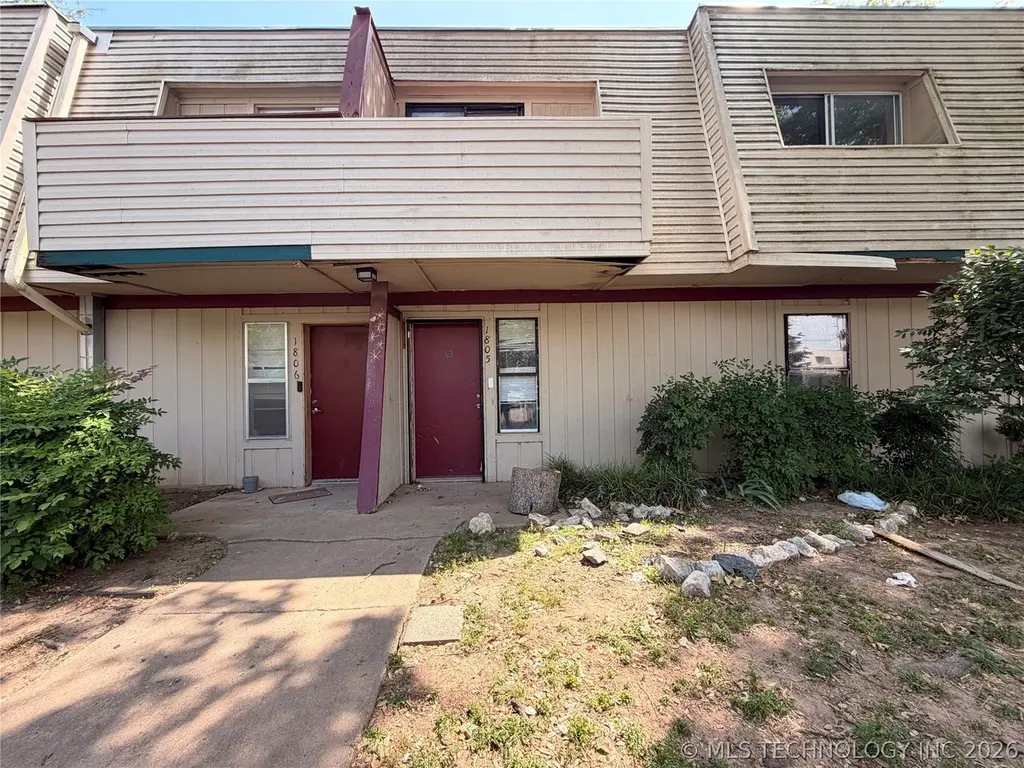
2216 E 66th Pl #1805 · Tulsa, OK
Flood risk 1/10 · Minimal
- FEMA flood zone
- X (unshaded)
- Chance of flooding over 30 yrs
- 0.0%
- Est. flood insurance / yr
- $473 – $860
Fire risk 1/10 · Minimal
- Est. fire insurance / yr
- $2,463 – $4,575
Heat risk 7/10 · Major
- Hot days now (above 110°F)
- 7 days/yr
- Hot days in 30 yrs
- 18 days/yr
Wind risk 2/10 · Minimal
- Chance of severe wind over 30 yrs
- 4.0%
Air-quality risk 3/10 · Minor
- Unhealthy air days now
- 2 days/yr
- Unhealthy air days in 30 yrs
- 3 days/yr
Risk factors via First Street. Map © Google.
Why this score? — see what drove the B- grade
The composite is a weighted blend of 9 inputs, each scored 0–100. Each bar is that input's sub-score; the figure is the points it added to the 100-point composite (weight × sub-score).
- Cash flow +30.0/30.0
- 1% rule +10.0/10.0
- DSCR +10.0/10.0
- ARV discount +7.5/15.0
- Livability +3.8/5.0
- Rent growth +2.7/5.0
- Condition / age +1.0/5.0
- Schools +0.8/10.0
- Appreciation +0.0/10.0
$42,900
🖨 Deal sheet (PDF) 📄 Offer letter ✓ Due diligence
Listing remarks
Investor opportunity in South Tulsa near Southern Hills Country Club. Condo ready for renovation and priced accordingly. The property needs flooring, paint, and window updates. Strong value-add potential for an investor or buyer willing to update. Sold as-is. Cash or conventional financing preferred. Convenient access to shopping, dining, River Parks, ORU, and Highway 75. Easy access for showings.
Key facts
- Value-add potential
- Highway 75
- River parks
Tags
Property features AI
Finance
- Financial info: Pets allowed
- HOA & community: Homeowners association with a monthly fee; HOA covers cable TV, structure maintenance, sewer, trash, and water; Community pool
Exterior
- Security: No safety shelter
- Utilities: Public water; Public sewer; Electricity available; Cable available
- Home design: 2-story building; Faces north; Slab foundation
- Construction: Built (year from public records); Vinyl and wood siding with wood frame construction
- Exterior features: Balcony; No other listed exterior features
Interior
- Kitchen: Dishwasher; Disposal; Electric oven / range / stove; Refrigerator
- Bedrooms: Two bedrooms (both on the second level) — one described as a master with a private bath
- Bathrooms: Two full bathrooms
- Heating & cooling: Central heating (electric); Central air conditioning
- Interior features: Aluminum frame windows; Cable TV available; Electric oven connection
- Laundry & utility: Washer and dryer included; Electric dryer hookup; Electric water heater
Neighborhood map
What this means for you Summary
Snapshot
- This is a 2-bed/2.0-bath condo listed at $43k. Condition is rated poor.
Deal economics
- At list price, monthly cash flow is $165 ($2k/yr) — positive.
- The deal already cash-flows at list — no discount required.
- Meets the 1% rule at list price ($1k rent vs $43k).
- Recommended offer: $42k (1.5% below list) — sets the bar for market timing.
- Cap rate 10.9% vs local median 3.8% in Tulsa — top-decile yield for the area; either an underpriced asset or a hidden risk that comps aren't pricing in. Stress-test before assuming the spread holds.
Location & tenants
- Location reads 75/100 on livability (#13 in OK, #4,058 nationally) — a middle-class / working-renter tenant base. Strengths: amenities A+, commute A+, cost of living A+; Watch: schools F, crime F, employment D-.
- Tulsa (urban): math 7% / reading 12% proficiency, ranked #250 of 270 in OK (top 93%) — low school quality limits family demand, transient renter base, plan for 1-2y turnover; 76% free/reduced lunch — lower-income household profile, screen leases tightly.
- Market conditions: Rents flat; 173 active listings in the ZIP; 29 comparable units currently listed for rent nearby; rentals leasing fast (median 5d on market — plan ~1-2 weeks tenant-placement turnaround); 2,818 units permitted in Tulsa County in 2024 (518 in 5+ unit buildings).
Forward outlook
- Local home prices are declining (-3.0%/yr); year-one equity from $297 of loan paydown is wiped out by about $1k of value loss. Plan a longer hold.
- Tulsa County population projected at +30% by 2050 — long-run rental-demand tailwind backs the buy-and-hold thesis.
Negotiation context
- It's been on market 30 days — a 2% lower offer ($42k) is reasonable based on typical stale-listing flexibility.
Risks & watch-outs
- Watch-outs: HOA is 35% of rent.
- Climate carrying-cost: extreme-heat days projected 7→18/yr by 2055 (HVAC capex compounding) — expect insurance premiums to compound above CPI over the hold.
Questions for the listing agent
- Have any recent inspections been done? Can we get a copy of the seller's disclosures and any deferred-maintenance estimates?
- Built in 1977 — when were the roof, HVAC, electrical panel, plumbing, and water heater last replaced?
- What does the HOA fee cover, when was the last increase, and are there any pending special assessments or reserve-fund shortfalls?
- Any open or pending special assessments — roof, HVAC, plumbing, elevator, façade? What's the per-unit balance and payoff schedule, and is the seller paying it off at close or rolling it to the buyer?
- Is there a deadline driving the sale (1031 exchange, divorce, estate, relocation)? That informs how much negotiation room exists.
- Schools are F-rated, which usually means shorter tenancies and higher turnover. Who's the typical renter profile here, and what's been the actual vacancy rate?
- Crime grade is F in this area — have there been break-ins, vandalism, or insurance claims at this property in the last 3 years? What carrier currently insures it and at what premium?
- What's the average days-on-market for RENTAL listings here right now (not sales)? A rising rental-DOM trend means longer vacancies and softer asking-rent achievability than the comps imply.
- What's the recent tenant-quality profile in this submarket — average credit score on applications, eviction rate, late-payment / NSF rate, and stable-employment percentage? A property-management company in the area should have these aggregated.
- How much new apartment / multifamily construction is in the pipeline within 1–3 miles? Heavy new supply (>2% of stock underway) typically softens rents 12–24 months out; light construction supports rent growth.
Investment metrics
- 1% rule
- 2.45% ✓
- Cap rate
- 10.92%
- Cash-on-cash
- 16.51%
- DSCR
- 1.73
- GRM
- 3.4
CMA / ARV
No comps found within radius.
Projected returns pro-forma
-3.0% appreciation · 0.74% rent growth · sell at horizon
- IRR
- 3.3%
- Equity multiple
- 1.12×
- Total profit
- $1,483
- Equity at exit
- $6,397
- IRR
- 8.8%
- Equity multiple
- 1.56×
- Total profit
- $6,678
- Equity at exit
- $3,709
Cash invested: $12,012 (down + closing). Projections, not guarantees.
Landlord ↔ Tenant lean methodology
- Overall (STATE)
- 83 Strongly Landlord-Friendly
- State Oklahoma
- 83 Strongly Landlord-Friendly · R+20
- County
- — inherits STATE
- City
- — inherits STATE
ZIP-level market 74136
- Home prices YoY
- -31.4%
- Rents YoY
- 0.7%
- Active inventory
- 173
- Price-to-rent
- 3.4×
Monthly cashflow live
- Estimated rent
- $1,049 high interval (Pro) →
- Mortgage (P&I)
- −$225
- Tax est. 1.5%
- −$54 /mo · $644/yr
- Insurance
- −$18
- HOA
- −$367
- Vacancy / Maint / Mgmt
- −$220
- Net cashflow
- $165
Break-even live
Sensitivity live
| Price | -10% $195 | -5% $180 | +0% $165 | +5% $150 | +10% $136 |
|---|---|---|---|---|---|
| Rent | -10% $82 | -5% $124 | +0% $165 | +5% $207 | +10% $248 |
| Rate | -1.0pp $187 | -0.5pp $176 | base $165 | +0.5pp $154 | +1.0pp $143 |
UW: 25.0% down · 7.5% · 30yr · 1.5% tax · 5.0% vac · 8.0% maint · 8.0% mgmt
Financing live
Cash to close
- Down payment
- $10,725
- Closing costs
- $1,287
- Reserves months
- —
- Total cash needed
- —
Loan-product check · same deal, 3 products live
Conventional
25% down · 7.5% · 30yr
- Down + closing
- —
- Monthly P&I
- —
- Monthly cashflow
- —
- DSCR
- —
- Eligible?
- —
Personal DTI + credit; lowest rate.
DSCR
20% down · 8.5% · 30yr
- Down + closing
- —
- Monthly P&I
- —
- Monthly cashflow
- —
- DSCR
- —
- Eligible?
- —
No personal income docs; deal must DSCR.
Hard money
10% down · 12.0% · 12mo
- Down + closing
- —
- Monthly P&I
- —
- Monthly cashflow
- —
- DSCR
- —
- Eligible?
- —
Short-term bridge; refi at stabilization.
Rent comps 29 comps
| Address | Beds | Baths | Sqft | Rent | $/sqft | DOM | Units | Dist |
|---|---|---|---|---|---|---|---|---|
| 6630 S Zunis Ave Tulsa, OK | 1.0–3.0 | 1.0–2.0 | 1000 | $1,044 | $1.04 | 3d | 12 | 0.09mi |
| 6732 S Lewis Ave #313 Tulsa, OK | 2.0 | 2.0 | 1350 | $1,400 | $1.04 | 4d | 1 | 0.18mi |
| 6805 S Lewis Ave Tulsa, OK | 2.0 | 1.5–2.0 | 1200 | $1,174 | $0.98 | 3d | 4 | 0.22mi |
| 1802 E 66th Pl Tulsa, OK | 1.0–2.0 | 1.0–2.0 | 695 | $1,100 | $1.58 | 22d | 3 | 0.23mi |
| 6639 S Victor Ave Unit G208 Tulsa, OK | 1.0 | 1.0 | 800 | $850 | $1.06 | 17d | 1 | 0.27mi |
| 6639 S Victor Ave Unit G203 Tulsa, OK | 1.0 | 1.0 | 800 | $850 | $1.06 | 25d | 1 | 0.28mi |
| 6760 S Trenton Pl Tulsa, OK | 1.0 | 1.0 | 700 | $745 | $1.06 | 25d | 1 | 0.58mi |
| 6760 S Trenton Pl Tulsa, OK | 2.0 | 2.0 | 900 | $900 | $1.00 | 11d | 1 | 0.58mi |
| 1818 E 71st St Tulsa, OK | 2.0 | 1.0–2.0 | 700 | $1,062 | $1.52 | 3d | 37 | 0.59mi |
| 6135 S Troost Ave Unit 6135 Tulsa, OK | 2.0 | 2.0 | 1150 | $1,125 | $0.98 | 25d | 1 | 0.62mi |
| 6105 S Troost Ave Tulsa, OK | 2.0 | 2.0 | 1124 | $1,300 | $1.16 | 25d | 1 | 0.68mi |
| 2218 E 59th St Tulsa, OK | 1.0–2.0 | 1.0 | 787 | $1,199 | $1.52 | 4d | 4 | 0.74mi |
| 1514 E 73rd Pl Tulsa, OK | 3.0 | 2.0 | 1461 | $1,450 | $0.99 | 11d | 1 | 0.86mi |
| 6642 S Peoria Ave Tulsa, OK | 1.0–2.0 | 1.0 | 712 | $1,100 | $1.54 | 12d | 2 | 0.91mi |
| 6732 S Peoria Ave Tulsa, OK | 1.0–2.0 | 1.0–2.0 | 810 | $926 | $1.14 | 3d | 4 | 0.97mi |
| 1337 E 61st St Tulsa, OK | 1.0–2.0 | 1.0 | 700 | $1,051 | $1.50 | 4d | 14 | 1.02mi |
| 7901 Riverside Pkwy Tulsa, OK | 2.0 | 2.0 | 950 | $884 | $0.93 | 4d | 16 | 1.05mi |
| 6345 S Madison Pl Unit 1 Tulsa, OK | 3.0 | 2.0 | 1080 | $1,100 | $1.02 | 4d | 1 | 1.12mi |
| 1320 E 58th St Tulsa, OK | 1.0 | 1.0 | 980 | $1,200 | $1.22 | 22d | 1 | 1.15mi |
| 1110 E 60th St Tulsa, OK | 1.0–2.0 | 1.0–2.0 | 794 | $1,069 | $1.35 | 4d | 4 | 1.15mi |
| 7803 S Wheeling Ave Tulsa, OK | 1.0–2.0 | 1.0–2.0 | 800 | $849 | $1.06 | 25d | 10 | 1.19mi |
| 6119 S Madison Pl Tulsa, OK | 3.0 | 2.0 | 1214 | $1,550 | $1.28 | 11d | 1 | 1.20mi |
| 5628 S Peoria Ave Unit 5628A-P Tulsa, OK | 2.0 | 2.0 | 950 | $1,100 | $1.16 | 4d | 1 | 1.25mi |
| 5624 S Peoria Ave Unit 5624C-P Tulsa, OK | 2.0 | 1.0 | 850 | $1,000 | $1.18 | 4d | 1 | 1.26mi |
| 910 E 61st St Tulsa, OK | 1.0 | 1.0 | 700 | $926 | $1.32 | 4d | 1 | 1.26mi |
| 5607 S Quaker Ave Unit 5607D-Q Tulsa, OK | 2.0 | 2.0 | 950 | $1,100 | $1.16 | 4d | 1 | 1.28mi |
| 1037 E 57th Pl #5 Tulsa, OK | 1.0 | 1.5 | 1088 | $1,100 | $1.01 | 25d | 1 | 1.36mi |
| 5270 S Lewis Ave Tulsa, OK | 2.0 | 2.0 | 1050 | $950 | $0.90 | 25d | 8 | 1.42mi |
| 5151 S Utica Ave Tulsa, OK | 1.0–2.0 | 1.0 | 799 | $838 | $1.05 | 3d | 1 | 1.50mi |
HOA detail condo
- Monthly dues
- $367 · $4,404/yr
- Assessments
- None detected in remarks — confirm with the listing agent.
Listing history 15 events
-
2026-06-18days on market $42,900 Active 30 DOM
-
2026-06-17days on market $42,900 Active 29 DOM
-
2026-06-16pricedays on market $42,900 Active 28 DOM
-
2026-06-15days on market $44,900 Active 27 DOM
-
2026-06-13days on market $44,900 Active 25 DOM
-
2026-06-10days on market $44,900 Active 22 DOM
-
2026-06-09days on market $44,900 Active 21 DOM
-
2026-06-08days on market $44,900 Active 20 DOM
-
2026-06-07days on market $44,900 Active 19 DOM
-
2026-06-05days on market $44,900 Active 16 DOM
-
2026-06-03days on market $44,900 Active 15 DOM
-
2026-06-02days on market $44,900 Active 14 DOM
-
2026-06-01days on market $44,900 Active 13 DOM
-
2026-05-31days on market $44,900 Active 12 DOM
-
2026-05-19$44,900 Active
ⓘ Source: listings_history table (triggers on properties + properties_extension) + one-shot
backfill from property_details.listing_events for pre-trigger history.
Climate risk First Street
- Flood 1/10 Low FEMA zone X (unshaded) · 0% chance over 30 yrs
- Wildfire 1/10 Low
- Heat 7/10 Severe 7 d/yr ≥110°F today · 18 d/yr by 30 yrs out
- Wind 2/10 Low 4% chance of damaging wind over 30 yrs
- Air quality 3/10 Moderate 2 unhealthy d/yr today · 3 by 30 yrs out
Nearby sold comps map
Loading sold comps map…
Walkable amenities ~0.75 mi
Loading nearby amenities…
Taxation est. · year 1
- Rental income
- $12,589
- − Mortgage interest
- −$2,403
- − Property taxes
- −$644
- − Insurance
- −$214
- − Repairs & maintenance
- −$1,007
- − Management
- −$1,007
- − HOA
- −$4,404
- − Depreciation
- −$1,248
- Taxable income
- $1,661
- Est. tax owed @ 24.0%
- −$399
- After-tax cash flow
- $1,585/yr
For passive investors: Depreciation is non-cash, so a rental often shows a tax loss while cash-flowing — sheltering income. Rental losses are passive: they offset passive income freely, and up to $25,000/yr can offset ordinary (W-2) income if you actively participate and your MAGI is under $100k (phasing out to $0 by $150k); unused losses carry forward. On sale, claimed depreciation is recaptured at up to 25%, and gains may owe capital-gains tax (a 1031 exchange can defer both). Figures are a year-1 estimate at your 24.0% rate — not tax advice; consult a CPA.
Condition & rehab AI · 19 photos
This property requires extensive repairs and updates to bring it up to a livable condition. Significant work is needed on the exterior, interior walls, flooring, and kitchens and bathrooms. Curb appeal and living space value can be significantly increased with these updates.
Repairs flagged
- Major exterior siding — Severe weathering and damage
- Major interior walls — Peeling paint and exposed drywall
- Major flooring — Exposed subflooring and debris
- Major kitchen flooring — Exposed subflooring and debris
- Major bathroom flooring — Exposed subflooring and debris
- Major exterior landscaping — Overgrown vegetation and debris
Value-add opportunities
- Both exterior siding repair and repainting — Enhances curb appeal and value
- Both interior wall repair and painting — Improves living space and value
- Both flooring replacement — Enhances living space and value
- Both kitchen and bathroom updates — Enhances living space and value
Renovation cost estimate screening
| Repair item | Severity | Est. cost |
|---|---|---|
| exterior siding · Severe weathering and damage | Major | $15,000–50,000 |
| interior walls · Peeling paint and exposed drywall | Major | $15,000–50,000 |
| flooring · Exposed subflooring and debris | Major | $15,000–50,000 |
| kitchen flooring · Exposed subflooring and debris | Major | $15,000–50,000 |
| bathroom flooring · Exposed subflooring and debris | Major | $15,000–50,000 |
| exterior landscaping · Overgrown vegetation and debris | Major | $15,000–50,000 |
| Total estimated repair cost · 6 items | $90,000–300,000 |
Value-add ROI direction
- Both exterior siding repair and repainting — Enhances curb appeal and value ↑
- Both interior wall repair and painting — Improves living space and value ↑
- Both flooring replacement — Enhances living space and value ↑
- Both kitchen and bathroom updates — Enhances living space and value ↑
ⓘ Cost ranges are severity-bucket heuristics (US national rule-of-thumb). Get contractor quotes + a written scope before underwriting a rehab budget.
Schools (NCES district)
- District
- Tulsa
- NCES district ID
- 4030240
- Math proficiency
- 7% ▼ -9.00%
- Reading proficiency
- 12% ▼ -7.00%
- Median HH income
- $37,895
- Composite
- 8.04/100
- National rank
- #9919
- State rank
- #250 of 270 in OK
Livability — Tulsa
- Score
- 75/100
- State rank
- #13
- US rank
- #4058
Category grades
Schools grade is shown separately in the Schools card above.
Census & demographics
- Census place
- Tulsa, OK
- County
- Tulsa County · 640,811 people
- City population
- 389,418
- Metro
- Tulsa, OK
- Population (ZIP)
- 31,416
- Household income
- $51,820
- Rent vs Own
- Severe rent burden
- 2579.0
Population outlook (Tulsa County) Hauer SSP2
- Today (2025)
- 723,846 people
- By 2030
- 766,033 · +5.8%
- By 2040
- 851,386 · +17.6%
- By 2050
- 938,389 · +29.6%
- By 2075
- 1,166,011 · +61.1%
- By 2100
- 1,350,277 · +86.5%
Race, ethnicity, and origin ACS 2023
- Neighborhood character
- Diverse neighborhood (Simpson 0.66)
- Race & ethnicity
- White 55% Black 16% Two or more races 13% Hispanic / Latino 10% Asian 7% Native American 2%
- Hispanic origin (detail)
- Mexican 6%
- Common ancestry
- Slovak 2% Lithuanian 2% Italian 1%
- Foreign-born
- 14% · Canada, Philippines
- Languages at home
- 83% English-only · Spanish 8% Other Asian/Pacific 5% Other Indo-European 1%
Political lean MEDSL · Tulsa
- 2024 margin
- R (+15.2) · D 41.3% · R 56.5% · Other 2.2%
- 2008→2024 swing
- +9.2pp toward D · 2008: -24.5pp · 2024: -15.2pp
- All cycles
- 2024: R+15.2 2020: R+15.6 2016: R+22.9 2012: R+27.4 2008: R+24.5
Not yet ingested
- Civics
- —
Market trends
- HPI YoY
- ▼ -98.51%
- Current HPI
- 215.3642
- Rent YoY
- ▲ 0.74%
- Metro
- Tulsa, OK
- State GDP YoY
- ▲ 1.55%
- F500 in state
- 6
Industry mix (Fortune 500 HQ in OK)
| Industry | F500 HQs | Revenue |
|---|---|---|
| Energy | 3 | $48B |
|
||
Price history
1 event — show timeline
- 2026-05-19 Listed $44,900 MLS Technology, Inc.
Cash-flow waterfall
monthlySold comps — $/sqft
last 12 mo · ≤1 miLoading sold comps…