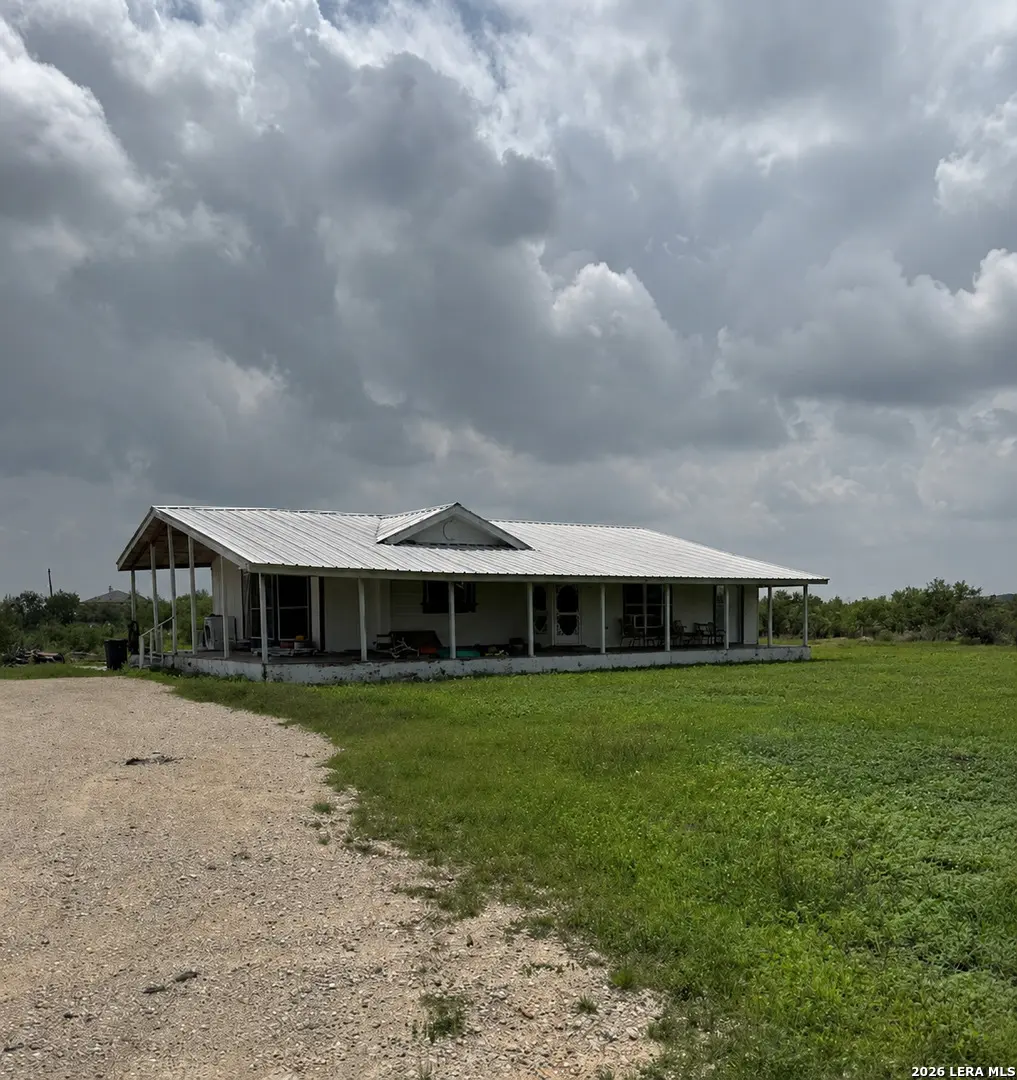
3030 County Road 4516 · Castroville, TX
Flood risk 1/10 · Minimal
- FEMA flood zone
- X (unshaded)
- Chance of flooding over 30 yrs
- 0.0%
- Est. flood insurance / yr
- $507 – $1,088
Fire risk 5/10 · Moderate
- Est. fire insurance / yr
- $1,222 – $2,270
Heat risk 8/10 · Major
- Hot days now (above 107°F)
- 7 days/yr
- Hot days in 30 yrs
- 21 days/yr
Wind risk 8/10 · Major
- Chance of severe wind over 30 yrs
- 80.0%
Air-quality risk 1/10 · Minimal
- Unhealthy air days now
- 0 days/yr
- Unhealthy air days in 30 yrs
- 0 days/yr
Risk factors via First Street. Map © Google.
Why this score? — see what drove the B grade
The composite is a weighted blend of 9 inputs, each scored 0–100. Each bar is that input's sub-score; the figure is the points it added to the 100-point composite (weight × sub-score).
- Cash flow +30.0/30.0
- 1% rule +10.0/10.0
- DSCR +10.0/10.0
- ARV discount +7.5/15.0
- Schools +4.4/10.0
- Livability +3.7/5.0
- Rent growth +2.5/5.0
- Condition / age +2.5/5.0
- Appreciation +0.0/10.0
$169,900
🖨 Deal sheet (PDF) 📄 Offer letter ✓ Due diligence
Listing remarks
Prime restricted 5 acre opportunity located in the highly desirable Medina Valley Independent School District area. This property offers excellent potential for investors, homesteaders, business owners, or buyers looking for land and utilities already in place. The 4 bedroom, 2 bathroom doublewide home is not move-in ready and will require repairs and updates, making this an ideal fixer-upper or redevelopment opportunity. Property features include two electric meters, one water meter, septic system, fenced boundaries, gravel driveway with circle drive, shed with awning, and approximately 600 feet of road frontage along CR 4516. The setup allows flexibility for residential, business, storage
Key facts
- 5 acre lot
- Built 1995
- Listed 26 days
Property features AI
Finance
- HOA & community: Subdivision: Castroville West / Castroville West Subd.
Exterior
- Utilities: Electric service by Medina; Water service by East Medina; Septic system
- Home design: Pre-owned home; Approximate age 31 years
- Construction: Composition roof; Other foundation (see remarks)
- Exterior features: Vinyl exterior; County view; Mature trees; Level lot; 2–5 acre parcel
Interior
- Kitchen: Island kitchen; Kitchen dimensions 10 x 10
- Bedrooms: Master bedroom (lower level) — 12 x 13; Bedroom 2 — 10 x 10; Bedroom 3 — 10 x 10; Bedroom 4 — 10 x 10
- Flooring: Vinyl flooring
- Bathrooms: 2 full bathrooms; Master bathroom with tub/shower combination — 10 x 10
- Heating & cooling: Central heating (electric); Central air conditioning
- Interior features: Two living areas; Separate dining room; Kitchen island; Utility room inside; Laundry room; All window coverings remain
- Laundry & utility: Washer and dryer connections; Utility room 5 x 10; Laundry room inside
Neighborhood map
What this means for you Summary
Snapshot
- This is a 4-bed/2.0-bath manufactured listed at $170k.
Deal economics
- At list price, monthly cash flow is $1k ($13k/yr) — positive.
- The deal already cash-flows at list — no discount required.
- Meets the 1% rule at list price ($3k rent vs $170k).
- Recommended offer: $167k (1.5% below list) — sets the bar for market timing.
- Cap rate 14.0% vs local median 2.9% in Castroville — top-decile yield for the area; either an underpriced asset or a hidden risk that comps aren't pricing in. Stress-test before assuming the spread holds.
Location & tenants
- Location reads 73/100 on livability (#212 in TX) — a middle-class / working-renter tenant base. Strengths: cost of living A+, housing A+, crime B; Watch: health & safety D+, amenities F, commute F.
- Medina Valley ISD (rural): math 48% / reading 53% proficiency, ranked #148 of 826 in TX (top 18%) — acceptable for families but not a draw, mixed tenant base, ~2y average lease.
- Zoned schools: Castroville El (math 59% / reading 62%, grade B-, #385 of 4,322 statewide, top 9%, 644 students, 55% FRL); Medina Valley Middle (math 47% / reading 49%, grade C-, #400 of 1,662 statewide, top 24%, 1,029 students, 62% FRL); Medina Valley H S (math 34% / reading 55%, grade F, #652 of 1,632 statewide, top 43%, 2,147 students, 51% FRL).
- Market conditions: 114 active listings in the ZIP; 1 comparable units currently listed for rent nearby; 102 units permitted in Medina County in 2024 (0 in 5+ unit buildings).
Forward outlook
- Local home prices are declining (-3.0%/yr); year-one equity from $1k of loan paydown is wiped out by about $5k of value loss. Plan a longer hold.
- Medina County population projected at +24% by 2050 — long-run rental-demand tailwind backs the buy-and-hold thesis.
- At projected returns (-3.0% appreciation + 3.0% rent growth), your $48k cash investment doubles in ~5 years — after that, you're playing with house money.
Negotiation context
- It's been on market 26 days — a 2% lower offer ($167k) is reasonable based on typical stale-listing flexibility.
- 2 sale attempts with the ask held roughly flat each time — persistent listings suggest the price (not the market) is what's stuck; bring a comps-based counter.
Risks & watch-outs
- Climate carrying-cost: severe wind risk, 80% chance of damaging wind over 30y; moderate wildfire risk; extreme-heat days projected 7→21/yr by 2055 (HVAC capex compounding) — expect insurance premiums to compound above CPI over the hold.
Questions for the listing agent
- Is there a deadline driving the sale (1031 exchange, divorce, estate, relocation)? That informs how much negotiation room exists.
- What's the average days-on-market for RENTAL listings here right now (not sales)? A rising rental-DOM trend means longer vacancies and softer asking-rent achievability than the comps imply.
- What's the recent tenant-quality profile in this submarket — average credit score on applications, eviction rate, late-payment / NSF rate, and stable-employment percentage? A property-management company in the area should have these aggregated.
- How much new for-sale + rental construction is in the pipeline within 1–3 miles? Heavy new supply typically softens prices + rents 12–24 months out; constrained supply supports both.
Investment metrics
- 1% rule
- 1.68% ✓
- Cap rate
- 13.97%
- Cash-on-cash
- 27.41%
- DSCR
- 2.22
- GRM
- 5.0
CMA / ARV
- ARV (median comp)
- $373,205
- List price
- $169,900
- Delta
- -54.48%
- Verdict
- UNDERPRICED
- Comps
- 8 within 2.0 mi
Projected returns pro-forma
-3.0% appreciation · 3.0% rent growth · sell at horizon
- IRR
- 21.4%
- Equity multiple
- 1.88×
- Total profit
- $41,712
- Equity at exit
- $25,333
- IRR
- 29.6%
- Equity multiple
- 3.64×
- Total profit
- $125,588
- Equity at exit
- $14,690
Cash invested: $47,572 (down + closing). Projections, not guarantees.
Landlord ↔ Tenant lean methodology
- Overall (STATE)
- 87 Strongly Landlord-Friendly
- State Texas
- 87 Strongly Landlord-Friendly · R+5
- County
- — inherits STATE
- City
- — inherits STATE
ZIP-level market 78861
- Home prices YoY
- -22.7%
- Active inventory
- 114
- Price-to-rent
- 5.0×
Monthly cashflow live
- Estimated rent
- $2,850 medium interval (Pro) →
- Mortgage (P&I)
- −$891
- Tax from tax record
- −$203 /mo · $2,438/yr
- Insurance
- −$71
- HOA
- −$0
- Vacancy / Maint / Mgmt
- −$598
- Net cashflow
- $1,087
Break-even live
Sensitivity live
| Price | -10% $1,183 | -5% $1,135 | +0% $1,087 | +5% $1,039 | +10% $990 |
|---|---|---|---|---|---|
| Rent | -10% $861 | -5% $974 | +0% $1,087 | +5% $1,199 | +10% $1,312 |
| Rate | -1.0pp $1,172 | -0.5pp $1,130 | base $1,087 | +0.5pp $1,043 | +1.0pp $998 |
UW: 25.0% down · 7.5% · 30yr · 1.5% tax · 5.0% vac · 8.0% maint · 8.0% mgmt
Financing live
Cash to close
- Down payment
- $42,475
- Closing costs
- $5,097
- Reserves months
- —
- Total cash needed
- —
Loan-product check · same deal, 3 products live
Conventional
25% down · 7.5% · 30yr
- Down + closing
- —
- Monthly P&I
- —
- Monthly cashflow
- —
- DSCR
- —
- Eligible?
- —
Personal DTI + credit; lowest rate.
DSCR
20% down · 8.5% · 30yr
- Down + closing
- —
- Monthly P&I
- —
- Monthly cashflow
- —
- DSCR
- —
- Eligible?
- —
No personal income docs; deal must DSCR.
Hard money
10% down · 12.0% · 12mo
- Down + closing
- —
- Monthly P&I
- —
- Monthly cashflow
- —
- DSCR
- —
- Eligible?
- —
Short-term bridge; refi at stabilization.
Rent comps 1 comps
| Address | Beds | Baths | Sqft | Rent | $/sqft | DOM | Units | Dist |
|---|---|---|---|---|---|---|---|---|
| 210 County Road 4643 Hondo, TX | 4.0 | 3.0 | 3000 | $2,850 | $0.95 | 45d | 1 | 1.43mi |
Listing history 9 events
-
2026-06-04status $169,900 Pending 26 DOM
-
2026-06-03days on market $169,900 Active 26 DOM
-
2026-06-02days on market $169,900 Active 25 DOM
-
2026-06-01days on market $169,900 Active 24 DOM
-
2026-05-31days on market $169,900 Active 23 DOM
-
2026-05-08status Back on Market 932-char remark
-
2026-05-08historical 932-char remark
-
2026-05-08$169,900 New 932-char remark
-
2019-03-19soldstatus
ⓘ Source: listings_history table (triggers on properties + properties_extension) + one-shot
backfill from property_details.listing_events for pre-trigger history.
Tax reassessment forecast TX · Resets to sale price
- Current annual tax
- $2,438 · $203/mo
- Projected year-2 tax
- $3,109 · $259/mo
- Expected delta
- +$672/yr (+$56/mo · 27.5%)
ⓘ Screening estimate from a state-policy table — verify with the county assessor before closing.
Climate risk First Street
- Flood 1/10 Low FEMA zone X (unshaded) · 0% chance over 30 yrs
- Wildfire 5/10 Major
- Heat 8/10 Severe 7 d/yr ≥107°F today · 21 d/yr by 30 yrs out
- Wind 8/10 Severe 80% chance of damaging wind over 30 yrs
- Air quality 1/10 Low 0 unhealthy d/yr today · 0 by 30 yrs out
Nearby sold comps map
Loading sold comps map…
Walkable amenities ~0.75 mi
Loading nearby amenities…
Taxation est. · year 1
- Rental income
- $34,200
- − Mortgage interest
- −$9,517
- − Property taxes
- −$2,438
- − Insurance
- −$850
- − Repairs & maintenance
- −$2,736
- − Management
- −$2,736
- − Depreciation
- −$4,943
- Taxable income
- $10,981
- Est. tax owed @ 24.0%
- −$2,636
- After-tax cash flow
- $10,404/yr
For passive investors: Depreciation is non-cash, so a rental often shows a tax loss while cash-flowing — sheltering income. Rental losses are passive: they offset passive income freely, and up to $25,000/yr can offset ordinary (W-2) income if you actively participate and your MAGI is under $100k (phasing out to $0 by $150k); unused losses carry forward. On sale, claimed depreciation is recaptured at up to 25%, and gains may owe capital-gains tax (a 1031 exchange can defer both). Figures are a year-1 estimate at your 24.0% rate — not tax advice; consult a CPA.
Schools (NCES district)
- District
- Medina Valley ISD
- NCES district ID
- 4830060
- Math proficiency
- 48% ▼ -9.00%
- Reading proficiency
- 53% ▼ -2.00%
- Median HH income
- $60,596
- Composite
- 44.2/100
- National rank
- #2851
- State rank
- #148 of 826 in TX
Livability — Castroville
- Score
- 73/100
- State rank
- #212
- US rank
- #5267
Category grades
Schools grade is shown separately in the Schools card above.
Census & demographics
- Population (ZIP)
- 13,715
Population outlook (Medina County) Hauer SSP2
- Today (2025)
- 54,332 people
- By 2030
- 57,250 · +5.4%
- By 2040
- 62,563 · +15.1%
- By 2050
- 67,386 · +24.0%
- By 2075
- 79,538 · +46.4%
- By 2100
- 84,624 · +55.8%
Race, ethnicity, and origin ACS 2023
- Neighborhood character
- Diverse neighborhood (Simpson 0.59)
- Race & ethnicity
- Hispanic / Latino 49% White 41% Two or more races 19% Black 4%
- Hispanic origin (detail)
- Mexican 38%
- Common ancestry
- Lithuanian 3% Slovak 1% Italian 1%
- Foreign-born
- 4% · Canada
- Languages at home
- 76% English-only · Spanish 23%
Political lean MEDSL · Medina
- 2024 margin
- Solid R (+42.8) · D 28.2% · R 71.0%
- 2008→2024 swing
- -8.9pp toward R · 2008: -33.9pp · 2024: -42.8pp
- All cycles
- 2024: R+42.8 2020: R+39.2 2016: R+43.2 2012: R+39.2 2008: R+33.9
Not yet ingested
- Civics
- —
Market trends
- HPI YoY
- ▼ -61.41%
- Current HPI
- 209.0645
- Rent YoY
- —
- Metro
- —
- State GDP YoY
- ▲ 3.95%
- F500 in state
- 110
Industry mix (Fortune 500 HQ in TX)
| Industry | F500 HQs | Revenue |
|---|---|---|
| Energy | 16 | $1,198B |
|
||
| Technology | 5 | $198B |
|
||
| Engineering / Construction | 4 | $72B |
|
||
| Energy Services | 3 | $60B |
|
||
| Utilities | 3 | $41B |
|
||
| Healthcare | 2 | $330B |
|
||
Price history
5 events — show timeline
- 2026-06-04 Pending — LERA
- 2026-05-08 Relisted — LERA
- 2026-05-08 Listed $169,900 LERA
- 2026-05-08 Listing Removed — LERA
- 2019-03-19 Sold (Public Records) — Public Records
Property tax history
+1.5%/yrLatest (2025): $2,438 · +8.4% YoY. Source: county tax records.
Cash-flow waterfall
monthlySold comps — $/sqft
last 12 mo · ≤1 miLoading sold comps…