3013 Titleist Dr · Spring, TX
Flood risk 1/10 · Minimal
- FEMA flood zone
- X (unshaded)
- Chance of flooding over 30 yrs
- 0.0%
- Est. flood insurance / yr
- $507 – $1,088
Fire risk 3/10 · Minor
- Est. fire insurance / yr
- $1,222 – $2,270
Heat risk 9/10 · Severe
- Hot days now (above 110°F)
- 7 days/yr
- Hot days in 30 yrs
- 25 days/yr
Wind risk 8/10 · Major
- Chance of severe wind over 30 yrs
- 99.0%
Air-quality risk 3/10 · Minor
- Unhealthy air days now
- 3 days/yr
- Unhealthy air days in 30 yrs
- 3 days/yr
Risk factors via First Street. Map © Google.
Why this score? — see what drove the D+ grade
The composite is a weighted blend of 9 inputs, each scored 0–100. Each bar is that input's sub-score; the figure is the points it added to the 100-point composite (weight × sub-score).
- ARV discount +15.0/15.0
- Cash flow +12.9/30.0
- 1% rule +5.8/10.0
- DSCR +3.9/10.0
- Livability +3.3/5.0
- Condition / age +2.5/5.0
- Rent growth +2.4/5.0
- Schools +2.0/10.0
- Appreciation +0.0/10.0
$140,000
🖨 Deal sheet 📄 Offer letter ✓ Due diligence
Listing remarks MLS
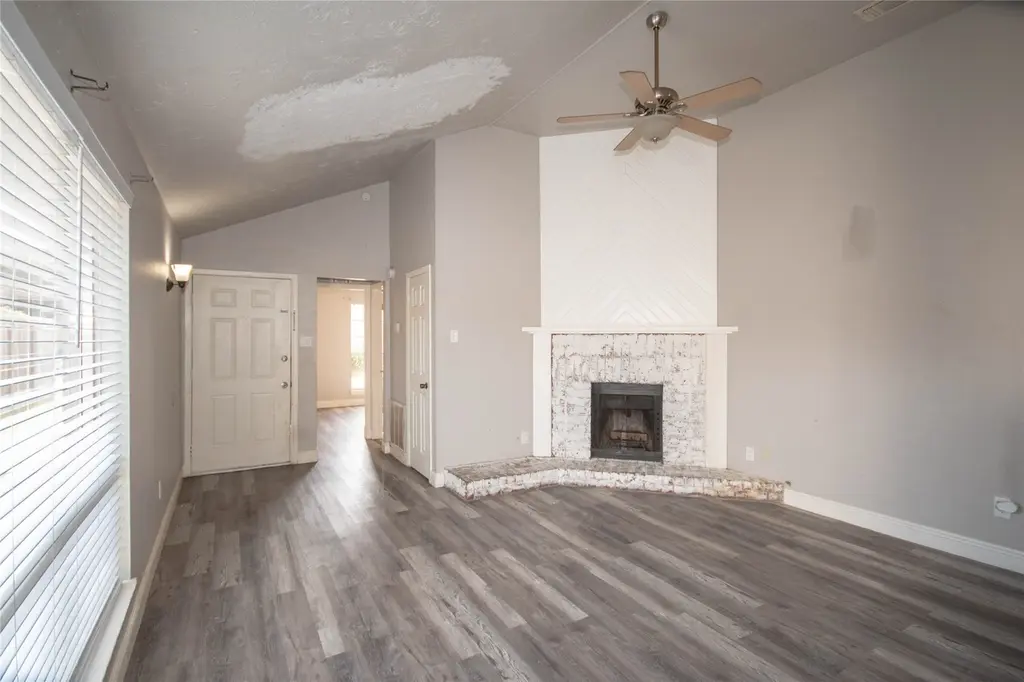
This property is a fantastic opportunity, perfect for both investors and those looking to find their first home in spring! The charming duplex boasts three cozy bedrooms and two bathrooms, along with a beautifully updated galley kitchen. You’ll love the inviting living room featuring a fireplace and the thoughtful split floor plan that offers extra privacy. Plus, with a convenient carport and a peaceful location at the end of the street, you're just moments away from Mercer Botanical Gardens and the library!
Key facts
- Peaceful location
- Split floor plan
- Inviting living room
Tags
Neighborhood map
What this means for you Summary
Snapshot
- This is a 2-bed/2.0-bath townhouse listed at $140k.
Deal economics
- At list price, monthly cash flow is $-10 ($-117/yr) — negative.
- To cash-flow at today's rent, offer at most $138k (1.2% below list).
- Meets the 1% rule at list price ($2k rent vs $140k).
- Recommended offer: $123k (12.0% below list) — sets the bar for market timing.
- Cap rate 6.2% vs local median 4.5% in Spring — top-decile yield for the area; either an underpriced asset or a hidden risk that comps aren't pricing in. Stress-test before assuming the spread holds.
Location & tenants
- Location reads 66/100 on livability (#635 in TX) — a middle-class / working-renter tenant base. Strengths: cost of living A+, housing A+, employment B; Watch: schools C-, crime D, amenities F.
- Spring ISD (suburban): math 19% / reading 26% proficiency, ranked #730 of 826 in TX (top 88%) — low school quality limits family demand, transient renter base, plan for 1-2y turnover; 66% free/reduced lunch — lower-income household profile, screen leases tightly.
- Market conditions: Rents soft (-0.3%/yr); 595 active listings in the ZIP; 2 comparable units currently listed for rent nearby; solid renter incomes; 29,883 units permitted in Harris County in 2024 (8,621 in 5+ unit buildings).
Forward outlook
- Local home prices are declining (-3.0%/yr); year-one equity from $968 of loan paydown is wiped out by about $4k of value loss. Plan a longer hold.
- Harris County population projected at +47% by 2050 — long-run rental-demand tailwind backs the buy-and-hold thesis.
Negotiation context
- It's been on market 141 days — a 12% lower offer ($123k) is reasonable based on typical stale-listing flexibility.
- 2 sale attempts since 5y ago; this cycle's ask has dropped $30k (18%) from the opening price — seller is motivated, your offer sets the floor, not the list.
Risks & watch-outs
- Watch-outs: property tax is 3.5% of price.
- Climate carrying-cost: severe wind risk, 99% chance of damaging wind over 30y; extreme-heat days projected 7→25/yr by 2055 (HVAC capex compounding) — expect insurance premiums to compound above CPI over the hold.
Questions for the listing agent
- What do current leases actually rent for vs. the listed asking? Can we see a recent rent roll and the last 12 months of T-12 income?
- It's been on market 141 days. Have you received any prior offers? Is the seller open to a 12% concession, seller financing, or rate buy-down credit?
- Built in 1978 — when were the roof, HVAC, electrical panel, plumbing, and water heater last replaced?
- Property tax is high relative to price — has the assessment been appealed recently, and will the sale trigger a re-assessment?
- Why hasn't it sold? Are there any deal-killer items the seller is aware of (foundation, flood, title, zoning, code violations)?
- Is there a deadline driving the sale (1031 exchange, divorce, estate, relocation)? That informs how much negotiation room exists.
- Crime grade is D in this area — have there been break-ins, vandalism, or insurance claims at this property in the last 3 years? What carrier currently insures it and at what premium?
- The area grade is low — what's the realistic commute time and amenity access for the typical tenant pool here? Any planned neighborhood developments (good or bad) we should know about?
- What's the average days-on-market for RENTAL listings here right now (not sales)? A rising rental-DOM trend means longer vacancies and softer asking-rent achievability than the comps imply.
- What's the recent tenant-quality profile in this submarket — average credit score on applications, eviction rate, late-payment / NSF rate, and stable-employment percentage? A property-management company in the area should have these aggregated.
- How much new for-sale + rental construction is in the pipeline within 1–3 miles? Heavy new supply typically softens prices + rents 12–24 months out; constrained supply supports both.
Investment metrics
- 1% rule
- 1.08% ✓
- Cap rate
- 6.21%
- Cash-on-cash
- -0.30%
- DSCR
- 0.99
- GRM
- 7.7
CMA / ARV
- ARV (median comp)
- $178,858
- List price
- $140,000
- Delta
- -21.73%
- Verdict
- UNDERPRICED
- Comps
- 3 within 1.0 mi
Projected returns pro-forma
-3.0% appreciation · 0.0% rent growth · sell at horizon
- IRR
- -20.9%
- Equity multiple
- 0.30×
- Total profit
- $-27,566
- Equity at exit
- $20,874
- IRR
- -26.5%
- Equity multiple
- -0.05×
- Total profit
- $-41,228
- Equity at exit
- $12,105
Cash invested: $39,200 (down + closing). Projections, not guarantees.
Landlord ↔ Tenant lean methodology
- Overall (STATE)
- 87 Strongly Landlord-Friendly
- State Texas
- 87 Strongly Landlord-Friendly · R+5
- County
- — inherits STATE
- City
- — inherits STATE
ZIP-level market 77373
- Rents YoY
- -0.3%
- Active inventory
- 595
- Price-to-rent
- 7.7×
Monthly cashflow live
- Estimated rent
- $1,510 medium interval (Pro) →
- Mortgage (P&I)
- −$734
- Tax from tax record
- −$410 /mo · $4,923/yr
- Insurance
- −$58
- HOA
- −$0
- Vacancy / Maint / Mgmt
- −$317
- Net cashflow
- $-10
Break-even live
UW: 25.0% down · 7.5% · 30yr · 1.5% tax · 5.0% vac · 8.0% maint · 8.0% mgmt
Financing live
Cash to close
- Down payment
- $35,000
- Closing costs
- $4,200
- Reserves months
- —
- Total cash needed
- —
Loan-product check · same deal, 3 products live
Conventional
25% down · 7.5% · 30yr
- Down + closing
- —
- Monthly P&I
- —
- Monthly cashflow
- —
- DSCR
- —
- Eligible?
- —
Personal DTI + credit; lowest rate.
DSCR
20% down · 8.5% · 30yr
- Down + closing
- —
- Monthly P&I
- —
- Monthly cashflow
- —
- DSCR
- —
- Eligible?
- —
No personal income docs; deal must DSCR.
Hard money
10% down · 12.0% · 12mo
- Down + closing
- —
- Monthly P&I
- —
- Monthly cashflow
- —
- DSCR
- —
- Eligible?
- —
Short-term bridge; refi at stabilization.
Rent comps 2 comps
| Address | Beds | Baths | Sqft | Rent | $/sqft | DOM | Units | Dist |
|---|---|---|---|---|---|---|---|---|
| 21407 Palma Grove Way Houston, TX | 3.0 | 2.0 | 1407 | $1,000 | $0.71 | 12d | 1 | 1.35mi |
| 21027 Aldine Westfield Rd Humble, TX | 2.0 | 2.0 | 1034 | $1,449 | $1.40 | 43d | 1 | 1.43mi |
Listing history 23 events
-
2026-06-18days on market $140,000 Active 141 DOM
-
2026-06-17days on market $140,000 Active 140 DOM
-
2026-06-16days on market $140,000 Active 139 DOM
-
2026-06-15days on market $140,000 Active 138 DOM
-
2026-06-13days on market $140,000 Active 136 DOM
-
2026-06-13days on market $140,000 Active 135 DOM
-
2026-06-09days on market $140,000 Active 132 DOM
-
2026-06-08days on market $140,000 Active 131 DOM
-
2026-06-07days on market $140,000 Active 130 DOM
-
2026-06-04days on market $140,000 Active 127 DOM
-
2026-06-03days on market $140,000 Active 126 DOM
-
2026-06-02days on market $140,000 Active 125 DOM
-
2026-06-01days on market $140,000 Active 124 DOM
-
2026-05-31days on market $140,000 Active 123 DOM
-
2026-02-20price $140,000 519-char remark
Show marketing remark (519 chars)
This property is a fantastic opportunity, perfect for both investors and those looking to find their first home in spring! The charming duplex boasts three cozy bedrooms and two bathrooms, along with a beautifully updated galley kitchen. You’ll love the inviting living room featuring a fireplace and the thoughtful split floor plan that offers extra privacy. Plus, with a convenient carport and a peaceful location at the end of the street, you're just moments away from Mercer Botanical Gardens and the library!
-
2026-01-28$170,000 Active 519-char remark
Show marketing remark (519 chars)
This property is a fantastic opportunity, perfect for both investors and those looking to find their first home in spring! The charming duplex boasts three cozy bedrooms and two bathrooms, along with a beautifully updated galley kitchen. You’ll love the inviting living room featuring a fireplace and the thoughtful split floor plan that offers extra privacy. Plus, with a convenient carport and a peaceful location at the end of the street, you're just moments away from Mercer Botanical Gardens and the library!
-
2021-08-09soldstatus Sold 713-char remark
Show marketing remark (713 chars)
NO MORE SHOWINGS . Highest and Best by Tuesday, July 20th at midnight. Thank you for your offer. My seller will not accept any offer below listing price (which I said in my agent notes). Wonderful INVESTMENT PROPERTY for you or your clients. NOT a fix & flip! NOT TO BUY & RENT! READ THE BELOW! Tenant occupied till end of April, 2022. (DO NOT DISTURB TENANTS FOR VIEWING). Fresh paint & carpet. Sunroom has been enclosed for a wonderful extra bedroom or office. Living Room has vaulted ceiling with skylights. Two master full bedrooms & with dbl. sinks. Great location to all shopping. Has been continuously leased for all it’s years.
-
2021-07-29status Pending 713-char remark
Show marketing remark (713 chars)
NO MORE SHOWINGS . Highest and Best by Tuesday, July 20th at midnight. Thank you for your offer. My seller will not accept any offer below listing price (which I said in my agent notes). Wonderful INVESTMENT PROPERTY for you or your clients. NOT a fix & flip! NOT TO BUY & RENT! READ THE BELOW! Tenant occupied till end of April, 2022. (DO NOT DISTURB TENANTS FOR VIEWING). Fresh paint & carpet. Sunroom has been enclosed for a wonderful extra bedroom or office. Living Room has vaulted ceiling with skylights. Two master full bedrooms & with dbl. sinks. Great location to all shopping. Has been continuously leased for all it’s years.
-
2021-07-22status Option Pending 713-char remark
Show marketing remark (713 chars)
NO MORE SHOWINGS . Highest and Best by Tuesday, July 20th at midnight. Thank you for your offer. My seller will not accept any offer below listing price (which I said in my agent notes). Wonderful INVESTMENT PROPERTY for you or your clients. NOT a fix & flip! NOT TO BUY & RENT! READ THE BELOW! Tenant occupied till end of April, 2022. (DO NOT DISTURB TENANTS FOR VIEWING). Fresh paint & carpet. Sunroom has been enclosed for a wonderful extra bedroom or office. Living Room has vaulted ceiling with skylights. Two master full bedrooms & with dbl. sinks. Great location to all shopping. Has been continuously leased for all it’s years.
-
2021-07-13$120,000 Active 713-char remark
Show marketing remark (713 chars)
NO MORE SHOWINGS . Highest and Best by Tuesday, July 20th at midnight. Thank you for your offer. My seller will not accept any offer below listing price (which I said in my agent notes). Wonderful INVESTMENT PROPERTY for you or your clients. NOT a fix & flip! NOT TO BUY & RENT! READ THE BELOW! Tenant occupied till end of April, 2022. (DO NOT DISTURB TENANTS FOR VIEWING). Fresh paint & carpet. Sunroom has been enclosed for a wonderful extra bedroom or office. Living Room has vaulted ceiling with skylights. Two master full bedrooms & with dbl. sinks. Great location to all shopping. Has been continuously leased for all it’s years.
-
2002-01-07soldstatus
-
2002-01-07soldstatus
-
1995-08-24soldstatus
ⓘ Source: listings_history table (triggers on properties + properties_extension) + one-shot
backfill from property_details.listing_events for pre-trigger history.
Tax reassessment forecast TX · Resets to sale price
- Current annual tax
- $4,923 · $410/mo
- Projected year-2 tax
- $4,923 · $410/mo
- Expected delta
- $0/yr ($0/mo · 0.0%)
ⓘ Screening estimate from a state-policy table — verify with the county assessor before closing.
Climate risk First Street
- Flood 1/10 Low FEMA zone X (unshaded) · 0% chance over 30 yrs
- Wildfire 3/10 Moderate
- Heat 9/10 Extreme 7 d/yr ≥110°F today · 25 d/yr by 30 yrs out
- Wind 8/10 Severe 99% chance of damaging wind over 30 yrs
- Air quality 3/10 Moderate 3 unhealthy d/yr today · 3 by 30 yrs out
Nearby sold comps map
Loading sold comps map…
Walkable amenities ~0.75 mi
Loading nearby amenities…
Taxation est. · year 1
- Rental income
- $18,121
- − Mortgage interest
- −$7,842
- − Property taxes
- −$4,923
- − Insurance
- −$700
- − Repairs & maintenance
- −$1,450
- − Management
- −$1,450
- − Depreciation
- −$4,073
- Taxable loss
- −$2,316
- Est. tax savings @ 24.0%
- +$556
- After-tax cash flow
- $439/yr
For passive investors: Depreciation is non-cash, so a rental often shows a tax loss while cash-flowing — sheltering income. Rental losses are passive: they offset passive income freely, and up to $25,000/yr can offset ordinary (W-2) income if you actively participate and your MAGI is under $100k (phasing out to $0 by $150k); unused losses carry forward. On sale, claimed depreciation is recaptured at up to 25%, and gains may owe capital-gains tax (a 1031 exchange can defer both). Figures are a year-1 estimate at your 24.0% rate — not tax advice; consult a CPA.
Schools (NCES district)
- District
- Spring ISD
- NCES district ID
- 4841220
- Math proficiency
- 19% ▼ -13.00%
- Reading proficiency
- 26% ▼ -6.00%
- Median HH income
- $51,584
- Composite
- 20.12/100
- National rank
- #8643
- State rank
- #730 of 826 in TX
Livability — Spring
- Score
- 66/100
- State rank
- #635
- US rank
- #12101
Category grades
Schools grade is shown separately in the Schools card above.
Census & demographics
- Census place
- Spring, TX
- County
- Harris County · 4,702,590 people
- City population
- 430,529
- Metro
- Houston-The Woodlands-Sugar Land, TX
- Population (ZIP)
- 69,739
- Household income
- $88,617
- Rent vs Own
- Severe rent burden
- 1050.0
Population outlook (Harris County) Hauer SSP2
- Today (2025)
- 5,571,493 people
- By 2030
- 6,089,821 · +9.3%
- By 2040
- 7,142,806 · +28.2%
- By 2050
- 8,185,864 · +46.9%
- By 2075
- 10,574,329 · +89.8%
- By 2100
- 12,109,958 · +117.4%
Race, ethnicity, and origin ACS 2023
- Neighborhood character
- Diverse neighborhood (Simpson 0.69)
- Race & ethnicity
- Hispanic / Latino 40% White 30% Black 23% Two or more races 22% Asian 3%
- Hispanic origin (detail)
- Mexican 27% Puerto Rican 2% Cuban 2% Dominican 2%
- Common ancestry
- Lithuanian 2% Italian 1% Slovak 1%
- Foreign-born
- 17% · Canada, Jamaica, Vietnam
- Languages at home
- 64% English-only · Spanish 32% Vietnamese 1% Other Indo-European 1%
Political lean MEDSL · Harris
- 2024 margin
- Lean D (+5.5) · D 52.0% · R 46.4% · Other 1.6%
- 2008→2024 swing
- +3.9pp toward D · 2008: 1.6pp · 2024: 5.5pp
- All cycles
- 2024: D+5.5 2020: D+13.3 2016: D+12.4 2012: D+0.1 2008: D+1.6
Not yet ingested
- Civics
- —
Market trends
- HPI YoY
- ▼ -142.98%
- Current HPI
- 251.7231
- Rent YoY
- ▼ -0.30%
- Metro
- Houston-The Woodlands-Sugar Land, TX
- State GDP YoY
- ▲ 3.95%
- F500 in state
- 110
Industry mix (Fortune 500 HQ in TX)
| Industry | F500 HQs | Revenue |
|---|---|---|
| Energy | 16 | $1,198B |
|
||
| Technology | 5 | $198B |
|
||
| Engineering / Construction | 4 | $72B |
|
||
| Energy Services | 3 | $60B |
|
||
| Utilities | 3 | $41B |
|
||
| Healthcare | 2 | $330B |
|
||
Price history
+16.7% since first listed9 events — show timeline
- 2026-02-20 Price Changed $140,000 HARMLS
- 2026-01-28 Listed $170,000 HARMLS
- 2021-08-09 Sold (MLS) — HARMLS
- 2021-07-29 Pending — HARMLS
- 2021-07-22 Pending — HARMLS
- 2021-07-13 Listed $120,000 HARMLS
- 2002-01-07 Sold (Public Records) — Public Records
- 2002-01-07 Sold (Public Records) — Public Records
- 1995-08-24 Sold (Public Records) — Public Records
Property tax history
+5.8%/yrLatest (2025): $4,923 · -3.2% YoY. Source: county tax records.
Cash-flow waterfall
monthlySold comps — $/sqft
last 12 mo · ≤1 miLoading sold comps…