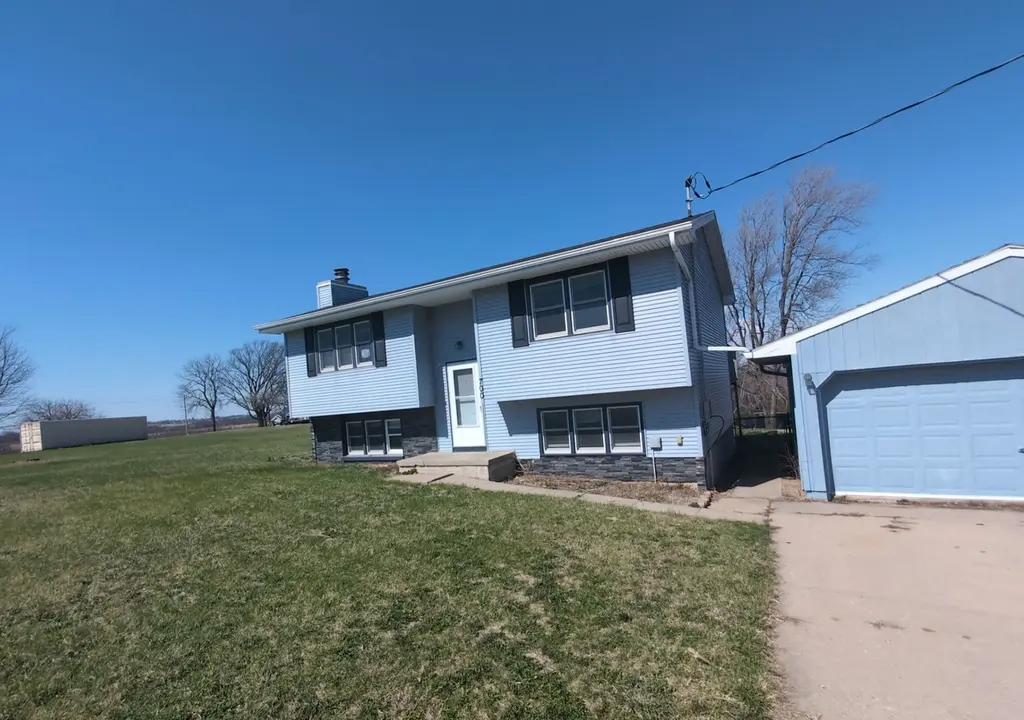
700 S Vine St · Hartford, IA
Flood risk 1/10 · Minimal
- FEMA flood zone
- X (unshaded)
- Chance of flooding over 30 yrs
- 0.0%
- Est. flood insurance / yr
- $473 – $860
Fire risk 3/10 · Minor
- Est. fire insurance / yr
- $902 – $1,676
Heat risk 3/10 · Minor
- Hot days now (above 103°F)
- 7 days/yr
- Hot days in 30 yrs
- 16 days/yr
Wind risk 2/10 · Minimal
- Chance of severe wind over 30 yrs
- —
Air-quality risk 2/10 · Minimal
- Unhealthy air days now
- 0 days/yr
- Unhealthy air days in 30 yrs
- 1 days/yr
Risk factors via First Street. Map © Google.
Why this score? — see what drove the D grade
The composite is a weighted blend of 9 inputs, each scored 0–100. Each bar is that input's sub-score; the figure is the points it added to the 100-point composite (weight × sub-score).
- ARV discount +15.0/15.0
- Cash flow +8.4/30.0
- Schools +5.6/10.0
- 1% rule +3.7/10.0
- Livability +3.0/5.0
- Rent growth +2.5/5.0
- Condition / age +2.5/5.0
- DSCR +2.3/10.0
- Appreciation +0.0/10.0
$162,000
🖨 Deal sheet (PDF) 📄 Offer letter ✓ Due diligence
Listing remarks MLS
3-bedroom, 2-bath split-foyer home offering great space and functionality. Features a 2-car detached garage, a large deck perfect for entertaining, and a fully fenced yard—ideal for pets, play, or relaxing outdoors.
Key facts
- Large deck
- Fully fenced yard
- Detached garage
Tags
Neighborhood map
What this means for you Summary
Snapshot
- This is a 3-bed/1.5-bath single-family listed at $162k.
Deal economics
- At list price, monthly cash flow is $-144 ($-2k/yr) — negative.
- To cash-flow at today's rent, offer at most $137k (15.7% below list).
- To meet the 1% rule (rent ≥ 1% of price), the offer needs to be $140k (13.4% below list).
- Recommended offer: $137k (15.7% below list) — sets the bar for cash-flow.
Location & tenants
- Location reads 60/100 on livability (#841 in IA) — a middle-class / working-renter tenant base. Strengths: cost of living A+, housing A+, employment B; Watch: amenities F, commute F, health & safety F.
- Carlisle Community School District (town): math 64% / reading 65% proficiency, ranked #182 of 289 in IA (top 63%) — acceptable for families but not a draw, mixed tenant base, ~2y average lease.
- Zoned schools: Carlisle Elementary School (math 72% / reading 42%, grade C+, #436 of 616 statewide, top 74%, 765 students, 31% FRL); Carlisle Middle School (math 64% / reading 70%, grade A-, #140 of 246 statewide, top 60%, 543 students, 31% FRL); Carlisle High School (math 55% / reading 64%, grade C+, #263 of 336 statewide, top 81%, 743 students, 27% FRL).
- Market conditions: 4 active listings in the ZIP; 439 units permitted in Warren County in 2024 (0 in 5+ unit buildings).
Forward outlook
- Local home prices are declining (-3.0%/yr); year-one equity from $1k of loan paydown is wiped out by about $5k of value loss. Plan a longer hold.
- Warren County population projected at +22% by 2050 — long-run rental-demand tailwind backs the buy-and-hold thesis.
Negotiation context
- It's been on market 69 days — a 6% lower offer ($152k) is reasonable based on typical stale-listing flexibility.
- 7 sale attempts since 14y ago; this cycle's ask has dropped $25k (13%) from the opening price — seller is motivated, your offer sets the floor, not the list.
Questions for the listing agent
- What do current leases actually rent for vs. the listed asking? Can we see a recent rent roll and the last 12 months of T-12 income?
- It's been on market 69 days. Have you received any prior offers? Is the seller open to a 16% concession, seller financing, or rate buy-down credit?
- Built in 1979 — when were the roof, HVAC, electrical panel, plumbing, and water heater last replaced?
- Why hasn't it sold? Are there any deal-killer items the seller is aware of (foundation, flood, title, zoning, code violations)?
- Is there a deadline driving the sale (1031 exchange, divorce, estate, relocation)? That informs how much negotiation room exists.
- Schools are B-rated — typically a magnet for longer-tenancy family renters. What's the average tenant stay here, and is there a school-zone premium baked into asking?
- The area grade is low — what's the realistic commute time and amenity access for the typical tenant pool here? Any planned neighborhood developments (good or bad) we should know about?
- What's the average days-on-market for RENTAL listings here right now (not sales)? A rising rental-DOM trend means longer vacancies and softer asking-rent achievability than the comps imply.
- What's the recent tenant-quality profile in this submarket — average credit score on applications, eviction rate, late-payment / NSF rate, and stable-employment percentage? A property-management company in the area should have these aggregated.
- How much new for-sale + rental construction is in the pipeline within 1–3 miles? Heavy new supply typically softens prices + rents 12–24 months out; constrained supply supports both.
Investment metrics
- 1% rule
- 0.87% ✗
- Cap rate
- 5.23%
- Cash-on-cash
- -3.81%
- DSCR
- 0.83
- GRM
- 9.6
CMA / ARV
- ARV (median comp)
- $242,879
- List price
- $162,000
- Delta
- -33.30%
- Verdict
- UNDERPRICED
- Comps
- 18 within 1.0 mi
Show comp detail 2 sales within ~0.75 mi
| Address | Dist | Beds/Ba | Sqft | Sold | Price | $/sf | Match |
|---|---|---|---|---|---|---|---|
| 660 S Vine St | 0.04mi | 4/2.0 (+1) | 1,460 (-4%) | 12mo | $99,900 | $68 | 74 |
| 200 N West St | 0.43mi | 4/1.0 (+1) | 1,589 (+4%) | 2mo | $209,900 | $132 | 64 |
Match score weights: distance 35% · size 25% · config 20% · recency 20%. Top-matched comps best support the ARV.
Projected returns pro-forma
-3.0% appreciation · 3.0% rent growth · sell at horizon
- IRR
- -22.6%
- Equity multiple
- 0.22×
- Total profit
- $-35,326
- Equity at exit
- $24,155
- IRR
- -16.7%
- Equity multiple
- 0.07×
- Total profit
- $-42,163
- Equity at exit
- $14,007
Cash invested: $45,360 (down + closing). Projections, not guarantees.
Landlord ↔ Tenant lean methodology
- Overall (STATE)
- 83 Strongly Landlord-Friendly
- State Iowa
- 83 Strongly Landlord-Friendly · R+6
- County
- — inherits STATE
- City
- — inherits STATE
ZIP-level market 50118
- Home prices YoY
- -13.7%
- Active inventory
- 4
- Price-to-rent
- 9.6×
Monthly cashflow live
- Estimated rent
- $1,403 medium interval (Pro) →
- Mortgage (P&I)
- −$850
- Tax from tax record
- −$335 /mo · $4,024/yr
- Insurance
- −$68
- HOA
- −$0
- Vacancy / Maint / Mgmt
- −$295
- Net cashflow
- $-144
Break-even live
Sensitivity live
| Price | -10% $-52 | -5% $-98 | +0% $-144 | +5% $-190 | +10% $-236 |
|---|---|---|---|---|---|
| Rent | -10% $-255 | -5% $-200 | +0% $-144 | +5% $-89 | +10% $-33 |
| Rate | -1.0pp $-63 | -0.5pp $-103 | base $-144 | +0.5pp $-186 | +1.0pp $-229 |
UW: 25.0% down · 7.5% · 30yr · 1.5% tax · 5.0% vac · 8.0% maint · 8.0% mgmt
Financing live
Cash to close
- Down payment
- $40,500
- Closing costs
- $4,860
- Reserves months
- —
- Total cash needed
- —
Loan-product check · same deal, 3 products live
Conventional
25% down · 7.5% · 30yr
- Down + closing
- —
- Monthly P&I
- —
- Monthly cashflow
- —
- DSCR
- —
- Eligible?
- —
Personal DTI + credit; lowest rate.
DSCR
20% down · 8.5% · 30yr
- Down + closing
- —
- Monthly P&I
- —
- Monthly cashflow
- —
- DSCR
- —
- Eligible?
- —
No personal income docs; deal must DSCR.
Hard money
10% down · 12.0% · 12mo
- Down + closing
- —
- Monthly P&I
- —
- Monthly cashflow
- —
- DSCR
- —
- Eligible?
- —
Short-term bridge; refi at stabilization.
Listing history 37 events
-
2026-06-21days on market $162,000 Active 69 DOM
-
2026-06-18days on market $162,000 Active 66 DOM
-
2026-06-17days on market $162,000 Active 65 DOM
-
2026-06-16pricedays on market $162,000 Active 64 DOM
-
2026-06-15days on market $172,000 Active 63 DOM
-
2026-06-14days on market $172,000 Active 61 DOM
-
2026-06-13days on market $172,000 Active 60 DOM
-
2026-06-10days on market $172,000 Active 58 DOM
-
2026-06-09days on market $172,000 Active 57 DOM
-
2026-06-08days on market $172,000 Active 56 DOM
-
2026-06-07days on market $172,000 Active 55 DOM
-
2026-06-05days on market $172,000 Active 52 DOM
-
2026-06-03days on market $172,000 Active 51 DOM
-
2026-06-02days on market $172,000 Active 50 DOM
-
2026-06-01days on market $172,000 Active 49 DOM
-
2026-05-31days on market $172,000 Active 48 DOM
-
2026-05-31days on market $172,000 Active 47 DOM
-
2026-05-18price $172,000 221-char remark
Show marketing remark (221 chars)
3-bedroom, 2-bath split-foyer home offering great space and functionality. Features a 2-car detached garage, a large deck perfect for entertaining, and a fully fenced yard—ideal for pets, play, or relaxing outdoors.
-
2026-04-13$187,000 Active 221-char remark
Show marketing remark (221 chars)
3-bedroom, 2-bath split-foyer home offering great space and functionality. Features a 2-car detached garage, a large deck perfect for entertaining, and a fully fenced yard—ideal for pets, play, or relaxing outdoors.
-
2024-12-28status Active
-
2024-11-25status Pending
-
2024-10-24price $210,000
-
2024-10-01status Active
-
2024-09-23status Pending
-
2024-09-09$230,000 Active
-
2020-09-02soldstatus $195,500
-
2020-08-28soldstatus $195,500 Closed
-
2020-07-14status Pending
-
2020-07-10$195,500 Active
-
2017-09-28soldstatus $95,000
-
2014-03-10soldstatus $95,000
-
2013-11-25soldstatus $47,601
-
2013-06-12historical
-
2013-04-16$59,900
-
2012-02-06$55,000
-
2008-02-01soldstatus $95,600
-
2006-09-08soldstatus $96,500
ⓘ Source: listings_history table (triggers on properties + properties_extension) + one-shot
backfill from property_details.listing_events for pre-trigger history.
Tax reassessment forecast IA · Partial reset (capped growth)
- Current annual tax
- $4,024 · $335/mo
- Projected year-2 tax
- $4,024 · $335/mo
- Expected delta
- $0/yr ($0/mo · 0.0%)
ⓘ Screening estimate from a state-policy table — verify with the county assessor before closing.
Climate risk First Street
- Flood 1/10 Low FEMA zone X (unshaded) · 0% chance over 30 yrs
- Wildfire 3/10 Moderate
- Heat 3/10 Moderate 7 d/yr ≥103°F today · 16 d/yr by 30 yrs out
- Wind 2/10 Low
- Air quality 2/10 Low 0 unhealthy d/yr today · 1 by 30 yrs out
Nearby sold comps map
Loading sold comps map…
Walkable amenities ~0.75 mi
Loading nearby amenities…
Taxation est. · year 1
- Rental income
- $16,835
- − Mortgage interest
- −$9,075
- − Property taxes
- −$4,024
- − Insurance
- −$810
- − Repairs & maintenance
- −$1,347
- − Management
- −$1,347
- − Depreciation
- −$4,713
- Taxable loss
- −$4,480
- Est. tax savings @ 24.0%
- +$1,075
- After-tax cash flow
- $-654/yr
For passive investors: Depreciation is non-cash, so a rental often shows a tax loss while cash-flowing — sheltering income. Rental losses are passive: they offset passive income freely, and up to $25,000/yr can offset ordinary (W-2) income if you actively participate and your MAGI is under $100k (phasing out to $0 by $150k); unused losses carry forward. On sale, claimed depreciation is recaptured at up to 25%, and gains may owe capital-gains tax (a 1031 exchange can defer both). Figures are a year-1 estimate at your 24.0% rate — not tax advice; consult a CPA.
Schools (NCES district)
- District
- Carlisle Community School District
- NCES district ID
- 1906270
- Math proficiency
- 64% ▼ -10.00%
- Reading proficiency
- 65% ▼ -3.00%
- Median HH income
- $65,384
- Composite
- 56.28/100
- National rank
- #1170
- State rank
- #182 of 289 in IA
Livability — Hartford
- Score
- 60/100
- State rank
- #841
- US rank
- #19341
Category grades
Schools grade is shown separately in the Schools card above.
Census & demographics
- Census place
- Hartford, IA
- Population (ZIP)
- 989
Population outlook (Warren County) Hauer SSP2
- Today (2025)
- 54,222 people
- By 2030
- 56,863 · +4.9%
- By 2040
- 61,691 · +13.8%
- By 2050
- 65,939 · +21.6%
- By 2075
- 75,626 · +39.5%
- By 2100
- 80,425 · +48.3%
Race, ethnicity, and origin ACS 2023
- Neighborhood character
- Predominantly White (90%)
- Race & ethnicity
- White 90% Hispanic / Latino 5% Two or more races 5% Asian 2%
- Hispanic origin (detail)
- Mexican 4% Puerto Rican 1%
- Common ancestry
- Portuguese 6% Slovak 3% Serbian 3%
- Foreign-born
- 2% · China, Canada
- Languages at home
- 98% English-only · Spanish 1% Chinese 1%
Political lean MEDSL · Warren
- 2024 margin
- Strong R (+20.7) · D 38.9% · R 59.7% · Other 1.4%
- 2008→2024 swing
- -21.4pp toward R · 2008: 0.6pp · 2024: -20.7pp
- All cycles
- 2024: R+20.7 2020: R+16.8 2016: R+16.4 2012: R+2.0 2008: D+0.6
Not yet ingested
- Civics
- —
Market trends
- HPI YoY
- ▼ -21.56%
- Current HPI
- 135.8631
- Rent YoY
- —
- Metro
- —
- State GDP YoY
- ▲ 2.48%
- F500 in state
- 4
Industry mix (Fortune 500 HQ in IA)
| Industry | F500 HQs | Revenue |
|---|---|---|
| Financial Services | 1 | $16B |
|
||
| Retail / Convenience | 1 | $15B |
|
||
Price history
+78.2% since first listed20 events — show timeline
- 2026-05-18 Price Changed $172,000 DMMLS
- 2026-04-13 Listed $187,000 DMMLS
- 2024-12-28 Relisted — DMMLS
- 2024-11-25 Pending — DMMLS
- 2024-10-24 Price Changed $210,000 DMMLS
- 2024-10-01 Relisted — DMMLS
- 2024-09-23 Pending — DMMLS
- 2024-09-09 Listed $230,000 DMMLS
- 2020-09-02 Sold (Public Records) $195,500 Public Records
- 2020-08-28 Sold (MLS) $195,500 DMMLS
- 2020-07-14 Pending — DMMLS
- 2020-07-10 Listed $195,500 DMMLS
- 2017-09-28 Sold (Public Records) $95,000 Public Records
- 2014-03-10 Sold (Public Records) $95,000 Public Records
- 2013-11-25 Sold (MLS) $47,601 DMMLS
- 2013-06-12 Listing Removed — DMMLS
- 2013-04-16 Listed $59,900 DMMLS
- 2012-02-06 Listed $55,000 DMMLS
- 2008-02-01 Sold (Public Records) $95,600 Public Records
- 2006-09-08 Sold (Public Records) $96,500 Public Records
Property tax history
+5.6%/yrLatest (2025): $4,024 · +34.3% YoY. Source: county tax records.
Cash-flow waterfall
monthlySold comps — $/sqft
last 12 mo · ≤1 miLoading sold comps…