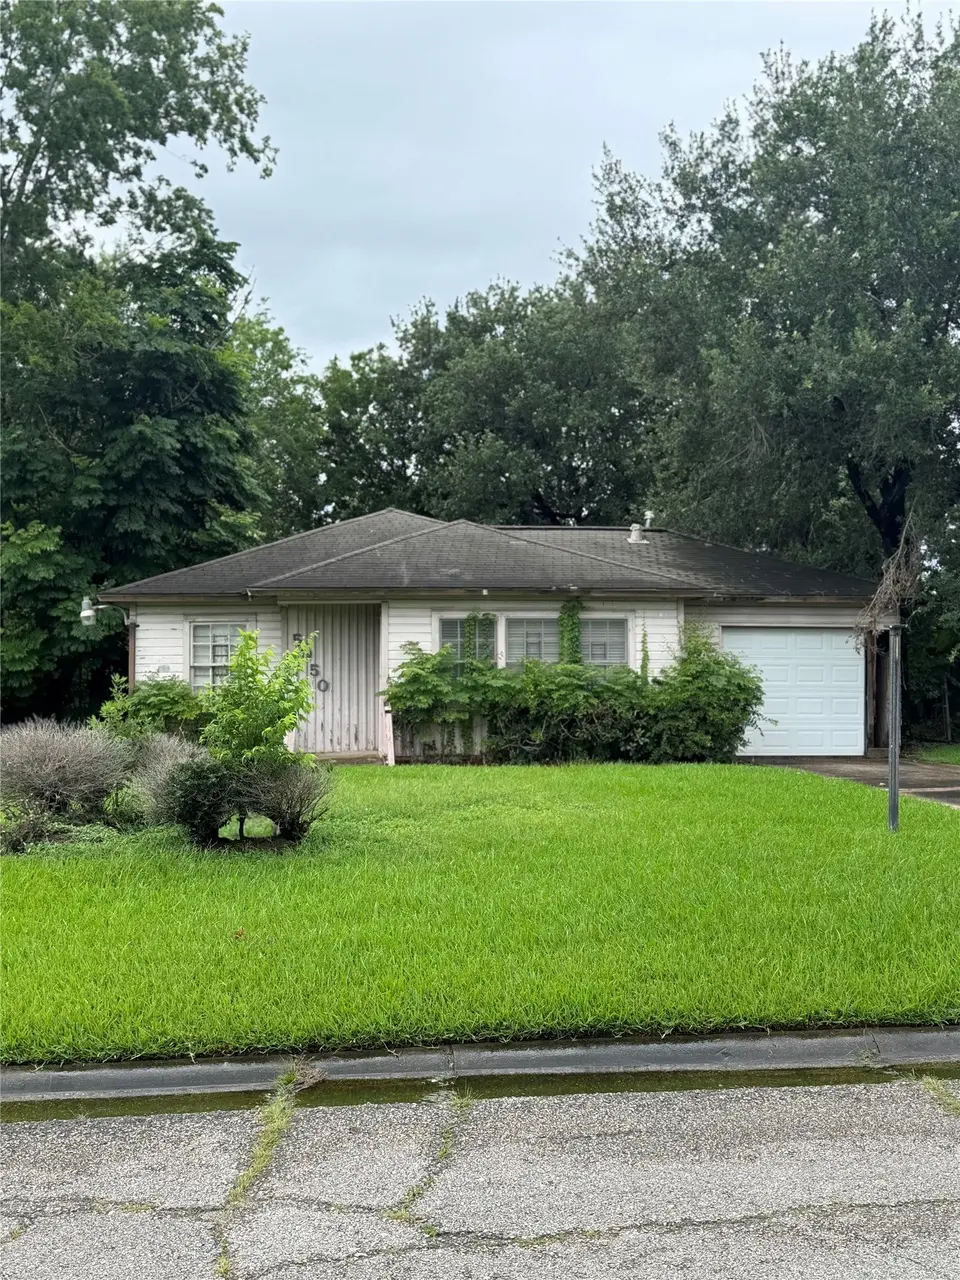
5050 Nassau Rd · Houston, TX
Flood risk 6/10 · Moderate
- FEMA flood zone
- X (unshaded)
- Chance of flooding over 30 yrs
- 0.74%
- Est. flood insurance / yr
- $507 – $1,088
Fire risk 1/10 · Minimal
- Est. fire insurance / yr
- $1,222 – $2,270
Heat risk 9/10 · Severe
- Hot days now (above 109°F)
- 7 days/yr
- Hot days in 30 yrs
- 24 days/yr
Wind risk 9/10 · Severe
- Chance of severe wind over 30 yrs
- 99.0%
Air-quality risk 2/10 · Minimal
- Unhealthy air days now
- 2 days/yr
- Unhealthy air days in 30 yrs
- 2 days/yr
Risk factors via First Street. Map © Google.
Why this score? — see what drove the C- grade
The composite is a weighted blend of 9 inputs, each scored 0–100. Each bar is that input's sub-score; the figure is the points it added to the 100-point composite (weight × sub-score).
- Cash flow +15.0/30.0
- ARV discount +15.0/15.0
- 1% rule +5.3/10.0
- DSCR +4.6/10.0
- Livability +3.7/5.0
- Rent growth +3.0/5.0
- Schools +2.7/10.0
- Condition / age +2.5/5.0
- Appreciation +0.0/10.0
$140,000
🖨 Deal sheet 📄 Offer letter ✓ Due diligence
Listing remarks MLS
Ideal property for gut renovation or even new construction. Currently a 3 bedroom and 2 bathroom home in need of restoration. In its current state, the footprint can be enlarged to include all the modern necessities! The neighborhood is established and brand new construction nearby. Property is being sold as-is. Close proximity to Texas Medical Center Helix Park and Levit Green. Quick commute to NRG, the Museum District and Downtown Houston.
Key facts
- Quick commute to nrg
- Gut renovation
- New construction
Tags
Neighborhood map
What this means for you Summary
Snapshot
- This is a 3-bed/1.0-bath single-family listed at $140k.
Deal economics
- At list price, monthly cash flow is $44 ($524/yr) — positive.
- The deal already cash-flows at list — no discount required.
- Meets the 1% rule at list price ($1k rent vs $140k).
- Recommended offer: $123k (12.0% below list) — sets the bar for market timing.
- Cap rate 6.7% vs local median 3.2% in Houston — top-decile yield for the area; either an underpriced asset or a hidden risk that comps aren't pricing in. Stress-test before assuming the spread holds.
Location & tenants
- Location reads 74/100 on livability (#184 in TX, #4,771 nationally) — a middle-class / working-renter tenant base. Strengths: amenities A+, cost of living A+, housing A+; Watch: schools D, crime F.
- Houston ISD (urban): math 27% / reading 35% proficiency, ranked #593 of 826 in TX (top 72%) — families likely to look elsewhere, expect single-tenant / working-renter base with shorter leases; 71% free/reduced lunch — lower-income household profile, screen leases tightly.
- Market conditions: Rents rising (+2.2%/yr); 467 active listings in the ZIP; 34 comparable units currently listed for rent nearby; rentals at typical pace (median 24d on market — plan ~3-4 weeks tenant-placement turnaround); 29,883 units permitted in Harris County in 2024 (8,621 in 5+ unit buildings).
- This rent runs 38% of the median local income ($46k/yr) — at the standard rent-burdened threshold; future hikes will face affordability resistance.
Forward outlook
- Local home prices are declining (-3.0%/yr); year-one equity from $968 of loan paydown is wiped out by about $4k of value loss. Plan a longer hold.
- Harris County population projected at +47% by 2050 — long-run rental-demand tailwind backs the buy-and-hold thesis.
Negotiation context
- It's been on market 369 days — a 12% lower offer ($123k) is reasonable based on typical stale-listing flexibility.
- 2 sale attempts; this cycle's ask has dropped $40k (22%) from the opening price — seller is motivated, your offer sets the floor, not the list.
Risks & watch-outs
- Watch-outs: property tax is 2.6% of price; built in 1947 — expect roof / HVAC / electrical / plumbing capex.
- Climate carrying-cost: major flood risk; severe wind risk, 99% chance of damaging wind over 30y; extreme-heat days projected 7→24/yr by 2055 (HVAC capex compounding) — expect insurance premiums to compound above CPI over the hold.
Questions for the listing agent
- It's been on market 369 days. Have you received any prior offers? Is the seller open to a 12% concession, seller financing, or rate buy-down credit?
- Built in 1947 — when were the roof, HVAC, electrical panel, plumbing, and water heater last replaced?
- Property tax is high relative to price — has the assessment been appealed recently, and will the sale trigger a re-assessment?
- Why hasn't it sold? Are there any deal-killer items the seller is aware of (foundation, flood, title, zoning, code violations)?
- Is there a deadline driving the sale (1031 exchange, divorce, estate, relocation)? That informs how much negotiation room exists.
- Schools are D-rated, which usually means shorter tenancies and higher turnover. Who's the typical renter profile here, and what's been the actual vacancy rate?
- Crime grade is F in this area — have there been break-ins, vandalism, or insurance claims at this property in the last 3 years? What carrier currently insures it and at what premium?
- What's the average days-on-market for RENTAL listings here right now (not sales)? A rising rental-DOM trend means longer vacancies and softer asking-rent achievability than the comps imply.
- What's the recent tenant-quality profile in this submarket — average credit score on applications, eviction rate, late-payment / NSF rate, and stable-employment percentage? A property-management company in the area should have these aggregated.
- How much new for-sale + rental construction is in the pipeline within 1–3 miles? Heavy new supply typically softens prices + rents 12–24 months out; constrained supply supports both.
Investment metrics
- 1% rule
- 1.03% ✓
- Cap rate
- 6.67%
- Cash-on-cash
- 1.34%
- DSCR
- 1.06
- GRM
- 8.1
CMA / ARV
- ARV (median comp)
- $192,832
- List price
- $140,000
- Delta
- -27.40%
- Verdict
- UNDERPRICED
- Comps
- 20 within 1.0 mi
Show comp detail 11 sales within ~0.75 mi
| Address | Dist | Beds/Ba | Sqft | Sold | Price | $/sf | Match |
|---|---|---|---|---|---|---|---|
| 5063 Nassau Rd | 0.04mi | 3/2.0 | 1,092 (-4%) | 10mo | $222,900 | $204 | 78 |
| 5107 Dickens Rd | 0.06mi | 3/1.0 | 1,064 (-7%) | 10mo | $159,000 | $149 | 78 |
| 5034 Nassau Rd | 0.04mi | 2/1.0 (-1) | 1,049 (-8%) | 13mo | $100,000 | $95 | 68 |
| 4915 Dickens Rd | 0.18mi | 3/1.5 | 1,201 (+5%) | 22mo | $209,000 | $174 | 62 |
| 5023 Nassau Rd | 0.09mi | 2/1.0 (-1) | 1,001 (-12%) | 14mo | $125,000 | $125 | 59 |
| 6112 Pineway Blvd | 0.55mi | 3/1.0 | 1,233 (+8%) | 5mo | $175,000 | $142 | 56 |
| 5026 Marietta Ln | 0.24mi | 4/1.0 (+1) | 1,212 (+6%) | 21mo | $179,900 | $148 | 56 |
| 4826 Ventura Ln | 0.46mi | 3/2.0 | 1,268 (+11%) | 2mo | $259,900 | $205 | 54 |
| 5518 Nassau Rd | 0.41mi | 3/2.0 | 1,279 (+12%) | 4mo | $145,000 | $113 | 53 |
| 4731 Marietta Ln | 0.64mi | 2/1.0 (-1) | 1,260 (+10%) | 14mo | $205,000 | $163 | 36 |
| 3603 Lazywood Ln | 0.65mi | 3/1.0 | 1,039 (-9%) | 24mo | $194,900 | $188 | 35 |
Match score weights: distance 35% · size 25% · config 20% · recency 20%. Top-matched comps best support the ARV.
Projected returns pro-forma
-3.0% appreciation · 2.17% rent growth · sell at horizon
- IRR
- -15.1%
- Equity multiple
- 0.46×
- Total profit
- $-20,999
- Equity at exit
- $20,874
- IRR
- -8.1%
- Equity multiple
- 0.51×
- Total profit
- $-19,115
- Equity at exit
- $12,105
Cash invested: $39,200 (down + closing). Projections, not guarantees.
Landlord ↔ Tenant lean methodology
- Overall (STATE)
- 87 Strongly Landlord-Friendly
- State Texas
- 87 Strongly Landlord-Friendly · R+5
- County
- — inherits STATE
- City
- — inherits STATE
ZIP-level market 77021
- Home prices YoY
- -23.6%
- Rents YoY
- 2.2%
- Active inventory
- 467
- Price-to-rent
- 8.1×
Monthly cashflow live
- Estimated rent
- $1,440 high interval (Pro) →
- Mortgage (P&I)
- −$734
- Tax from tax record
- −$302 /mo · $3,618/yr
- Insurance
- −$58
- HOA
- −$0
- Vacancy / Maint / Mgmt
- −$302
- Net cashflow
- $44
Break-even live
UW: 25.0% down · 7.5% · 30yr · 1.5% tax · 5.0% vac · 8.0% maint · 8.0% mgmt
Financing live
Cash to close
- Down payment
- $35,000
- Closing costs
- $4,200
- Reserves months
- —
- Total cash needed
- —
Loan-product check · same deal, 3 products live
Conventional
25% down · 7.5% · 30yr
- Down + closing
- —
- Monthly P&I
- —
- Monthly cashflow
- —
- DSCR
- —
- Eligible?
- —
Personal DTI + credit; lowest rate.
DSCR
20% down · 8.5% · 30yr
- Down + closing
- —
- Monthly P&I
- —
- Monthly cashflow
- —
- DSCR
- —
- Eligible?
- —
No personal income docs; deal must DSCR.
Hard money
10% down · 12.0% · 12mo
- Down + closing
- —
- Monthly P&I
- —
- Monthly cashflow
- —
- DSCR
- —
- Eligible?
- —
Short-term bridge; refi at stabilization.
Rent comps 34 comps
| Address | Beds | Baths | Sqft | Rent | $/sqft | DOM | Units | Dist |
|---|---|---|---|---|---|---|---|---|
| 5101 Martin Luther King Blvd Unit MO54 Houston, TX | 2.0 | 2.0 | 1322 | $1,210 | $0.92 | 12d | 1 | 0.13mi |
| 4977 Martin Luther King Blvd Houston, TX | 4.0 | 4.0 | 1396 | $870 | $0.62 | 24d | 1 | 0.21mi |
| 5610 Royal Palms St Houston, TX | 2.0 | 1.0 | 900 | $950 | $1.06 | 24d | 1 | 0.51mi |
| 5154 Griggs Rd Unit CAVE Houston, TX | 2.0 | 2.0 | 1322 | $1,420 | $1.07 | 3d | 1 | 0.57mi |
| 5116 Griggs Rd Houston, TX | 3.0 | 2.0 | 1131 | $1,316 | $1.16 | 43d | 1 | 0.60mi |
| 4722 Old Spanish Trl Unit B301 Houston, TX | 2.0 | 2.0 | 1027 | $1,695 | $1.65 | 44d | 1 | 0.64mi |
| 5520 Griggs Rd Houston, TX | 2.0 | 2.0 | 1322 | $1,241 | $0.94 | 43d | 1 | 0.68mi |
| 5520 Griggs Rd Houston, TX | 2.0 | 2.0 | 1322 | $1,241 | $0.94 | 22d | 1 | 0.68mi |
| 5514 Griggs Rd Unit 2047 Houston, TX | 2.0 | 2.0 | 1322 | $1,214 | $0.92 | 3d | 1 | 0.69mi |
| 5514 Griggs Rd Unit 2047 Houston, TX | 2.0 | 2.0 | 1322 | $1,225 | $0.93 | 11d | 1 | 0.69mi |
| 5514 Griggs Rd Houston, TX | 2.0 | 2.0 | 1322 | $1,210 | $0.92 | 43d | 1 | 0.75mi |
| 5514 Griggs Rd Unit 422 Houston, TX | 2.0 | 2.0 | 1322 | $1,190 | $0.90 | 7d | 1 | 0.77mi |
| 5514 Griggs Rd Unit 5571 Houston, TX | 2.0 | 2.0 | 1322 | $1,214 | $0.92 | 11d | 1 | 0.77mi |
| 5514 Griggs Rd Unit 2187 Houston, TX | 2.0 | 2.0 | 1322 | $1,182 | $0.89 | 3d | 1 | 0.77mi |
| 5514 Griggs Rd Unit 2162 Houston, TX | 2.0 | 2.0 | 1322 | $1,190 | $0.90 | 5d | 1 | 0.77mi |
| 5924 Schroeder Rd Houston, TX | 2.0 | 1.0 | 900 | $895 | $0.99 | 22d | 1 | 0.79mi |
| 5924 Schroeder Rd Houston, TX | 2.0 | 1.0 | 900 | $895 | $0.99 | 43d | 1 | 0.79mi |
| 5918 Schroeder Rd Houston, TX | 1.0–2.0 | 1.0 | 850 | $1,000 | $1.18 | 43d | 1 | 0.80mi |
| 4465 N MacGregor Way Houston, TX | 4.0 | 4.0 | 1366 | $940 | $0.69 | 24d | 1 | 0.82mi |
| 5123 Dewberry St Houston, TX | 4.0 | 2.0 | 1391 | $2,400 | $1.73 | 43d | 1 | 0.88mi |
| 2801 Carrolton St Houston, TX | 1.0–2.0 | 1.0 | 650 | $899 | $1.38 | 1d | 4 | 0.90mi |
| 2801 Carrolton St Houston, TX | 1.0–2.0 | 1.0 | 650 | $849 | $1.31 | 43d | 2 | 0.90mi |
| 3852 Telephone Rd Houston, TX | 1.0–3.0 | 1.0–2.0 | 911 | $1,640 | $1.80 | 2d | 19 | 1.21mi |
| 2606 Beatty St Unit 224 Houston, TX | 2.0 | 1.5 | 700 | $950 | $1.36 | 24d | 1 | 1.24mi |
| 5813 England St Unit A Houston, TX | 3.0 | 2.5 | 1473 | $2,195 | $1.49 | 4d | 1 | 1.24mi |
| 2606 Beatty St Houston, TX | 2.0 | 1.0 | 700 | $950 | $1.36 | 24d | 1 | 1.25mi |
| 6528 Weston St Unit A Houston, TX | 3.0 | 3.0 | 1484 | $2,200 | $1.48 | 43d | 1 | 1.28mi |
| 5835 Southmont St Houston, TX | 3.0 | 2.0 | 1200 | $1,700 | $1.42 | 43d | 1 | 1.28mi |
| 6532 Weston St Unit A Houston, TX | 3.0 | 3.0 | 1484 | $2,200 | $1.48 | 18d | 1 | 1.29mi |
| 5532 Eskridge St Houston, TX | 2.0 | 1.0 | 885 | $899 | $1.02 | 43d | 1 | 1.29mi |
| 5532 Eskridge St Houston, TX | 2.0 | 1.0 | 810 | $899 | $1.11 | 15d | 1 | 1.29mi |
| 5537 Bataan Rd Houston, TX | 2.0 | 1.0 | 880 | $1,300 | $1.48 | 43d | 1 | 1.40mi |
| 3810 Weslow St Unit B Houston, TX | 2.0 | 1.0 | 924 | $1,149 | $1.24 | 7d | 1 | 1.48mi |
| 3810 Weslow St Houston, TX | 2.0 | 1.0 | 924 | $1,449 | $1.57 | 43d | 1 | 1.48mi |
Listing history 18 events
-
2026-06-18days on market $140,000 Active 369 DOM
-
2026-06-17days on market $140,000 Active 368 DOM
-
2026-06-16days on market $140,000 Active 367 DOM
-
2026-06-15days on market $140,000 Active 366 DOM
-
2026-06-13days on market $140,000 Active 364 DOM
-
2026-06-10days on market $140,000 Active 360 DOM
-
2026-06-08days on market $140,000 Active 359 DOM
-
2026-06-07days on market $140,000 Active 358 DOM
-
2026-06-04days on market $140,000 Active 355 DOM
-
2026-06-01days on market $140,000 Active 352 DOM
-
2026-05-31days on market $140,000 Active 351 DOM
-
2025-12-14status Active 445-char remark
Show marketing remark (445 chars)
Ideal property for gut renovation or even new construction. Currently a 3 bedroom and 2 bathroom home in need of restoration. In its current state, the footprint can be enlarged to include all the modern necessities! The neighborhood is established and brand new construction nearby. Property is being sold as-is. Close proximity to Texas Medical Center Helix Park and Levit Green. Quick commute to NRG, the Museum District and Downtown Houston.
-
2025-12-14price $140,000 445-char remark
Show marketing remark (445 chars)
Ideal property for gut renovation or even new construction. Currently a 3 bedroom and 2 bathroom home in need of restoration. In its current state, the footprint can be enlarged to include all the modern necessities! The neighborhood is established and brand new construction nearby. Property is being sold as-is. Close proximity to Texas Medical Center Helix Park and Levit Green. Quick commute to NRG, the Museum District and Downtown Houston.
-
2025-12-12historical 445-char remark
Show marketing remark (445 chars)
Ideal property for gut renovation or even new construction. Currently a 3 bedroom and 2 bathroom home in need of restoration. In its current state, the footprint can be enlarged to include all the modern necessities! The neighborhood is established and brand new construction nearby. Property is being sold as-is. Close proximity to Texas Medical Center Helix Park and Levit Green. Quick commute to NRG, the Museum District and Downtown Houston.
-
2025-08-28price $160,000 445-char remark
Show marketing remark (445 chars)
Ideal property for gut renovation or even new construction. Currently a 3 bedroom and 2 bathroom home in need of restoration. In its current state, the footprint can be enlarged to include all the modern necessities! The neighborhood is established and brand new construction nearby. Property is being sold as-is. Close proximity to Texas Medical Center Helix Park and Levit Green. Quick commute to NRG, the Museum District and Downtown Houston.
-
2025-06-13$180,000 Active 445-char remark
Show marketing remark (445 chars)
Ideal property for gut renovation or even new construction. Currently a 3 bedroom and 2 bathroom home in need of restoration. In its current state, the footprint can be enlarged to include all the modern necessities! The neighborhood is established and brand new construction nearby. Property is being sold as-is. Close proximity to Texas Medical Center Helix Park and Levit Green. Quick commute to NRG, the Museum District and Downtown Houston.
-
2019-07-01soldstatus
-
1988-01-02soldstatus
ⓘ Source: listings_history table (triggers on properties + properties_extension) + one-shot
backfill from property_details.listing_events for pre-trigger history.
Tax reassessment forecast TX · Resets to sale price
- Current annual tax
- $3,618 · $302/mo
- Projected year-2 tax
- $3,618 · $302/mo
- Expected delta
- $0/yr ($0/mo · 0.0%)
ⓘ Screening estimate from a state-policy table — verify with the county assessor before closing.
Climate risk First Street
- Flood 6/10 Major FEMA zone X (unshaded) · 74% chance over 30 yrs
- Wildfire 1/10 Low
- Heat 9/10 Extreme 7 d/yr ≥109°F today · 24 d/yr by 30 yrs out
- Wind 9/10 Extreme 99% chance of damaging wind over 30 yrs
- Air quality 2/10 Low 2 unhealthy d/yr today · 2 by 30 yrs out
Nearby sold comps map
Loading sold comps map…
Walkable amenities ~0.75 mi
Loading nearby amenities…
Taxation est. · year 1
- Rental income
- $17,281
- − Mortgage interest
- −$7,842
- − Property taxes
- −$3,618
- − Insurance
- −$700
- − Repairs & maintenance
- −$1,382
- − Management
- −$1,382
- − Depreciation
- −$4,073
- Taxable loss
- −$1,717
- Est. tax savings @ 24.0%
- +$412
- After-tax cash flow
- $936/yr
For passive investors: Depreciation is non-cash, so a rental often shows a tax loss while cash-flowing — sheltering income. Rental losses are passive: they offset passive income freely, and up to $25,000/yr can offset ordinary (W-2) income if you actively participate and your MAGI is under $100k (phasing out to $0 by $150k); unused losses carry forward. On sale, claimed depreciation is recaptured at up to 25%, and gains may owe capital-gains tax (a 1031 exchange can defer both). Figures are a year-1 estimate at your 24.0% rate — not tax advice; consult a CPA.
Schools (NCES district)
- District
- Houston ISD
- NCES district ID
- 4823640
- Math proficiency
- 27% ▼ -18.00%
- Reading proficiency
- 35% ▼ -6.00%
- Median HH income
- $46,054
- Composite
- 26.63/100
- National rank
- #7173
- State rank
- #593 of 826 in TX
Livability — Houston
- Score
- 74/100
- State rank
- #184
- US rank
- #4771
Category grades
Schools grade is shown separately in the Schools card above.
Census & demographics
- Census place
- Houston, TX
- County
- Harris County · 4,702,590 people
- City population
- 3,226,434
- Metro
- Houston-The Woodlands-Sugar Land, TX
- Population (ZIP)
- 26,153
- Household income
- $45,574
- Rent vs Own
- Severe rent burden
- 2532.0
Population outlook (Harris County) Hauer SSP2
- Today (2025)
- 5,571,493 people
- By 2030
- 6,089,821 · +9.3%
- By 2040
- 7,142,806 · +28.2%
- By 2050
- 8,185,864 · +46.9%
- By 2075
- 10,574,329 · +89.8%
- By 2100
- 12,109,958 · +117.4%
Race, ethnicity, and origin ACS 2023
- Neighborhood character
- Diverse neighborhood (Simpson 0.55)
- Race & ethnicity
- Black 62% Hispanic / Latino 22% Two or more races 12% White 10% Asian 2%
- Hispanic origin (detail)
- Mexican 15%
- Common ancestry
- Italian 1% Romanian 1% Lithuanian 1%
- Foreign-born
- 11% · Canada
- Languages at home
- 77% English-only · Spanish 19% French/Haitian/Cajun 1% Other Indo-European 1%
Political lean MEDSL · Harris
- 2024 margin
- Lean D (+5.5) · D 52.0% · R 46.4% · Other 1.6%
- 2008→2024 swing
- +3.9pp toward D · 2008: 1.6pp · 2024: 5.5pp
- All cycles
- 2024: D+5.5 2020: D+13.3 2016: D+12.4 2012: D+0.1 2008: D+1.6
Not yet ingested
- Civics
- —
Market trends
- HPI YoY
- ▼ -71.22%
- Current HPI
- 230.2869
- Rent YoY
- ▲ 2.17%
- Metro
- Houston-The Woodlands-Sugar Land, TX
- State GDP YoY
- ▲ 3.95%
- F500 in state
- 110
Industry mix (Fortune 500 HQ in TX)
| Industry | F500 HQs | Revenue |
|---|---|---|
| Energy | 16 | $1,198B |
|
||
| Technology | 5 | $198B |
|
||
| Engineering / Construction | 4 | $72B |
|
||
| Energy Services | 3 | $60B |
|
||
| Utilities | 3 | $41B |
|
||
| Healthcare | 2 | $330B |
|
||
Price history
-22.2% since first listed7 events — show timeline
- 2025-12-14 Relisted — HARMLS
- 2025-12-14 Price Changed $140,000 HARMLS
- 2025-12-12 Listing Removed — HARMLS
- 2025-08-28 Price Changed $160,000 HARMLS
- 2025-06-13 Listed $180,000 HARMLS
- 2019-07-01 Sold (Public Records) — Public Records
- 1988-01-02 Sold (Public Records) — Public Records
Property tax history
+6.7%/yrLatest (2025): $3,618 · -4.3% YoY. Source: county tax records.
Cash-flow waterfall
monthlySold comps — $/sqft
last 12 mo · ≤1 miLoading sold comps…