643 5th Ave Unit 3B · New York, NY
Flood risk 1/10 · Minimal
- FEMA flood zone
- X (unshaded)
- Chance of flooding over 30 yrs
- 0.0%
- Est. flood insurance / yr
- $507 – $1,088
Fire risk 1/10 · Minimal
- Est. fire insurance / yr
- $691 – $1,283
Heat risk 7/10 · Major
- Hot days now (above 99°F)
- 7 days/yr
- Hot days in 30 yrs
- 15 days/yr
Wind risk 6/10 · Moderate
- Chance of severe wind over 30 yrs
- 61.0%
Air-quality risk 4/10 · Minor
- Unhealthy air days now
- 5 days/yr
- Unhealthy air days in 30 yrs
- 7 days/yr
Risk factors via First Street. Map © Google.
Why this score? — see what drove the D- grade
The composite is a weighted blend of 9 inputs, each scored 0–100. Each bar is that input's sub-score; the figure is the points it added to the 100-point composite (weight × sub-score).
- Appreciation +10.0/10.0
- ARV discount +7.5/15.0
- Schools +5.0/10.0
- Cash flow +4.5/30.0
- Rent growth +3.9/5.0
- Livability +3.8/5.0
- Condition / age +2.5/5.0
- 1% rule +0.5/10.0
- DSCR +0.0/10.0
$700,800
🖨 Deal sheet 📄 Offer letter ✓ Due diligence
Listing remarks
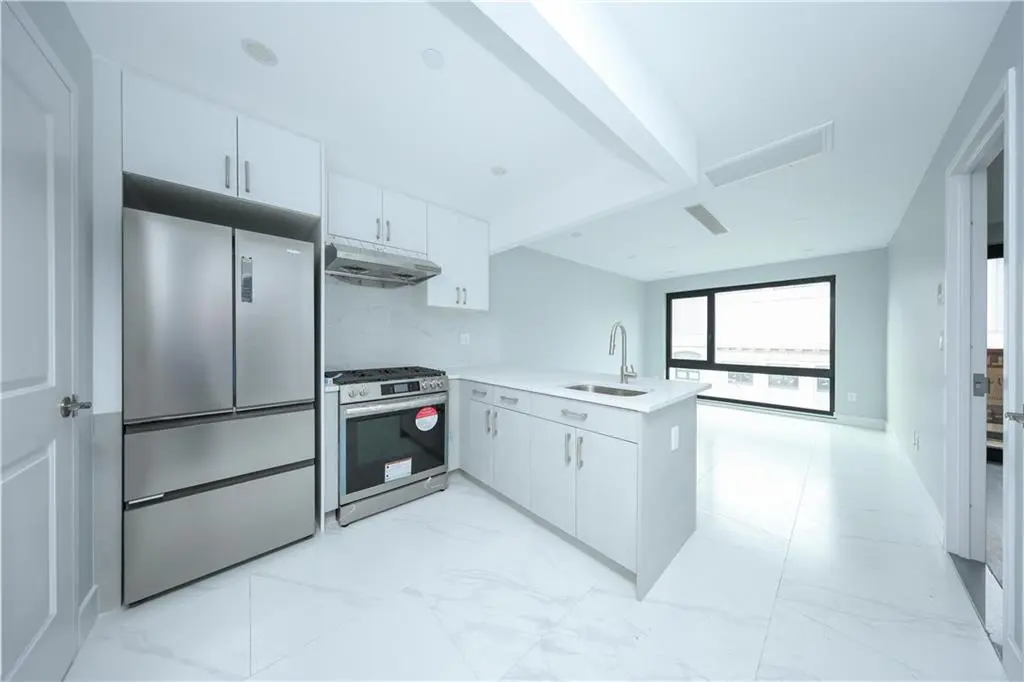
Welcome to this newly built one-bedroom boutique condominium, perfectly positioned in the heart of South Slope/Greenwood Heights—one of Brooklyn’s most vibrant and fast-growing neighborhoods. This thoughtfully crafted residence features a bright, open layout with oversized windows, elegant tile flooring, and a spacious living room ideal for both work and relaxation. The sleek open kitchen is equipped with brand-new appliances, and the in-unit washer/dryer provides unmatched convenience for busy city living. Enter onto your private balcony to enjoy fresh air and open Brooklyn views—your own personal retreat after a long day. Perfect for Manhattan commuters, the location off
Key facts
- Subway access
- Private balcony
- In unit washer dryer
Tags
Property features AI
Finance
- Financial info: Financing options may include cash, bank mortgage, or exchange (20% down payment noted)
- HOA & community: Monthly common maintenance fee of $427; Managed by Wan Long Realty LLC (manager phone available)
Exterior
- Parking: Other parking arrangement
- Utilities: Public water; Public sewer; Other utilities
- Home design: Residential unit on the 3rd floor; Unit number 3B
- Exterior features: Rooftop deck; Exercise room in building
Interior
- Kitchen: Stove; Refrigerator
- Bedrooms: One bedroom on the first floor
- Bathrooms: One full bathroom on the first floor
- Heating & cooling: Central split air conditioning
- Interior features: Central split air conditioning (1 AC unit); Deck; Elevator access
- Laundry & utility: Washer; Dryer
Neighborhood map
What this means for you Summary
Snapshot
- This is a 1-bed/1.0-bath condo listed at $701k.
Deal economics
- At list price, monthly cash flow is $-2k ($-22k/yr) — negative.
- To cash-flow at today's rent, offer at most $441k (37.0% below list).
- To meet the 1% rule (rent ≥ 1% of price), the offer needs to be $386k (44.9% below list).
- Recommended offer: $386k (44.9% below list) — sets the bar for 1% rule.
- Cap rate 3.2% vs local median 2.6% in New York — meaningfully above typical; check what's discounted (condition, days-on-market, listing class) to confirm the premium yield is real.
Location & tenants
- Location reads 75/100 on livability (#268 in NY, #4,188 nationally) — a middle-class / working-renter tenant base. Strengths: amenities A+, commute A+, health & safety A; Watch: crime F, cost of living F.
- Market conditions: Rents rising fast (+5.7%/yr); 248 active listings in the ZIP; 2 comparable units currently listed for rent nearby; high-income renter base; 10,063 units permitted in Kings County in 2024 (9,789 in 5+ unit buildings).
Forward outlook
- In year one you build about $75k of equity ($5k loan paydown + $70k appreciation (10.0% local appreciation)).
- Kings County population projected at +13% by 2050 — modest demand growth; plan on rents tracking national, not racing it.
- By year 2, paydown + projected appreciation supports a ~$120k cash-out refi (75% LTV) — recoverable capital for the next deal without selling this one.
Negotiation context
- It's been on market 15 days — a 2% lower offer ($690k) is reasonable based on typical stale-listing flexibility.
Risks & watch-outs
- Climate carrying-cost: major wind risk, 61% chance of damaging wind over 30y; extreme-heat days projected 7→15/yr by 2055 (HVAC capex compounding) — expect insurance premiums to compound above CPI over the hold.
Questions for the listing agent
- What do current leases actually rent for vs. the listed asking? Can we see a recent rent roll and the last 12 months of T-12 income?
- Any open or pending special assessments — roof, HVAC, plumbing, elevator, façade? What's the per-unit balance and payoff schedule, and is the seller paying it off at close or rolling it to the buyer?
- Is there a deadline driving the sale (1031 exchange, divorce, estate, relocation)? That informs how much negotiation room exists.
- Schools are B-rated — typically a magnet for longer-tenancy family renters. What's the average tenant stay here, and is there a school-zone premium baked into asking?
- Crime grade is F in this area — have there been break-ins, vandalism, or insurance claims at this property in the last 3 years? What carrier currently insures it and at what premium?
- The area grade is low — what's the realistic commute time and amenity access for the typical tenant pool here? Any planned neighborhood developments (good or bad) we should know about?
- What's the average days-on-market for RENTAL listings here right now (not sales)? A rising rental-DOM trend means longer vacancies and softer asking-rent achievability than the comps imply.
- What's the recent tenant-quality profile in this submarket — average credit score on applications, eviction rate, late-payment / NSF rate, and stable-employment percentage? A property-management company in the area should have these aggregated.
- How much new apartment / multifamily construction is in the pipeline within 1–3 miles? Heavy new supply (>2% of stock underway) typically softens rents 12–24 months out; light construction supports rent growth.
Investment metrics
- 1% rule
- 0.55% ✗
- Cap rate
- 3.22%
- Cash-on-cash
- -10.96%
- DSCR
- 0.51
- GRM
- 15.1
CMA / ARV
No comps found within radius.
Projected returns pro-forma
10.0% appreciation · 5.67% rent growth · sell at horizon
- IRR
- 17.2%
- Equity multiple
- 2.42×
- Total profit
- $278,193
- Equity at exit
- $631,336
- IRR
- 16.7%
- Equity multiple
- 5.76×
- Total profit
- $933,217
- Equity at exit
- $1,361,500
Cash invested: $196,224 (down + closing). Projections, not guarantees.
Landlord ↔ Tenant lean methodology
- Overall (CITY)
- 0 Strongly Tenant-Friendly
- State New York
- 15 Strongly Tenant-Friendly · D+10
- County
- — inherits STATE
- City New York
- 0 Strongly Tenant-Friendly · D+34
ZIP-level market 11215
- Home prices YoY
- 2.7%
- Rents YoY
- 5.7%
- Active inventory
- 248
- Price-to-rent
- 15.1×
Monthly cashflow live
- Estimated rent
- $3,861 medium interval (Pro) →
- Mortgage (P&I)
- −$3,675
- Tax est. 1.5%
- −$876 /mo · $10,512/yr
- Insurance
- −$292
- HOA
- −$0
- Vacancy / Maint / Mgmt
- −$811
- Net cashflow
- $-1,793
Break-even live
UW: 25.0% down · 7.5% · 30yr · 1.5% tax · 5.0% vac · 8.0% maint · 8.0% mgmt
Financing live
Cash to close
- Down payment
- $175,200
- Closing costs
- $21,024
- Reserves months
- —
- Total cash needed
- —
Loan-product check · same deal, 3 products live
Conventional
25% down · 7.5% · 30yr
- Down + closing
- —
- Monthly P&I
- —
- Monthly cashflow
- —
- DSCR
- —
- Eligible?
- —
Personal DTI + credit; lowest rate.
DSCR
20% down · 8.5% · 30yr
- Down + closing
- —
- Monthly P&I
- —
- Monthly cashflow
- —
- DSCR
- —
- Eligible?
- —
No personal income docs; deal must DSCR.
Hard money
10% down · 12.0% · 12mo
- Down + closing
- —
- Monthly P&I
- —
- Monthly cashflow
- —
- DSCR
- —
- Eligible?
- —
Short-term bridge; refi at stabilization.
Rent comps 2 comps
| Address | Beds | Baths | Sqft | Rent | $/sqft | DOM | Units | Dist |
|---|---|---|---|---|---|---|---|---|
| 655 Union St #1846 Brooklyn, NY | 1.0–2.0 | 1.0–2.0 | 727 | $5,780 | $7.95 | 2d | 2 | 1.11mi |
| 22 Tehama St Unit 2 Fl Brooklyn, NY | 2.0 | 1.0 | 700 | $2,980 | $4.26 | 24d | 1 | 1.36mi |
HOA detail condo
- Monthly dues
- $0 · $0/yr
- Assessments
- None detected in remarks — confirm with the listing agent.
Listing history 13 events
-
2026-06-18days on market $700,800 Active 15 DOM
-
2026-06-17days on market $700,800 Active 14 DOM
-
2026-06-16days on market $700,800 Active 13 DOM
-
2026-06-15days on market $700,800 Active 12 DOM
-
2026-06-13days on market $700,800 Active 10 DOM
-
2026-06-09days on market $700,800 Active 6 DOM
-
2026-06-08days on market $700,800 Active 5 DOM
-
2026-06-07days on market $700,800 Active 4 DOM
-
2026-06-04days on market $700,800 Active 1 DOM
-
2026-05-31days on market $700,800 Active 190 DOM
-
2026-01-05price $700,800
-
2025-12-03price $746,000
-
2025-11-22$759,200 Active
ⓘ Source: listings_history table (triggers on properties + properties_extension) + one-shot
backfill from property_details.listing_events for pre-trigger history.
Climate risk First Street
- Flood 1/10 Low FEMA zone X (unshaded) · 0% chance over 30 yrs
- Wildfire 1/10 Low
- Heat 7/10 Severe 7 d/yr ≥99°F today · 15 d/yr by 30 yrs out
- Wind 6/10 Major 61% chance of damaging wind over 30 yrs
- Air quality 4/10 Moderate 5 unhealthy d/yr today · 7 by 30 yrs out
Nearby sold comps map
Loading sold comps map…
Walkable amenities ~0.75 mi
Loading nearby amenities…
Taxation est. · year 1
- Rental income
- $46,332
- − Mortgage interest
- −$39,256
- − Property taxes
- −$10,512
- − Insurance
- −$3,504
- − Repairs & maintenance
- −$3,707
- − Management
- −$3,707
- − Depreciation
- −$20,387
- Taxable loss
- −$34,740
- Est. tax savings @ 24.0%
- +$8,337
- After-tax cash flow
- $-13,177/yr
For passive investors: Depreciation is non-cash, so a rental often shows a tax loss while cash-flowing — sheltering income. Rental losses are passive: they offset passive income freely, and up to $25,000/yr can offset ordinary (W-2) income if you actively participate and your MAGI is under $100k (phasing out to $0 by $150k); unused losses carry forward. On sale, claimed depreciation is recaptured at up to 25%, and gains may owe capital-gains tax (a 1031 exchange can defer both). Figures are a year-1 estimate at your 24.0% rate — not tax advice; consult a CPA.
Schools (NCES district)
No district data.
Livability — New York
- Score
- 75/100
- State rank
- #268
- US rank
- #4188
Category grades
Schools grade is shown separately in the Schools card above.
Census & demographics
- Census place
- New York, NY
- County
- Kings County · 2,614,986 people
- City population
- 7,731,280
- Metro
- New York-Newark-Jersey City, NY-NJ-PA
- Population (ZIP)
- 70,441
- Household income
- $185,865
- Rent vs Own
- Severe rent burden
- 2372.0
Population outlook (Kings County) Hauer SSP2
- Today (2025)
- 2,847,441 people
- By 2030
- 2,937,006 · +3.1%
- By 2040
- 3,095,491 · +8.7%
- By 2050
- 3,228,968 · +13.4%
- By 2075
- 3,321,723 · +16.7%
- By 2100
- 3,111,387 · +9.3%
Race, ethnicity, and origin ACS 2023
- Neighborhood character
- Predominantly White (67%)
- Race & ethnicity
- White 67% Hispanic / Latino 15% Two or more races 11% Asian 9% Black 3%
- Hispanic origin (detail)
- Mexican 3% Puerto Rican 3%
- Common ancestry
- Romanian 5% Scotch-Irish 5% Italian 3%
- Foreign-born
- 18% · Canada, China, Jamaica
- Languages at home
- 76% English-only · Spanish 9% Other Indo-European 4% Chinese 2%
Political lean MEDSL · Kings
- 2024 margin
- Solid D (+44.0) · D 72.0% · R 28.0%
- 2008→2024 swing
- -15.5pp toward R · 2008: 59.4pp · 2024: 44.0pp
- All cycles
- 2024: D+44.0 2020: D+54.8 2016: D+61.8 2012: D+63.9 2008: D+59.4
Not yet ingested
- Civics
- —
Market trends
- HPI YoY
- ▲ 11.03%
- Current HPI
- 417.4151
- Rent YoY
- ▲ 5.67%
- Metro
- New York-Newark-Jersey City, NY-NJ-PA
- State GDP YoY
- ▲ 2.60%
- F500 in state
- 92
Industry mix (Fortune 500 HQ in NY)
| Industry | F500 HQs | Revenue |
|---|---|---|
| Financial Services | 10 | $950B |
|
||
| Consumer Goods | 9 | $162B |
|
||
| Insurance | 4 | $225B |
|
||
| Telecommunications | 2 | $144B |
|
||
| Pharmaceuticals | 2 | $112B |
|
||
| Media / Entertainment | 2 | $69B |
|
||
Price history
-7.7% since first listed3 events — show timeline
- 2026-01-05 Price Changed $700,800 BNYMLS
- 2025-12-03 Price Changed $746,000 BNYMLS
- 2025-11-22 Listed $759,200 BNYMLS
Cash-flow waterfall
monthlySold comps — $/sqft
last 12 mo · ≤1 miLoading sold comps…