2001 Mapleton Dr · Callands, VA
Flood risk 1/10 · Minimal
- FEMA flood zone
- X (unshaded)
- Chance of flooding over 30 yrs
- 0.0%
- Est. flood insurance / yr
- $507 – $1,088
Fire risk 4/10 · Minor
- Est. fire insurance / yr
- $666 – $1,236
Heat risk 5/10 · Moderate
- Hot days now (above 101°F)
- 7 days/yr
- Hot days in 30 yrs
- 19 days/yr
Wind risk 3/10 · Minor
- Chance of severe wind over 30 yrs
- 4.0%
Air-quality risk 2/10 · Minimal
- Unhealthy air days now
- 1 days/yr
- Unhealthy air days in 30 yrs
- 1 days/yr
Risk factors via First Street. Map © Google.
Why this score? — see what drove the C+ grade
The composite is a weighted blend of 9 inputs, each scored 0–100. Each bar is that input's sub-score; the figure is the points it added to the 100-point composite (weight × sub-score).
- Cash flow +18.2/30.0
- ARV discount +15.0/15.0
- Appreciation +6.3/10.0
- Schools +6.0/10.0
- DSCR +5.7/10.0
- 1% rule +3.9/10.0
- Rent growth +2.5/5.0
- Livability +2.5/5.0
- Condition / age +2.5/5.0
$110,000
🖨 Deal sheet 📄 Offer letter ✓ Due diligence
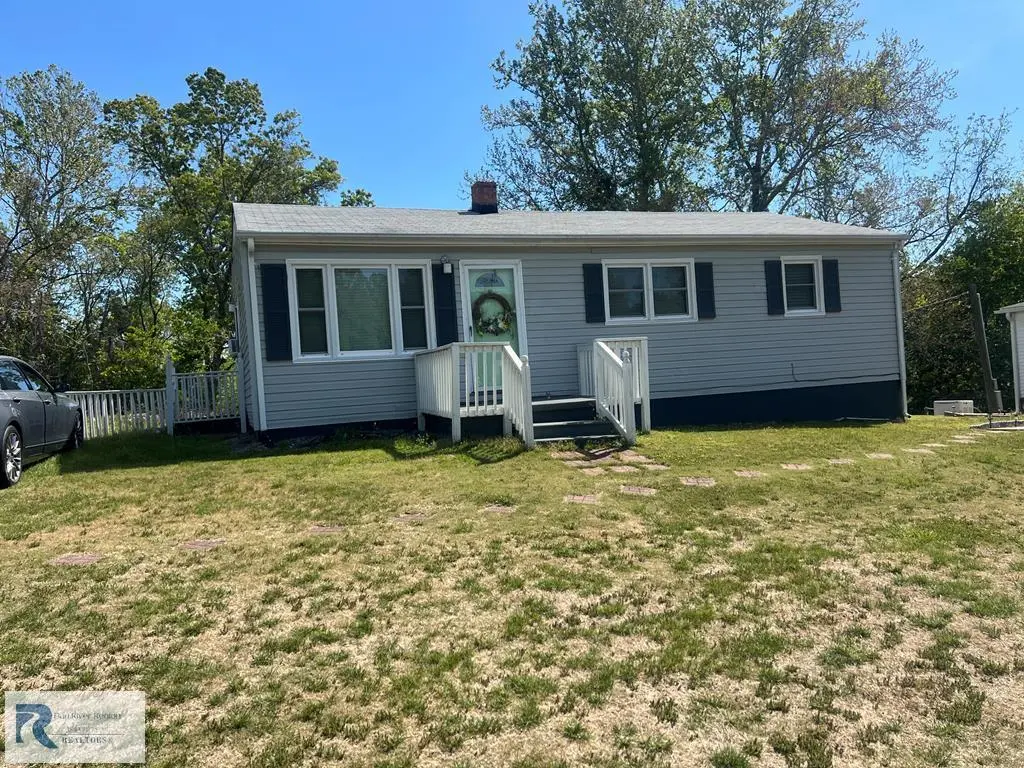
Listing remarks
First time homebuyers and investors come see what the 3 bedroom 1 bath one level home has to offer you. Harwood floors under carpet undated bathroom with walk in shower. The full unfinished basement has alot potential to offer.
Key facts
- Unfinished basement
- Hardwood floors
- Walk in shower
Tags
Property features AI
Finance
- Financial info: Annual tax reported: $575
Exterior
- Parking: No garage
- Security: Smoke detector(s)
- Utilities: Private well water; Septic tank
- Home design: Residential property
- Construction: Vinyl siding exterior; Composition roof; Has basement (unfinished)
- Exterior features: Composition roof; Vinyl siding; Lot approximately 0.65 acre; Zoning: R-1
Interior
- Kitchen: Electric range; Refrigerator
- Bedrooms: 3 bedrooms on the main level
- Flooring: Carpet; Hardwood
- Bathrooms: 1 full bathroom on the main level
- Heating & cooling: Oil heating; Window cooling units
- Interior features: Electric range; Refrigerator; Unfinished basement; Smoke detector(s)
- Laundry & utility: Basement utility space (unfinished)
Neighborhood map
What this means for you Summary
Snapshot
- This is a 3-bed/1.0-bath single-family listed at $110k.
Deal economics
- At list price, monthly cash flow is $99 ($1k/yr) — positive.
- The deal already cash-flows at list — no discount required.
- To meet the 1% rule (rent ≥ 1% of price), the offer needs to be $97k (11.5% below list).
- Recommended offer: $97k (11.5% below list) — sets the bar for 1% rule.
Location & tenants
- Location reads: area grade C — affects rentability + tenant quality, not the cash-flow math above.
- Pittsylvania County Public School District (rural): math 65% / reading 78% proficiency, ranked #22 of 131 in VA (top 17%) — strong family-tenant draw, lease renewals of 3-5y typical.
- Zoned schools: Union Hall Elementary (math 67% / reading 72%, grade A-, #313 of 1,108 statewide, top 32%, 179 students, 81% FRL); Chatham Middle (math 52% / reading 77%, grade A-, #123 of 342 statewide, top 37%, 426 students, 81% FRL); Chatham High (math 77% / reading 87%, grade A, #40 of 319 statewide, top 15%, 659 students, 79% FRL) — zoned schools average 80% FRL vs 47% district-wide (33 pts higher); higher-poverty schools than district average — tighter screening recommended.
- Market conditions: 8 active listings in the ZIP; 72 units permitted in Pittsylvania County in 2024 (0 in 5+ unit buildings).
Forward outlook
- In year one you build about $4k of equity ($761 loan paydown + $3k appreciation (2.6% local appreciation)).
- Pittsylvania County population projected at -22% by 2050 — secular population decline; favor cash flow + early exit over multi-decade hold.
- At projected returns (2.6% appreciation + 3.0% rent growth), your $31k cash investment doubles in ~6 years — after that, you're playing with house money.
- By year 9, paydown + projected appreciation supports a ~$31k cash-out refi (75% LTV) — recoverable capital for the next deal without selling this one.
Negotiation context
- It's been on market 18 days — a 2% lower offer ($108k) is reasonable based on typical stale-listing flexibility.
- 3 sale attempts with the ask held roughly flat each time — persistent listings suggest the price (not the market) is what's stuck; bring a comps-based counter.
Risks & watch-outs
- Climate carrying-cost: extreme-heat days projected 7→19/yr by 2055 (HVAC capex compounding) — expect insurance premiums to compound above CPI over the hold.
Questions for the listing agent
- Built in 1971 — when were the roof, HVAC, electrical panel, plumbing, and water heater last replaced?
- Is there a deadline driving the sale (1031 exchange, divorce, estate, relocation)? That informs how much negotiation room exists.
- What's the average days-on-market for RENTAL listings here right now (not sales)? A rising rental-DOM trend means longer vacancies and softer asking-rent achievability than the comps imply.
- What's the recent tenant-quality profile in this submarket — average credit score on applications, eviction rate, late-payment / NSF rate, and stable-employment percentage? A property-management company in the area should have these aggregated.
- How much new for-sale + rental construction is in the pipeline within 1–3 miles? Heavy new supply typically softens prices + rents 12–24 months out; constrained supply supports both.
Investment metrics
- 1% rule
- 0.89% ✗
- Cap rate
- 7.37%
- Cash-on-cash
- 3.84%
- DSCR
- 1.17
- GRM
- 9.4
CMA / ARV
- ARV (on-the-fly)
- $172,800
- Comps found
- 1
Show comp detail 1 sale within ~0.75 mi
| Address | Dist | Beds/Ba | Sqft | Sold | Price | $/sf | Match |
|---|---|---|---|---|---|---|---|
| 1802 Mapleton Dr | 0.16mi | 3/1.0 | 1,000 (+4%) | 22mo | $180,000 | $180 | 67 |
Match score weights: distance 35% · size 25% · config 20% · recency 20%. Top-matched comps best support the ARV.
Projected returns pro-forma
2.64% appreciation · 3.0% rent growth · sell at horizon
- IRR
- 10.1%
- Equity multiple
- 1.57×
- Total profit
- $17,434
- Equity at exit
- $47,267
- IRR
- 12.6%
- Equity multiple
- 2.81×
- Total profit
- $55,816
- Equity at exit
- $71,183
Cash invested: $30,800 (down + closing). Projections, not guarantees.
Landlord ↔ Tenant lean methodology
- Overall (STATE)
- 55 Moderately Landlord-Leaning
- State Virginia
- 55 Moderately Landlord-Leaning · D+2
- County
- — inherits STATE
- City
- — inherits STATE
ZIP-level market 24530
- Home prices YoY
- 1.8%
- Active inventory
- 8
- Price-to-rent
- 9.4×
Monthly cashflow live
- Estimated rent
- $974 medium interval (Pro) →
- Mortgage (P&I)
- −$577
- Tax from tax record
- −$48 /mo · $575/yr
- Insurance
- −$46
- HOA
- −$0
- Vacancy / Maint / Mgmt
- −$204
- Net cashflow
- $99
Break-even live
UW: 25.0% down · 7.5% · 30yr · 1.5% tax · 5.0% vac · 8.0% maint · 8.0% mgmt
Financing live
Cash to close
- Down payment
- $27,500
- Closing costs
- $3,300
- Reserves months
- —
- Total cash needed
- —
Loan-product check · same deal, 3 products live
Conventional
25% down · 7.5% · 30yr
- Down + closing
- —
- Monthly P&I
- —
- Monthly cashflow
- —
- DSCR
- —
- Eligible?
- —
Personal DTI + credit; lowest rate.
DSCR
20% down · 8.5% · 30yr
- Down + closing
- —
- Monthly P&I
- —
- Monthly cashflow
- —
- DSCR
- —
- Eligible?
- —
No personal income docs; deal must DSCR.
Hard money
10% down · 12.0% · 12mo
- Down + closing
- —
- Monthly P&I
- —
- Monthly cashflow
- —
- DSCR
- —
- Eligible?
- —
Short-term bridge; refi at stabilization.
Listing history 14 events
-
2026-06-19days on market $110,000 Active 18 DOM
-
2026-06-18days on market $110,000 Active 17 DOM
-
2026-06-17days on market $110,000 Active 16 DOM
-
2026-06-16days on market $110,000 Active 15 DOM
-
2026-06-15days on market $110,000 Active 14 DOM
-
2026-06-14days on market $110,000 Active 12 DOM
-
2026-06-13days on market $110,000 Active 11 DOM
-
2026-06-10days on market $110,000 Active 9 DOM
-
2026-06-09days on market $110,000 Active 8 DOM
-
2026-06-08days on market $110,000 Active 7 DOM
-
2026-06-07days on market $110,000 Active 6 DOM
-
2026-06-03days on market $110,000 Active 2 DOM
-
2026-06-02remarks 227-char remark
-
2026-06-02$110,000 Active 1 DOM
ⓘ Source: listings_history table (triggers on properties + properties_extension) + one-shot
backfill from property_details.listing_events for pre-trigger history.
Tax reassessment forecast VA · Resets to sale price
- Current annual tax
- $575 · $48/mo
- Projected year-2 tax
- $902 · $75/mo
- Expected delta
- +$327/yr (+$27/mo · 56.8%)
ⓘ Screening estimate from a state-policy table — verify with the county assessor before closing.
Climate risk First Street
- Flood 1/10 Low FEMA zone X (unshaded) · 0% chance over 30 yrs
- Wildfire 4/10 Moderate
- Heat 5/10 Major 7 d/yr ≥101°F today · 19 d/yr by 30 yrs out
- Wind 3/10 Moderate 4% chance of damaging wind over 30 yrs
- Air quality 2/10 Low 1 unhealthy d/yr today · 1 by 30 yrs out
Nearby sold comps map
Loading sold comps map…
Walkable amenities ~0.75 mi
Loading nearby amenities…
Taxation est. · year 1
- Rental income
- $11,685
- − Mortgage interest
- −$6,162
- − Property taxes
- −$575
- − Insurance
- −$550
- − Repairs & maintenance
- −$935
- − Management
- −$935
- − Depreciation
- −$3,200
- Taxable loss
- −$671
- Est. tax savings @ 24.0%
- +$161
- After-tax cash flow
- $1,345/yr
For passive investors: Depreciation is non-cash, so a rental often shows a tax loss while cash-flowing — sheltering income. Rental losses are passive: they offset passive income freely, and up to $25,000/yr can offset ordinary (W-2) income if you actively participate and your MAGI is under $100k (phasing out to $0 by $150k); unused losses carry forward. On sale, claimed depreciation is recaptured at up to 25%, and gains may owe capital-gains tax (a 1031 exchange can defer both). Figures are a year-1 estimate at your 24.0% rate — not tax advice; consult a CPA.
Schools (NCES district)
- District
- Pittsylvania County Public School District
- NCES district ID
- 5102940
- Math proficiency
- 65% ▼ -22.00%
- Reading proficiency
- 78% ▼ -4.00%
- Median HH income
- $41,672
- Composite
- 59.77/100
- National rank
- #900
- State rank
- #22 of 131 in VA
Livability — Callands
No livability data for this city. (Only ~50 U.S. cities are tracked.)
Census & demographics
- Population (ZIP)
- 749
Population outlook (Pittsylvania County) Hauer SSP2
- Today (2025)
- 58,725 people
- By 2030
- 56,388 · -4.0%
- By 2040
- 51,088 · -13.0%
- By 2050
- 45,875 · -21.9%
- By 2075
- 36,555 · -37.8%
- By 2100
- 28,288 · -51.8%
Race, ethnicity, and origin ACS 2023
- Neighborhood character
- Predominantly White (92%)
- Race & ethnicity
- White 92% Black 7% Hispanic / Latino 1%
- Common ancestry
- Lithuanian 1% Slovak 1%
- Foreign-born
- 0%
- Languages at home
- 99% English-only · Spanish 1%
Political lean MEDSL · Pittsylvania
- 2024 margin
- Solid R (+43.1) · D 28.1% · R 71.3%
- 2008→2024 swing
- -19.1pp toward R · 2008: -24.0pp · 2024: -43.1pp
- All cycles
- 2024: R+43.1 2020: R+39.8 2016: R+39.6 2012: R+27.5 2008: R+24.0
Not yet ingested
- Civics
- —
Market trends
- HPI YoY
- ▲ 2.64%
- Current HPI
- 149.9659
- Rent YoY
- —
- Metro
- —
- State GDP YoY
- ▲ 2.40%
- F500 in state
- 50
Industry mix (Fortune 500 HQ in VA)
| Industry | F500 HQs | Revenue |
|---|---|---|
| Aerospace / Defense | 4 | $236B |
|
||
| Technology / Defense | 3 | $32B |
|
||
| Financial Services | 2 | $176B |
|
||
| Utilities | 2 | $27B |
|
||
| Insurance | 2 | $25B |
|
||
| Technology | 2 | $15B |
|
||
Price history
-14.7% since first listed6 events — show timeline
- 2026-06-01 Listed $110,000 DRRAR
- 2025-11-01 Listed $125,000 DRRAR
- 2025-09-08 Price Changed $116,000 CVRMLS
- 2025-08-26 Price Changed $118,000 CVRMLS
- 2025-07-30 Price Changed $122,000 CVRMLS
- 2025-07-20 Listed $129,000 CVRMLS
Property tax history
+2.6%/yrLatest (2025): $575 · +0.0% YoY. Source: county tax records.
Cash-flow waterfall
monthlySold comps — $/sqft
last 12 mo · ≤1 miLoading sold comps…