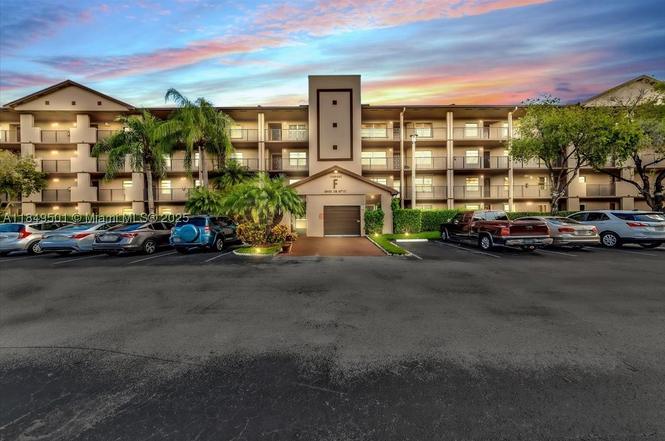
13455 SW 16th Ct Unit 104F · Pembroke Pines, FL
Flood risk 7/10 · Major
- FEMA flood zone
- X (shaded)
- Chance of flooding over 30 yrs
- 0.76%
- Est. flood insurance / yr
- $507 – $1,088
Fire risk 1/10 · Minimal
- Est. fire insurance / yr
- $947 – $1,759
Heat risk 10/10 · Severe
- Hot days now (above 106°F)
- 7 days/yr
- Hot days in 30 yrs
- 29 days/yr
Wind risk 10/10 · Severe
- Chance of severe wind over 30 yrs
- 99.0%
Air-quality risk 2/10 · Minimal
- Unhealthy air days now
- 2 days/yr
- Unhealthy air days in 30 yrs
- 2 days/yr
Risk factors via First Street. Map © Google.
Why this score? — see what drove the B- grade
The composite is a weighted blend of 9 inputs, each scored 0–100. Each bar is that input's sub-score; the figure is the points it added to the 100-point composite (weight × sub-score).
- Cash flow +25.8/30.0
- 1% rule +10.0/10.0
- DSCR +8.6/10.0
- ARV discount +7.5/15.0
- Livability +4.2/5.0
- Schools +4.1/10.0
- Appreciation +4.0/10.0
- Rent growth +2.5/5.0
- Condition / age +2.5/5.0
$119,990
🖨 Deal sheet 📄 Offer letter ✓ Due diligence
Listing remarks
* * * MOTIVATED SELLER * * * LOWEST Priced unit with W/ D in Century Village. Additionally this unit qualifies for 5.625% rate, NO PMI and up to 97% LTV. This charming studio unit currently rented offering ROI from day ONE!!! Offers neutral colors, a serene garden view, accordion shutters for added protection and an amazing garden view. Perfect for enjoying natural light and fresh air. This vibrant 55+ community offers resort-style amenities including golf, clubhouse, pools, fitness center, pickle ball, transportation services and so much more. Conveniently located near Memorial Hospital, Pembroke Lakes Mall, Publix, CB Smith Park, with easy access to dining, shopping, and entertainme
Key facts
- Fitness center
- Clubhouse
- Garden view
Tags
Property features AI
Finance
- Other: Association-maintained heated pool
- Financial info: Pets not allowed
- HOA & community: Monthly association fee (listed values); Association covers amenities, common area maintenance, cable TV, internet, grounds maintenance, pools, sewer, and trash; Community amenities include clubhouse, fitness center, billiard room, bike storage, pickleball, tennis courts, pool and spa/hot tub, trails, transportation service, and elevators; Senior community
Exterior
- Parking: Guest parking available; One assigned space
- Security: Gated/secured complex features; On-site security guard
- Utilities: Cable available; Association provides sewer and trash (see HOA); Electric service (for heating/cooling)
- Home design: Condominium (attached property); Faces south; Entry level: 1; Total stories in building: 4
- Construction: Block construction; Resale property
- Exterior features: Balcony (screened); Storm/security shutters; Exterior lighting; Complex is fenced; Security guard on site; Association heated pool
Interior
- Kitchen: Electric range; Microwave; Refrigerator; Dishwasher not listed
- Bedrooms: Bedroom located on main level
- Flooring: Carpet; Tile
- Bathrooms: 1 full bathroom
- Heating & cooling: Central heating (electric); Central air conditioning (electric); Ceiling fan(s)
- Interior features: Blinds on windows; First floor entry; Living/dining room; Main living area on entry level; Tub with shower; Walk-in closet(s)
- Laundry & utility: Washer and dryer included
Neighborhood map
What this means for you Summary
Snapshot
- This is a 1-bed/1.0-bath condo listed at $120k.
Deal economics
- At list price, monthly cash flow is $224 ($3k/yr) — positive.
- The deal already cash-flows at list — no discount required.
- Meets the 1% rule at list price ($2k rent vs $120k).
- Recommended offer: $106k (12.0% below list) — sets the bar for market timing.
- Cap rate 9.2% vs local median 4.0% in Pembroke Pines — top-decile yield for the area; either an underpriced asset or a hidden risk that comps aren't pricing in. Stress-test before assuming the spread holds.
Location & tenants
- Location reads 83/100 on livability (#54 in FL, #933 nationally) — a professional / high-income tenant draw. Strengths: housing A+, health & safety A+, schools A-; Watch: amenities D+, cost of living D+.
- Broward (suburban): math 42% / reading 53% proficiency, ranked #46 of 73 in FL (top 63%) — families likely to look elsewhere, expect single-tenant / working-renter base with shorter leases.
- Market conditions: Rents soft (-0.2%/yr); 543 active listings in the ZIP; 23 comparable units currently listed for rent nearby; rentals leasing fast (median 11d on market — plan ~1-2 weeks tenant-placement turnaround); solid renter incomes; 2,111 units permitted in Broward County in 2024 (1,265 in 5+ unit buildings).
Forward outlook
- Local home prices are declining (-2.0%/yr); year-one equity from $830 of loan paydown is wiped out by about $2k of value loss. Plan a longer hold.
- Broward County population projected at +34% by 2050 — long-run rental-demand tailwind backs the buy-and-hold thesis.
Negotiation context
- It's been on market 317 days — a 12% lower offer ($106k) is reasonable based on typical stale-listing flexibility.
- Current owner paid $86k; 39% above their basis — modest negotiation headroom, anchor on the comps not their cost.
Risks & watch-outs
- Watch-outs: flood insurance adds $66/mo.
- Climate carrying-cost: major flood risk; severe wind risk, 99% chance of damaging wind over 30y; extreme-heat days projected 7→29/yr by 2055 (HVAC capex compounding) — expect insurance premiums to compound above CPI over the hold.
Questions for the listing agent
- It's been on market 317 days. Have you received any prior offers? Is the seller open to a 12% concession, seller financing, or rate buy-down credit?
- What's the actual annual flood-insurance premium (NFIP or private), and is the property in a SFHA with mandatory coverage?
- What does the HOA fee cover, when was the last increase, and are there any pending special assessments or reserve-fund shortfalls?
- Any open or pending special assessments — roof, HVAC, plumbing, elevator, façade? What's the per-unit balance and payoff schedule, and is the seller paying it off at close or rolling it to the buyer?
- Why hasn't it sold? Are there any deal-killer items the seller is aware of (foundation, flood, title, zoning, code violations)?
- Is there a deadline driving the sale (1031 exchange, divorce, estate, relocation)? That informs how much negotiation room exists.
- Schools are A-rated — typically a magnet for longer-tenancy family renters. What's the average tenant stay here, and is there a school-zone premium baked into asking?
- What's the average days-on-market for RENTAL listings here right now (not sales)? A rising rental-DOM trend means longer vacancies and softer asking-rent achievability than the comps imply.
- What's the recent tenant-quality profile in this submarket — average credit score on applications, eviction rate, late-payment / NSF rate, and stable-employment percentage? A property-management company in the area should have these aggregated.
- How much new apartment / multifamily construction is in the pipeline within 1–3 miles? Heavy new supply (>2% of stock underway) typically softens rents 12–24 months out; light construction supports rent growth.
Investment metrics
- 1% rule
- 1.53% ✓
- Cap rate
- 9.20%
- Cash-on-cash
- 10.37%
- DSCR
- 1.46
- GRM
- 5.5
CMA / ARV
No comps found within radius.
Projected returns pro-forma
-2.01% appreciation · 0.0% rent growth · sell at horizon
- IRR
- -4.0%
- Equity multiple
- 0.84×
- Total profit
- $-5,253
- Equity at exit
- $23,235
- IRR
- -0.6%
- Equity multiple
- 0.96×
- Total profit
- $-1,381
- Equity at exit
- $19,791
Cash invested: $33,597 (down + closing). Projections, not guarantees.
Landlord ↔ Tenant lean methodology
- Overall (STATE)
- 87 Strongly Landlord-Friendly
- State Florida
- 87 Strongly Landlord-Friendly · R+3
- County
- — inherits STATE
- City
- — inherits STATE
ZIP-level market 33027
- Home prices YoY
- -0.6%
- Rents YoY
- -0.2%
- Active inventory
- 543
- Price-to-rent
- 5.5×
Monthly cashflow live
- Estimated rent
- $1,832 high interval (Pro) →
- Mortgage (P&I)
- −$629
- Tax from tax record
- −$207 /mo · $2,481/yr
- Insurance
- −$50
- Flood insurance flood zone
- −$66 /mo · $798/yr
- HOA
- −$271
- Vacancy / Maint / Mgmt
- −$385
- Net cashflow
- $224
Break-even live
UW: 25.0% down · 7.5% · 30yr · 1.5% tax · 5.0% vac · 8.0% maint · 8.0% mgmt
Financing live
Cash to close
- Down payment
- $29,998
- Closing costs
- $3,600
- Reserves months
- —
- Total cash needed
- —
Loan-product check · same deal, 3 products live
Conventional
25% down · 7.5% · 30yr
- Down + closing
- —
- Monthly P&I
- —
- Monthly cashflow
- —
- DSCR
- —
- Eligible?
- —
Personal DTI + credit; lowest rate.
DSCR
20% down · 8.5% · 30yr
- Down + closing
- —
- Monthly P&I
- —
- Monthly cashflow
- —
- DSCR
- —
- Eligible?
- —
No personal income docs; deal must DSCR.
Hard money
10% down · 12.0% · 12mo
- Down + closing
- —
- Monthly P&I
- —
- Monthly cashflow
- —
- DSCR
- —
- Eligible?
- —
Short-term bridge; refi at stabilization.
Rent comps 23 comps
| Address | Beds | Baths | Sqft | Rent | $/sqft | DOM | Units | Dist |
|---|---|---|---|---|---|---|---|---|
| 1551 SW 135th Ter Pembroke Pines, FL | 1.0–2.0 | 1.5 | 752 | $1,650 | $2.19 | 13d | 2 | 0.08mi |
| 13475 SW 9th St Unit 407A Pembroke Pines, FL | 1.0 | 1.0 | 685 | $1,550 | $2.26 | 24d | 1 | 0.43mi |
| 1300 SW 130th Ave Pembroke Pines, FL | 1.0–2.0 | 1.0–2.0 | 885 | $1,700 | $1.92 | 24d | 2 | 0.49mi |
| 800 SW 137th Ave Unit G404 Pembroke Pines, FL | 1.0 | 1.0 | 540 | $1,590 | $2.94 | 24d | 1 | 0.51mi |
| 500 SW 145th Ave Pembroke Pines, FL | 1.0–3.0 | 1.0–2.0 | 1044 | $2,327 | $2.23 | 1d | 21 | 0.82mi |
| 1400 SW 124th Ter Unit 111Q Pembroke Pines, FL | — | 1.0 | 514 | $1,450 | $2.82 | 14d | 1 | 0.84mi |
| 1400 SW 124th Ter Pembroke Pines, FL | — | 1.0 | 514 | $1,500 | $2.92 | 3d | 3 | 0.84mi |
| 1400 SW 124th Ter Pembroke Pines, FL | — | 1.0 | 514 | $1,450 | $2.82 | 1d | 3 | 0.84mi |
| 1400 SW 124th Ter Pembroke Pines, FL | — | 1.0 | 514 | $1,525 | $2.97 | 5d | 2 | 0.84mi |
| 151 SW 135th Ter Unit 108T Pembroke Pines, FL | 1.0 | 1.0 | 685 | $1,600 | $2.34 | 2d | 1 | 0.86mi |
| 12148 Saint Andrews Pl #102 Miramar, FL | 1.0 | 1.0 | 618 | $1,925 | $3.11 | 7d | 1 | 1.00mi |
| 12148 Saint Andrews Pl #101 Miramar, FL | 1.0 | 1.0 | 618 | $1,800 | $2.91 | 17d | 1 | 1.00mi |
| 12172 Saint Andrews Pl #211 Miramar, FL | 1.0 | 1.0 | 618 | $1,950 | $3.16 | 14d | 1 | 1.05mi |
| 2061 Renaissance Blvd #107 Miramar, FL | 1.0 | 1.0 | 700 | $1,925 | $2.75 | 7d | 1 | 1.06mi |
| 12136 Saint Andrews Pl #103 Miramar, FL | 1.0 | 1.0 | 600 | $1,750 | $2.92 | 19d | 1 | 1.08mi |
| 2051 Renaissance Blvd Miramar, FL | 1.0–3.0 | 1.0–2.0 | 895 | $1,750 | $1.96 | 7d | 2 | 1.10mi |
| 2123 Renaissance Blvd #201 Miramar, FL | 1.0 | 1.0 | 700 | $2,100 | $3.00 | 5d | 1 | 1.11mi |
| 2113 Renaissance Blvd Miramar, FL | 1.0–2.0 | 1.0–2.0 | 833 | $2,000 | $2.40 | 24d | 2 | 1.14mi |
| 12118 Saint Andrews Pl Miramar, FL | 1.0–2.0 | 1.0–2.0 | 841 | $1,800 | $2.14 | 3d | 3 | 1.16mi |
| 2021 Renaissance Blvd Miramar, FL | 1.0–2.0 | 1.0–2.0 | 828 | $2,000 | $2.42 | 14d | 2 | 1.16mi |
| 2021 Renaissance Blvd #201 Miramar, FL | 1.0 | 1.0 | 690 | $2,000 | $2.90 | 10d | 1 | 1.17mi |
| 2103 Renaissance Blvd Miramar, FL | 1.0–2.0 | 1.0–2.0 | 833 | $1,980 | $2.38 | 22d | 2 | 1.18mi |
| 3155 SW 147th Ter Miramar, FL | 3.0 | 1.0–2.0 | 1001 | $2,784 | $2.78 | 1d | 25 | 1.41mi |
HOA detail condo
- Monthly dues
- $271 · $3,252/yr
- Likely covers
- poolgym
- Assessments
- None detected in remarks — confirm with the listing agent.
Listing history 19 events
-
2026-06-18days on market $119,990 Active 317 DOM
-
2026-06-17days on market $119,990 Active 316 DOM
-
2026-06-16days on market $119,990 Active 315 DOM
-
2026-06-15days on market $119,990 Active 314 DOM
-
2026-06-13days on market $119,990 Active 312 DOM
-
2026-06-09days on market $119,990 Active 308 DOM
-
2026-06-07days on market $119,990 Active 306 DOM
-
2026-06-04days on market $119,990 Active 303 DOM
-
2026-06-03days on market $119,990 Active 302 DOM
-
2026-06-02days on market $119,990 Active 301 DOM
-
2026-06-01days on market $119,990 Active 300 DOM
-
2026-05-31days on market $119,990 Active 299 DOM
-
2025-10-29price $119,990
-
2025-09-25price $129,000
-
2025-08-05$129,900 Active
-
2023-09-21soldstatus $86,200
-
2006-10-31soldstatus $65,000
-
2000-09-21soldstatus $29,000
-
1993-01-01soldstatus $38,900
ⓘ Source: listings_history table (triggers on properties + properties_extension) + one-shot
backfill from property_details.listing_events for pre-trigger history.
Tax reassessment forecast FL · Resets to sale price
- Current annual tax
- $2,481 · $207/mo
- Projected year-2 tax
- $2,481 · $207/mo
- Expected delta
- $0/yr ($0/mo · 0.0%)
ⓘ Screening estimate from a state-policy table — verify with the county assessor before closing.
Climate risk First Street
- Flood 7/10 Severe FEMA zone X (shaded) · 76% chance over 30 yrs
- Wildfire 1/10 Low
- Heat 10/10 Extreme 7 d/yr ≥106°F today · 29 d/yr by 30 yrs out
- Wind 10/10 Extreme 99% chance of damaging wind over 30 yrs
- Air quality 2/10 Low 2 unhealthy d/yr today · 2 by 30 yrs out
Nearby sold comps map
Loading sold comps map…
Walkable amenities ~0.75 mi
Loading nearby amenities…
Taxation est. · year 1
- Rental income
- $21,986
- − Mortgage interest
- −$6,721
- − Property taxes
- −$2,481
- − Insurance
- −$1,397
- − Repairs & maintenance
- −$1,759
- − Management
- −$1,759
- − HOA
- −$3,252
- − Depreciation
- −$3,491
- Taxable income
- $1,126
- Est. tax owed @ 24.0%
- −$270
- After-tax cash flow
- $2,418/yr
For passive investors: Depreciation is non-cash, so a rental often shows a tax loss while cash-flowing — sheltering income. Rental losses are passive: they offset passive income freely, and up to $25,000/yr can offset ordinary (W-2) income if you actively participate and your MAGI is under $100k (phasing out to $0 by $150k); unused losses carry forward. On sale, claimed depreciation is recaptured at up to 25%, and gains may owe capital-gains tax (a 1031 exchange can defer both). Figures are a year-1 estimate at your 24.0% rate — not tax advice; consult a CPA.
Schools (NCES district)
- District
- Broward
- NCES district ID
- 1200180
- Math proficiency
- 42% ▼ -18.00%
- Reading proficiency
- 53% ▼ -5.00%
- Median HH income
- $52,139
- Composite
- 40.88/100
- National rank
- #3621
- State rank
- #46 of 73 in FL
Livability — Pembroke Pines
- Score
- 83/100
- State rank
- #54
- US rank
- #933
Category grades
Schools grade is shown separately in the Schools card above.
Census & demographics
- Census place
- Pembroke Pines, FL
- County
- Broward County · 1,963,430 people
- City population
- 180,224
- Metro
- Miami-Fort Lauderdale-Pompano Beach, FL
- Population (ZIP)
- 65,116
- Household income
- $76,561
- Rent vs Own
- Severe rent burden
- 1728.0
Population outlook (Broward County) Hauer SSP2
- Today (2025)
- 2,207,033 people
- By 2030
- 2,360,704 · +7.0%
- By 2040
- 2,661,208 · +20.6%
- By 2050
- 2,946,698 · +33.5%
- By 2075
- 3,602,273 · +63.2%
- By 2100
- 3,970,984 · +79.9%
Race, ethnicity, and origin ACS 2023
- Neighborhood character
- Diverse neighborhood (Simpson 0.65)
- Race & ethnicity
- Hispanic / Latino 52% Two or more races 23% Black 22% White 16% Asian 6%
- Hispanic origin (detail)
- Puerto Rican 6% Cuban 19% Dominican 3%
- Common ancestry
- Hispanic 6% Romanian 1% Scotch-Irish 1%
- Foreign-born
- 47% · Canada, Jamaica, Vietnam
- Languages at home
- 40% English-only · Spanish 47% French/Haitian/Cajun 5% Other Indo-European 2%
Political lean MEDSL · Broward
- 2024 margin
- D (+17.0) · D 58.0% · R 41.0%
- 2008→2024 swing
- -17.8pp toward R · 2008: 34.7pp · 2024: 17.0pp
- All cycles
- 2024: D+17.0 2020: D+29.8 2016: D+35.0 2012: D+34.9 2008: D+34.7
Not yet ingested
- Civics
- —
Market trends
- HPI YoY
- ▼ -2.01%
- Current HPI
- 359.5973
- Rent YoY
- ▼ -0.20%
- Metro
- Miami-Fort Lauderdale-Pompano Beach, FL
- State GDP YoY
- ▲ 3.28%
- F500 in state
- 36
Industry mix (Fortune 500 HQ in FL)
| Industry | F500 HQs | Revenue |
|---|---|---|
| Industrial Technology | 2 | $29B |
|
||
| Insurance | 2 | $17B |
|
||
| Retail | 1 | $60B |
|
||
| Technology Distribution | 1 | $58B |
|
||
| Homebuilding | 1 | $35B |
|
||
| Technology Manufacturing | 1 | $35B |
|
||
Price history
+208.5% since first listed7 events — show timeline
- 2025-10-29 Price Changed $119,990 MARMLS
- 2025-09-25 Price Changed $129,000 MARMLS
- 2025-08-05 Listed $129,900 MARMLS
- 2023-09-21 Sold (Public Records) $86,200 Public Records
- 2006-10-31 Sold (Public Records) $65,000 Public Records
- 2000-09-21 Sold (Public Records) $29,000 Public Records
- 1993-01-01 Sold (Public Records) $38,900 Public Records
Property tax history
+6.7%/yrLatest (2025): $2,481 · -11.3% YoY. Source: county tax records.
Cash-flow waterfall
monthlySold comps — $/sqft
last 12 mo · ≤1 miLoading sold comps…