 Multi-family
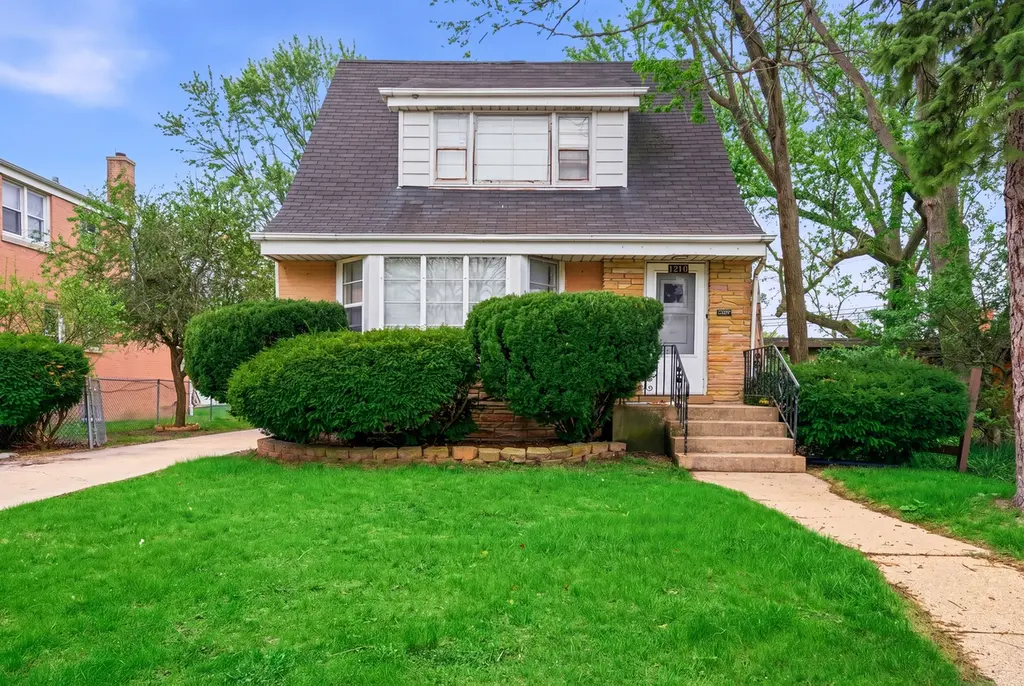
1216 N Northwest Hwy · Park Ridge, IL
Flood risk 1/10 · Minimal
- FEMA flood zone
- X (unshaded)
- Chance of flooding over 30 yrs
- 0.0%
- Est. flood insurance / yr
- $473 – $860
Fire risk 1/10 · Minimal
- Est. fire insurance / yr
- $804 – $1,492
Heat risk 3/10 · Minor
- Hot days now (above 99°F)
- 7 days/yr
- Hot days in 30 yrs
- 14 days/yr
Wind risk 2/10 · Minimal
- Chance of severe wind over 30 yrs
- 0.0%
Air-quality risk 4/10 · Minor
- Unhealthy air days now
- 5 days/yr
- Unhealthy air days in 30 yrs
- 7 days/yr
Risk factors via First Street. Map © Google.
Why this score? — see what drove the D grade
The composite is a weighted blend of 9 inputs, each scored 0–100. Each bar is that input's sub-score; the figure is the points it added to the 100-point composite (weight × sub-score).
- Cash flow +13.3/30.0
- ARV discount +7.5/15.0
- 1% rule +4.5/10.0
- Livability +4.4/5.0
- DSCR +4.0/10.0
- Schools +3.4/10.0
- Rent growth +2.5/5.0
- Condition / age +2.5/5.0
- Appreciation +0.0/10.0
$500,000
🖨 Deal sheet (PDF) 📄 Offer letter ✓ Due diligence
Multi-family units
County records classify this as Multi-Family (2-4 Unit). Listing-text estimate: 1 unit. estimate disagrees with records
Listing remarks
Rare opportunity in sought-after Park Ridge, this solid 2-unit property is ideal for investors or owner-occupants looking for rental income with future flexibility to convert back to a single-family home. Both units are currently occupied and feature hardwood flooring throughout. The first-floor unit offers approximately 750 sq ft with 5 rooms plus a sunroom, including 2 bedrooms, 1 bath, kitchen, dining room and living room. The second-floor unit provides approximately 600 sq ft with 2 bedrooms, 1 bath, an eat-in kitchen, and living room. Each unit includes one garage space and driveway parking. The property also features a full basement with coin laundry and ample storage, a fenced backya
Key facts
- Hardwood flooring
- Coin laundry
- 2 unit property
Tags
Property features AI
Finance
- Other: Holds earnest money; Possession at closing
- Financial info: Special service area: No; Unit 1 current rent: $1,250 (lease through March 1, 2027); Unit 2 current rent: $1,350 (month-to-month); Building has 2 rental units
Exterior
- Parking: Detached garage providing two garage spaces (two total parking spaces)
- Utilities: Public water; Public sewer
- Home design: Two- to four-unit building (2 units); Fee simple ownership; Built before 1978
- Construction: Brick construction; Asphalt roof; Concrete perimeter foundation; Estimated age 71–80 years
- Exterior features: Lot under 0.25 acre; Lot size per county records
Interior
- Kitchen: Each unit includes a stove and refrigerator
- Bedrooms: Four bedrooms total; Unit 1 (first floor): 2 bedrooms; Unit 2 (second floor): 2 bedrooms
- Flooring: Hardwood floors in both units
- Bathrooms: Two full bathrooms (one in each unit)
- Heating & cooling: Baseboard heating
- Interior features: Nine total rooms; Partially finished full basement
- Laundry & utility: Tenant pays electric for each unit
Neighborhood map
What this means for you Summary
Snapshot
- This is a 4-bed/2.5-bath multifamily listed at $500k.
Deal economics
- At list price, monthly cash flow is $2 ($29/yr) — positive.
- The deal already cash-flows at list — no discount required.
- To meet the 1% rule (rent ≥ 1% of price), the offer needs to be $473k (5.4% below list).
- Recommended offer: $473k (5.4% below list) — sets the bar for 1% rule.
- Cap rate 6.3% vs local median 2.6% in Park Ridge — top-decile yield for the area; either an underpriced asset or a hidden risk that comps aren't pricing in. Stress-test before assuming the spread holds.
Location & tenants
- Location reads 88/100 on livability (#10 in IL, #248 nationally) — a professional / high-income tenant draw. Strengths: crime A+, commute A+, employment A+; Watch: cost of living F.
- Maine Township Hsd 207 (suburban): math 34% / reading 39% proficiency, ranked #143 of 620 in IL (top 23%) — families likely to look elsewhere, expect single-tenant / working-renter base with shorter leases.
- Zoned schools: Franklin Elementary School (math 41% / reading 52%, grade D-, #247 of 2,056 statewide, top 12%, 551 students, 0% FRL); Emerson Middle School (math 39% / reading 45%, grade D-, #116 of 665 statewide, top 19%, 880 students, 0% FRL); Maine South High School (math 52% / reading 57%, grade C-, #28 of 693 statewide, top 4%, 2,495 students, 0% FRL).
- Market conditions: 108 active listings in the ZIP; 10 comparable units currently listed for rent nearby; rentals at typical pace (median 19d on market — plan ~3-4 weeks tenant-placement turnaround); high-income renter base; 6,272 units permitted in Cook County in 2024 (4,658 in 5+ unit buildings).
- This rent runs 40% of the median local income ($143k/yr) — at the standard rent-burdened threshold; future hikes will face affordability resistance.
Forward outlook
- Local home prices are declining (-3.0%/yr); year-one equity from $3k of loan paydown is wiped out by about $15k of value loss. Plan a longer hold.
Negotiation context
- It's been on market 19 days — a 2% lower offer ($492k) is reasonable based on typical stale-listing flexibility.
- Current owner paid $126k; list at $500k implies a 298% gain — meaningful room to come down on a strong offer.
Risks & watch-outs
- Watch-outs: built in 1954 — expect roof / HVAC / electrical / plumbing capex.
Questions for the listing agent
- Built in 1954 — when were the roof, HVAC, electrical panel, plumbing, and water heater last replaced?
- Is there a deadline driving the sale (1031 exchange, divorce, estate, relocation)? That informs how much negotiation room exists.
- Schools are A-rated — typically a magnet for longer-tenancy family renters. What's the average tenant stay here, and is there a school-zone premium baked into asking?
- The area grade is low — what's the realistic commute time and amenity access for the typical tenant pool here? Any planned neighborhood developments (good or bad) we should know about?
- What's the average days-on-market for RENTAL listings here right now (not sales)? A rising rental-DOM trend means longer vacancies and softer asking-rent achievability than the comps imply.
- What's the recent tenant-quality profile in this submarket — average credit score on applications, eviction rate, late-payment / NSF rate, and stable-employment percentage? A property-management company in the area should have these aggregated.
- How much new apartment / multifamily construction is in the pipeline within 1–3 miles? Heavy new supply (>2% of stock underway) typically softens rents 12–24 months out; light construction supports rent growth.
Investment metrics
- 1% rule
- 0.95% ✗
- Cap rate
- 6.30%
- Cash-on-cash
- 0.02%
- DSCR
- 1.00
- GRM
- 8.8
CMA / ARV
No comps found within radius.
Projected returns pro-forma
-3.0% appreciation · 3.0% rent growth · sell at horizon
- IRR
- -16.2%
- Equity multiple
- 0.42×
- Total profit
- $-80,623
- Equity at exit
- $74,552
- IRR
- -7.8%
- Equity multiple
- 0.51×
- Total profit
- $-69,017
- Equity at exit
- $43,231
Cash invested: $140,000 (down + closing). Projections, not guarantees.
Landlord ↔ Tenant lean methodology
- Overall (STATE)
- 43 Moderately Tenant-Leaning
- State Illinois
- 43 Moderately Tenant-Leaning · D+7
- County
- — inherits STATE
- City
- — inherits STATE
ZIP-level market 60068
- Active inventory
- 108
- Price-to-rent
- 17.6×
Monthly cashflow live
- Estimated rent
- $4,731 high interval (Pro) →
- Mortgage (P&I)
- −$2,622
- Tax from tax record
- −$905 /mo · $10,856/yr
- Insurance
- −$208
- HOA
- −$0
- Vacancy / Maint / Mgmt
- −$994
- Net cashflow
- $2
Break-even live
Sensitivity live
| Price | -10% $285 | -5% $144 | +0% $2 | +5% $-139 | +10% $-281 |
|---|---|---|---|---|---|
| Rent | -10% $-371 | -5% $-184 | +0% $2 | +5% $189 | +10% $376 |
| Rate | -1.0pp $254 | -0.5pp $130 | base $2 | +0.5pp $-127 | +1.0pp $-259 |
2-unit breakdown (identical units grouped — click to expand)
| Units | Beds | Baths | Est. rent |
|---|---|---|---|
| 2× units | 2 | 1 | $4,732 |
| #1 | 2 | 1 | $2,366 |
| #2 | 2 | 1 | $2,366 |
| Total (2 units) | $4,731 | ||
UW: 25.0% down · 7.5% · 30yr · 1.5% tax · 5.0% vac · 8.0% maint · 8.0% mgmt
Financing live
Cash to close
- Down payment
- $125,000
- Closing costs
- $15,000
- Reserves months
- —
- Total cash needed
- —
Loan-product check · same deal, 3 products live
Conventional
25% down · 7.5% · 30yr
- Down + closing
- —
- Monthly P&I
- —
- Monthly cashflow
- —
- DSCR
- —
- Eligible?
- —
Personal DTI + credit; lowest rate.
DSCR
20% down · 8.5% · 30yr
- Down + closing
- —
- Monthly P&I
- —
- Monthly cashflow
- —
- DSCR
- —
- Eligible?
- —
No personal income docs; deal must DSCR.
Hard money
10% down · 12.0% · 12mo
- Down + closing
- —
- Monthly P&I
- —
- Monthly cashflow
- —
- DSCR
- —
- Eligible?
- —
Short-term bridge; refi at stabilization.
Rent comps 10 comps
| Address | Beds | Baths | Sqft | Rent | $/sqft | DOM | Units | Dist |
|---|---|---|---|---|---|---|---|---|
| 1316 N Northwest Hwy Unit 2 Park Ridge, IL | 3.0 | 2.0 | 1400 | $2,950 | $2.11 | 26d | 1 | 0.20mi |
| 1108 Fortuna Ave Unit 2 Park Ridge, IL | 3.0 | 1.5 | 1850 | $3,500 | $1.89 | 26d | 1 | 0.25mi |
| 1108 Fortuna Ave Unit 2 Park Ridge, IL | 3.0 | 1.5 | 1850 | $3,500 | $1.89 | 20d | 1 | 0.25mi |
| 1108 Fortuna Ave Unit 1 Park Ridge, IL | 3.0 | 1.5 | 1850 | $3,500 | $1.89 | 6d | 1 | 0.25mi |
| 1108 Fortuna Ave Unit 2 Park Ridge, IL | 3.0 | 1.5 | 1850 | $3,500 | $1.89 | 12d | 1 | 0.25mi |
| 851 N Northwest Hwy Unit 2 Park Ridge, IL | 3.0 | 2.0 | 2428 | $2,795 | $1.15 | 8d | 1 | 0.68mi |
| 8841 Chester Ave Unit 3 Niles, IL | 3.0 | 2.0 | 1600 | $2,700 | $1.69 | 12d | 1 | 1.30mi |
| 9268 Barberry Ln Des Plaines, IL | 3.0 | 2.5 | 1568 | $3,000 | $1.91 | 18d | 1 | 1.32mi |
| 9275 Hamlin Ave Des Plaines, IL | 3.0 | 1.5 | 2000 | $2,550 | $1.27 | 1d | 1 | 1.40mi |
| 8418 W Oak Ave Unit 3 Niles, IL | 3.0 | 1.5 | 1900 | $2,450 | $1.29 | 26d | 1 | 1.41mi |
Listing history 18 events
-
2026-06-21days on market $500,000 Active 19 DOM
-
2026-06-18days on market $500,000 Active 16 DOM
-
2026-06-17statusdays on market $500,000 Active 15 DOM
-
2026-06-16days on market $500,000 Contingent - Continue to Show 14 DOM
-
2026-06-15days on market $500,000 Contingent - Continue to Show 13 DOM
-
2026-06-13days on market $500,000 Contingent - Continue to Show 11 DOM
-
2026-06-13statusdays on market $500,000 Contingent - Continue to Show 10 DOM
-
2026-06-09days on market $500,000 Active 7 DOM
-
2026-06-08days on market $500,000 Active 6 DOM
-
2026-06-07days on market $500,000 Active 5 DOM
-
2026-06-04days on market $500,000 Active 2 DOM
-
2026-06-02pricedays on market $500,000 Active 1 DOM
-
2026-06-01days on market $545,000 Active 47 DOM
-
2026-05-31days on market $545,000 Active 46 DOM
-
2026-04-15$545,000 Active
-
1985-11-05soldstatus $125,500
-
1985-10-01soldstatus $125,250
-
1982-06-10soldstatus $115,000
ⓘ Source: listings_history table (triggers on properties + properties_extension) + one-shot
backfill from property_details.listing_events for pre-trigger history.
Tax reassessment forecast IL · Partial reset (capped growth)
- Current annual tax
- $10,856 · $905/mo
- Projected year-2 tax
- $11,103 · $925/mo
- Expected delta
- +$247/yr (+$21/mo · 2.3%)
ⓘ Screening estimate from a state-policy table — verify with the county assessor before closing.
Climate risk First Street
- Flood 1/10 Low FEMA zone X (unshaded) · 0% chance over 30 yrs
- Wildfire 1/10 Low
- Heat 3/10 Moderate 7 d/yr ≥99°F today · 14 d/yr by 30 yrs out
- Wind 2/10 Low 0% chance of damaging wind over 30 yrs
- Air quality 4/10 Moderate 5 unhealthy d/yr today · 7 by 30 yrs out
Nearby sold comps map
Loading sold comps map…
Walkable amenities ~0.75 mi
Loading nearby amenities…
Taxation est. · year 1
- Rental income
- $56,772
- − Mortgage interest
- −$28,008
- − Property taxes
- −$10,856
- − Insurance
- −$2,500
- − Repairs & maintenance
- −$4,542
- − Management
- −$4,542
- − Depreciation
- −$14,545
- Taxable loss
- −$8,221
- Est. tax savings @ 24.0%
- +$1,973
- After-tax cash flow
- $2,002/yr
For passive investors: Depreciation is non-cash, so a rental often shows a tax loss while cash-flowing — sheltering income. Rental losses are passive: they offset passive income freely, and up to $25,000/yr can offset ordinary (W-2) income if you actively participate and your MAGI is under $100k (phasing out to $0 by $150k); unused losses carry forward. On sale, claimed depreciation is recaptured at up to 25%, and gains may owe capital-gains tax (a 1031 exchange can defer both). Figures are a year-1 estimate at your 24.0% rate — not tax advice; consult a CPA.
Schools (NCES district)
- District
- Maine Township Hsd 207
- NCES district ID
- 1724090
- Math proficiency
- 34% ▼ -13.00%
- Reading proficiency
- 39% ▼ -7.00%
- Median HH income
- $79,034
- Composite
- 34.36/100
- National rank
- #5220
- State rank
- #143 of 620 in IL
Livability — Park Ridge
- Score
- 88/100
- State rank
- #10
- US rank
- #248
Category grades
Schools grade is shown separately in the Schools card above.
Census & demographics
- Census place
- Park Ridge, IL
- County
- Cook County · 4,486,803 people
- City population
- 38,650
- Metro
- Chicago-Naperville-Elgin, IL-IN-WI
- Population (ZIP)
- 38,650
- Household income
- $143,222
- Rent vs Own
- Severe rent burden
- 371.0
Population outlook (Cook County) Hauer SSP2
- Today (2025)
- 5,347,519 people
- By 2030
- 5,357,703 · +0.2%
- By 2040
- 5,324,924 · -0.4%
- By 2050
- 5,230,762 · -2.2%
- By 2075
- 4,785,735 · -10.5%
- By 2100
- 4,188,836 · -21.7%
Race, ethnicity, and origin ACS 2023
- Neighborhood character
- Predominantly White (83%)
- Race & ethnicity
- White 83% Asian 7% Two or more races 6% Hispanic / Latino 6% Black 1%
- Hispanic origin (detail)
- Mexican 2% Puerto Rican 2%
- Common ancestry
- Romanian 18% Subsaharan African 2% Portuguese 2%
- Foreign-born
- 15% · Canada
- Languages at home
- 78% English-only · Russian/Polish/Slavic 9% Other Indo-European 4% Spanish 4%
Political lean MEDSL · Cook
- 2024 margin
- Solid D (+42.0) · D 70.4% · R 28.4% · Other 1.2%
- 2008→2024 swing
- -11.4pp toward R · 2008: 53.4pp · 2024: 42.0pp
- All cycles
- 2024: D+42.0 2020: D+50.3 2016: D+53.0 2012: D+49.4 2008: D+53.4
Not yet ingested
- Civics
- —
Market trends
- HPI YoY
- ▼ -385.79%
- Current HPI
- 177.7376
- Rent YoY
- —
- Metro
- Chicago-Naperville-Elgin, IL-IN-WI
- State GDP YoY
- ▲ 1.59%
- F500 in state
- 60
Industry mix (Fortune 500 HQ in IL)
| Industry | F500 HQs | Revenue |
|---|---|---|
| Insurance | 4 | $201B |
|
||
| Consumer Goods | 4 | $87B |
|
||
| Industrial Machinery | 3 | $64B |
|
||
| Healthcare | 2 | $55B |
|
||
| Retail / Pharmacy | 1 | $148B |
|
||
| Agriculture / Food | 1 | $86B |
|
||
Price history
+373.9% since first listed4 events — show timeline
- 2026-04-15 Listed $545,000 MRED as Distributed by MLS Grid
- 1985-11-05 Sold (Public Records) $125,500 Public Records
- 1985-10-01 Sold (Public Records) $125,250 Public Records
- 1982-06-10 Sold (Public Records) $115,000 Public Records
Property tax history
+1.2%/yrLatest (2023): $10,856 · +4.4% YoY. Source: county tax records.
Cash-flow waterfall
monthlySold comps — $/sqft
last 12 mo · ≤1 miLoading sold comps…