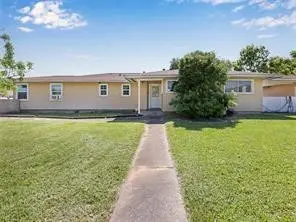
1755 W 10th St · Freeport, TX
Flood risk 9/10 · Severe
- FEMA flood zone
- X (unshaded)
- Chance of flooding over 30 yrs
- 0.99%
- Est. flood insurance / yr
- $507 – $1,088
Fire risk 5/10 · Moderate
- Est. fire insurance / yr
- $1,222 – $2,270
Heat risk 10/10 · Severe
- Hot days now (above 113°F)
- 7 days/yr
- Hot days in 30 yrs
- 25 days/yr
Wind risk 9/10 · Severe
- Chance of severe wind over 30 yrs
- 99.0%
Air-quality risk 3/10 · Minor
- Unhealthy air days now
- 2 days/yr
- Unhealthy air days in 30 yrs
- 2 days/yr
Risk factors via First Street. Map © Google.
Why this score? — see what drove the C+ grade
The composite is a weighted blend of 9 inputs, each scored 0–100. Each bar is that input's sub-score; the figure is the points it added to the 100-point composite (weight × sub-score).
- Cash flow +21.7/30.0
- ARV discount +15.0/15.0
- DSCR +6.9/10.0
- 1% rule +6.1/10.0
- Schools +3.7/10.0
- Livability +2.9/5.0
- Rent growth +2.5/5.0
- Condition / age +2.5/5.0
- Appreciation +0.0/10.0
$145,000
🖨 Deal sheet (PDF) 📄 Offer letter ✓ Due diligence
Listing remarks
Welcome to 1755 W. 10th Street! This spacious 3-bedroom, 2-bath home in Freeport offers tons of potential. Whether you're a first-time buyer, looking to downsize, or searching for an investment opportunity, this property is a great fit. Inside, you'll find a large living room and an open kitchen/dining combo, along with generously sized bedrooms. Outside, a detached two-car garage includes an extra room for storage. Between the house and garage is a cozy patio—perfect for cookouts and outdoor gatherings. Situated on a large corner lot, this home is ideal for entertaining. With just a little TLC, it could be the perfect place to call home.
Key facts
- Large corner lot
- Cozy patio
- 7,801 sq ft lot
Tags
Property features AI
Finance
- Financial info: Lease not considered
Exterior
- Parking: Detached garage (2 spaces)
- Utilities: Public water; Public sewer
- Home design: Residential property; Single-story (first floor living areas); Built in 1958; Slab foundation
- Construction: Stucco construction; Composition roof
- Exterior features: Covered patio and additional patio; Deck; Fenced backyard; Corner lot in a subdivision
Interior
- Kitchen: Kitchen on the first floor (approx. 9.6 x 15.4); Includes dishwasher, microwave, refrigerator
- Bedrooms: Three bedrooms on the first floor (approx. 12 x 13.11; 14.5 x 11; 10.2 x 13.3)
- Flooring: Laminate flooring; Vinyl flooring
- Bathrooms: Two full bathrooms on the first floor (approx. 6 x 5.10; 8.4 x 5.4)
- Heating & cooling: Central heating (gas); Central electric air conditioning
- Interior features: Dishwasher, Microwave, Refrigerator; Laminate and vinyl flooring; 9 total rooms
- Laundry & utility: Utility room on the first floor (approx. 12.7 x 9.4)
Neighborhood map
What this means for you Summary
Snapshot
- This is a 3-bed/2.0-bath single-family listed at $145k.
Deal economics
- At list price, monthly cash flow is $157 ($2k/yr) — positive.
- The deal already cash-flows at list — no discount required.
- Meets the 1% rule at list price ($2k rent vs $145k).
- Cap rate 8.1% vs local median 3.8% in Freeport — top-decile yield for the area; either an underpriced asset or a hidden risk that comps aren't pricing in. Stress-test before assuming the spread holds.
Location & tenants
- Location reads 58/100 on livability (#1,205 in TX) — a working-class tenant base; expect higher turnover. Strengths: cost of living A+, housing A+; Watch: crime D, amenities F, commute F.
- Brazosport ISD (suburban): math 43% / reading 41% proficiency, ranked #305 of 826 in TX (top 37%) — families likely to look elsewhere, expect single-tenant / working-renter base with shorter leases.
- Zoned schools: Freeport El (579 students, 89% FRL); O'Hara Lanier Middle (math 41% / reading 29%, grade F, #842 of 1,662 statewide, top 51%, 340 students, 92% FRL); Brazosport H S (math 40% / reading 27%, grade F, #1,011 of 1,632 statewide, top 63%, 948 students, 78% FRL) — zoned schools average 86% FRL vs 53% district-wide (33 pts higher); higher-poverty schools than district average — tighter screening recommended.
- Market conditions: 590 active listings in the ZIP; 2 comparable units currently listed for rent nearby; 3,960 units permitted in Brazoria County in 2024 (593 in 5+ unit buildings).
Forward outlook
- Local home prices are declining (-3.0%/yr); year-one equity from $1k of loan paydown is wiped out by about $4k of value loss. Plan a longer hold.
- Brazoria County population projected at +44% by 2050 — long-run rental-demand tailwind backs the buy-and-hold thesis.
Negotiation context
- Only 8 days on market — expect competitive offers; lowballing is unlikely to land.
- 4 sale attempts with the ask held roughly flat each time — persistent listings suggest the price (not the market) is what's stuck; bring a comps-based counter.
Risks & watch-outs
- Watch-outs: flood insurance adds $66/mo; built in 1958 — expect roof / HVAC / electrical / plumbing capex.
- Climate carrying-cost: severe flood risk; severe wind risk, 99% chance of damaging wind over 30y; moderate wildfire risk; extreme-heat days projected 7→25/yr by 2055 (HVAC capex compounding) — expect insurance premiums to compound above CPI over the hold.
Questions for the listing agent
- Built in 1958 — when were the roof, HVAC, electrical panel, plumbing, and water heater last replaced?
- What's the actual annual flood-insurance premium (NFIP or private), and is the property in a SFHA with mandatory coverage?
- Is there a deadline driving the sale (1031 exchange, divorce, estate, relocation)? That informs how much negotiation room exists.
- Schools are F-rated, which usually means shorter tenancies and higher turnover. Who's the typical renter profile here, and what's been the actual vacancy rate?
- Crime grade is D in this area — have there been break-ins, vandalism, or insurance claims at this property in the last 3 years? What carrier currently insures it and at what premium?
- What's the average days-on-market for RENTAL listings here right now (not sales)? A rising rental-DOM trend means longer vacancies and softer asking-rent achievability than the comps imply.
- What's the recent tenant-quality profile in this submarket — average credit score on applications, eviction rate, late-payment / NSF rate, and stable-employment percentage? A property-management company in the area should have these aggregated.
- How much new for-sale + rental construction is in the pipeline within 1–3 miles? Heavy new supply typically softens prices + rents 12–24 months out; constrained supply supports both.
Investment metrics
- 1% rule
- 1.11% ✓
- Cap rate
- 8.14%
- Cash-on-cash
- 6.60%
- DSCR
- 1.29
- GRM
- 7.5
CMA / ARV
- ARV (on-the-fly)
- $192,030
- Comps found
- 12
Show comp detail 12 sales within ~0.75 mi
| Address | Dist | Beds/Ba | Sqft | Sold | Price | $/sf | Match |
|---|---|---|---|---|---|---|---|
| 1711 W 10th St | 0.14mi | 3/2.0 | 1,690 (-2%) | 16mo | $130,000 | $77 | 77 |
| 1607 W 11th St | 0.24mi | 3/2.0 | 1,635 (-6%) | 5mo | $199,000 | $122 | 76 |
| 1618 W 11th St | 0.19mi | 4/3.0 (+1) | 1,812 (+5%) | 17mo | $249,900 | $138 | 60 |
| 1607 W Broad St | 0.53mi | 3/2.0 | 1,756 (+2%) | 21mo | $150,000 | $85 | 56 |
| 918 Dixie Dr | 0.04mi | 4/2.5 (+1) | 1,939 (+12%) | 22mo | $215,000 | $111 | 53 |
| 1712 W 5th St | 0.39mi | 3/2.0 | 1,574 (-9%) | 17mo | $179,900 | $114 | 53 |
| 1514 W Broad St | 0.60mi | 3/2.0 | 1,906 (+10%) | 11mo | $150,000 | $79 | 46 |
| 1118 W 11th St | 0.63mi | 4/2.0 (+1) | 1,520 (-12%) | 4mo | $178,000 | $117 | 42 |
| 1115 W 8th St | 0.67mi | 3/1.5 | 1,509 (-13%) | 13mo | $165,000 | $109 | 35 |
| 1202 W 4th St | 0.74mi | 4/2.5 (+1) | 1,863 (+8%) | 17mo | $185,000 | $99 | 32 |
| 1314 W Broad St | 0.70mi | 3/2.0 | 1,978 (+14%) | 16mo | $199,900 | $101 | 30 |
| 1323 W 4th St | 0.62mi | 4/1.0 (+1) | 1,518 (-12%) | 21mo | $169,500 | $112 | 25 |
Match score weights: distance 35% · size 25% · config 20% · recency 20%. Top-matched comps best support the ARV.
Projected returns pro-forma
-3.0% appreciation · 3.0% rent growth · sell at horizon
- IRR
- -9.0%
- Equity multiple
- 0.67×
- Total profit
- $-13,402
- Equity at exit
- $21,620
- IRR
- 0.6%
- Equity multiple
- 1.04×
- Total profit
- $1,589
- Equity at exit
- $12,537
Cash invested: $40,600 (down + closing). Projections, not guarantees.
Landlord ↔ Tenant lean methodology
- Overall (STATE)
- 87 Strongly Landlord-Friendly
- State Texas
- 87 Strongly Landlord-Friendly · R+5
- County
- — inherits STATE
- City
- — inherits STATE
ZIP-level market 77541
- Home prices YoY
- -29.3%
- Active inventory
- 590
- Price-to-rent
- 7.5×
Monthly cashflow live
- Estimated rent
- $1,612 medium interval (Pro) →
- Mortgage (P&I)
- −$760
- Tax from tax record
- −$229 /mo · $2,747/yr
- Insurance
- −$60
- Flood insurance flood zone
- −$66 /mo · $798/yr
- HOA
- −$0
- Vacancy / Maint / Mgmt
- −$338
- Net cashflow
- $157
Break-even live
Sensitivity live
| Price | -10% $239 | -5% $198 | +0% $157 | +5% $116 | +10% $75 |
|---|---|---|---|---|---|
| Rent | -10% $30 | -5% $93 | +0% $157 | +5% $221 | +10% $284 |
| Rate | -1.0pp $230 | -0.5pp $194 | base $157 | +0.5pp $119 | +1.0pp $81 |
UW: 25.0% down · 7.5% · 30yr · 1.5% tax · 5.0% vac · 8.0% maint · 8.0% mgmt
Financing live
Cash to close
- Down payment
- $36,250
- Closing costs
- $4,350
- Reserves months
- —
- Total cash needed
- —
Loan-product check · same deal, 3 products live
Conventional
25% down · 7.5% · 30yr
- Down + closing
- —
- Monthly P&I
- —
- Monthly cashflow
- —
- DSCR
- —
- Eligible?
- —
Personal DTI + credit; lowest rate.
DSCR
20% down · 8.5% · 30yr
- Down + closing
- —
- Monthly P&I
- —
- Monthly cashflow
- —
- DSCR
- —
- Eligible?
- —
No personal income docs; deal must DSCR.
Hard money
10% down · 12.0% · 12mo
- Down + closing
- —
- Monthly P&I
- —
- Monthly cashflow
- —
- DSCR
- —
- Eligible?
- —
Short-term bridge; refi at stabilization.
Rent comps 2 comps
| Address | Beds | Baths | Sqft | Rent | $/sqft | DOM | Units | Dist |
|---|---|---|---|---|---|---|---|---|
| 310 Yaupon St Unit ST402 Freeport, TX | 3.0 | 1.0 | 1050 | $1,150 | $1.10 | 44d | 1 | 0.50mi |
| 102 North Avenue C Unit C Freeport, TX | 4.0 | 2.0 | 1500 | $1,550 | $1.03 | 44d | 1 | 1.16mi |
Listing history 6 events
-
2026-06-18days on market $145,000 Active 8 DOM
-
2026-06-17days on market $145,000 Active 7 DOM
-
2026-06-16days on market $145,000 Active 6 DOM
-
2026-06-15days on market $145,000 Active 5 DOM
-
2026-06-13remarks 647-char remark
-
2026-06-13$145,000 Active 3 DOM
ⓘ Source: listings_history table (triggers on properties + properties_extension) + one-shot
backfill from property_details.listing_events for pre-trigger history.
Tax reassessment forecast TX · Resets to sale price
- Current annual tax
- $2,747 · $229/mo
- Projected year-2 tax
- $2,747 · $229/mo
- Expected delta
- $0/yr ($0/mo · 0.0%)
ⓘ Screening estimate from a state-policy table — verify with the county assessor before closing.
Climate risk First Street
- Flood 9/10 Extreme FEMA zone X (unshaded) · 99% chance over 30 yrs
- Wildfire 5/10 Major
- Heat 10/10 Extreme 7 d/yr ≥113°F today · 25 d/yr by 30 yrs out
- Wind 9/10 Extreme 99% chance of damaging wind over 30 yrs
- Air quality 3/10 Moderate 2 unhealthy d/yr today · 2 by 30 yrs out
Nearby sold comps map
Loading sold comps map…
Walkable amenities ~0.75 mi
Loading nearby amenities…
Taxation est. · year 1
- Rental income
- $19,340
- − Mortgage interest
- −$8,122
- − Property taxes
- −$2,747
- − Insurance
- −$1,522
- − Repairs & maintenance
- −$1,547
- − Management
- −$1,547
- − Depreciation
- −$4,218
- Taxable loss
- −$365
- Est. tax savings @ 24.0%
- +$88
- After-tax cash flow
- $1,972/yr
For passive investors: Depreciation is non-cash, so a rental often shows a tax loss while cash-flowing — sheltering income. Rental losses are passive: they offset passive income freely, and up to $25,000/yr can offset ordinary (W-2) income if you actively participate and your MAGI is under $100k (phasing out to $0 by $150k); unused losses carry forward. On sale, claimed depreciation is recaptured at up to 25%, and gains may owe capital-gains tax (a 1031 exchange can defer both). Figures are a year-1 estimate at your 24.0% rate — not tax advice; consult a CPA.
Schools (NCES district)
- District
- Brazosport ISD
- NCES district ID
- 4811190
- Math proficiency
- 43% ▼ -6.00%
- Reading proficiency
- 41% ▼ -2.00%
- Median HH income
- $57,024
- Composite
- 36.84/100
- National rank
- #4557
- State rank
- #305 of 826 in TX
Livability — Freeport
- Score
- 58/100
- State rank
- #1205
- US rank
- #21044
Category grades
Schools grade is shown separately in the Schools card above.
Census & demographics
- Census place
- Freeport, TX
- County
- Brazoria County · 374,982 people
- City population
- 16,996
- Metro
- Houston-The Woodlands-Sugar Land, TX
- Population (ZIP)
- 16,996
- Household income
- $66,507
- Rent vs Own
- Severe rent burden
- 354.0
Population outlook (Brazoria County) Hauer SSP2
- Today (2025)
- 420,414 people
- By 2030
- 457,585 · +8.8%
- By 2040
- 532,232 · +26.6%
- By 2050
- 605,399 · +44.0%
- By 2075
- 779,358 · +85.4%
- By 2100
- 883,759 · +110.2%
Race, ethnicity, and origin ACS 2023
- Neighborhood character
- Diverse neighborhood (Simpson 0.62)
- Race & ethnicity
- Hispanic / Latino 47% White 38% Two or more races 23% Black 12%
- Hispanic origin (detail)
- Mexican 42%
- Common ancestry
- Romanian 1% Italian 1% Lithuanian 1%
- Foreign-born
- 12% · Canada
- Languages at home
- 71% English-only · Spanish 29%
Political lean MEDSL · Brazoria
- 2024 margin
- R (+19.7) · D 39.5% · R 59.2% · Other 1.3%
- 2008→2024 swing
- +9.9pp toward D · 2008: -29.6pp · 2024: -19.7pp
- All cycles
- 2024: R+19.7 2020: R+18.2 2016: R+24.6 2012: R+34.2 2008: R+29.6
Not yet ingested
- Civics
- —
Market trends
- HPI YoY
- ▼ -110.12%
- Current HPI
- 265.9301
- Rent YoY
- —
- Metro
- Houston-The Woodlands-Sugar Land, TX
- State GDP YoY
- ▲ 3.95%
- F500 in state
- 110
Industry mix (Fortune 500 HQ in TX)
| Industry | F500 HQs | Revenue |
|---|---|---|
| Energy | 16 | $1,198B |
|
||
| Technology | 5 | $198B |
|
||
| Engineering / Construction | 4 | $72B |
|
||
| Energy Services | 3 | $60B |
|
||
| Utilities | 3 | $41B |
|
||
| Healthcare | 2 | $330B |
|
||
Price history
-12.1% since first listed14 events — show timeline
- 2026-06-10 Listed $145,000 HARMLS
- 2026-02-25 Listing Removed — HARMLS
- 2025-12-12 Price Changed $147,000 HARMLS
- 2025-10-28 Listed $150,000 HARMLS
- 2025-10-08 Listing Removed — HARMLS
- 2025-06-21 Price Changed $150,000 HARMLS
- 2025-06-04 Price Changed $155,000 HARMLS
- 2025-05-13 Price Changed $157,500 HARMLS
- 2025-05-01 Relisted — HARMLS
- 2025-04-27 Pending — HARMLS
- 2025-04-11 Listed $164,900 HARMLS
- 2017-08-14 Sold (Public Records) — Public Records
- 2016-09-16 Sold (Public Records) — Public Records
- 2002-02-21 Sold (Public Records) — Public Records
Property tax history
+3.5%/yrLatest (2025): $2,747 · +8.2% YoY. Source: county tax records.
Cash-flow waterfall
monthlySold comps — $/sqft
last 12 mo · ≤1 miLoading sold comps…