3418 Ridge Rd · Barboursville, VA
Flood risk 1/10 · Minimal
- FEMA flood zone
- X (unshaded)
- Chance of flooding over 30 yrs
- 0.0%
- Est. flood insurance / yr
- $507 – $1,088
Fire risk 5/10 · Moderate
- Est. fire insurance / yr
- $666 – $1,236
Heat risk 5/10 · Moderate
- Hot days now (above 104°F)
- 7 days/yr
- Hot days in 30 yrs
- 16 days/yr
Wind risk 2/10 · Minimal
- Chance of severe wind over 30 yrs
- 4.0%
Air-quality risk 1/10 · Minimal
- Unhealthy air days now
- 0 days/yr
- Unhealthy air days in 30 yrs
- 0 days/yr
Risk factors via First Street. Map © Google.
Why this score? — see what drove the F grade
The composite is a weighted blend of 9 inputs, each scored 0–100. Each bar is that input's sub-score; the figure is the points it added to the 100-point composite (weight × sub-score).
- Cash flow +8.6/30.0
- ARV discount +7.5/15.0
- Schools +4.8/10.0
- Rent growth +2.5/5.0
- Livability +2.5/5.0
- Condition / age +2.5/5.0
- DSCR +2.3/10.0
- 1% rule +1.3/10.0
- Appreciation +0.0/10.0
$375,000
🖨 Deal sheet 📄 Offer letter ✓ Due diligence
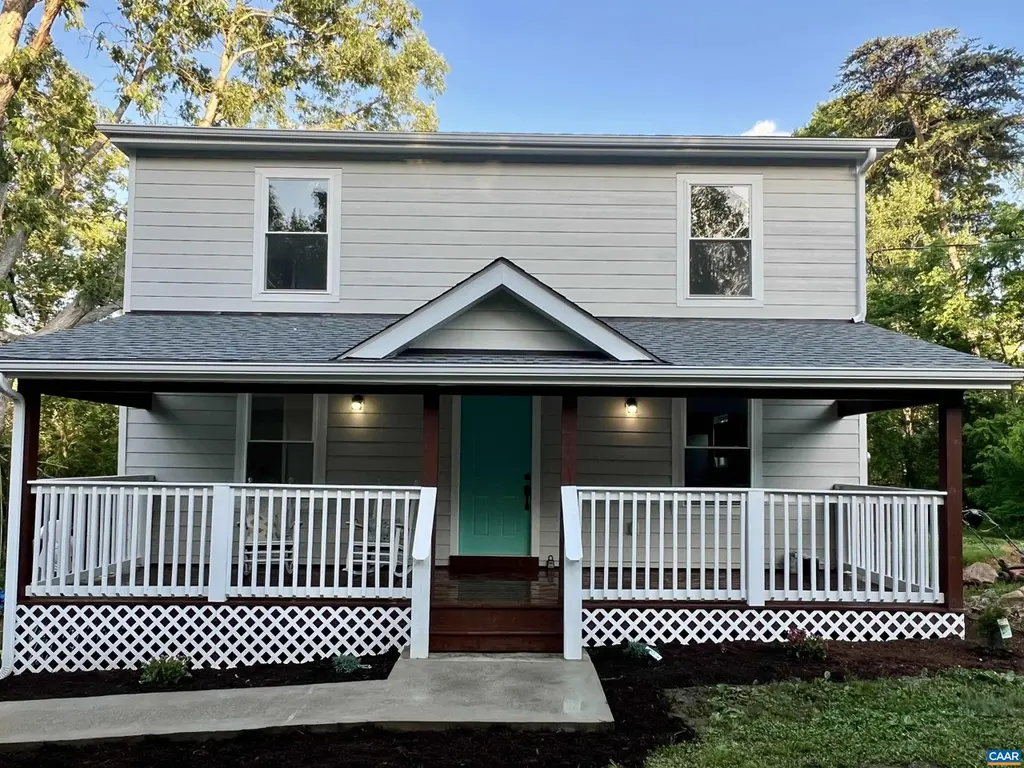
Listing remarks
Sunday June 14 1-2PM Open House. Why wait for new construction when you can have the best of both worlds, a completely renovated home set on a beautiful acre lot with mature trees and established surroundings? This home has been completely rebuilt from the studs up with new framing, roof, plumbing, electrical, HVAC, flooring, and hot water heater, kitchen, bathrooms and more, offering the peace of mind of having a new home while retaining charm. Minutes from renowned vineyards, less than 20 minutes to NGIC, 15 minutes to Gordonsville, and only 30 minutes to Downtown Charlottesville, this property combines convenience with peaceful living. Inside, every detail has been thoughtfully updated,
Key facts
- 1 acre lot
- Built 1950
- Listed 7 days
Property features AI
Exterior
- Security: Surveillance system
- Utilities: Cable available; Septic tank; Private well water
- Home design: Detached property; Two stories
- Construction: Stick-built construction; Block foundation
- Exterior features: Cable available; Septic tank; Private well water; Lot approximately 1 acre
Interior
- Kitchen: ENERGY STAR qualified appliances
- Bedrooms: One main-level bedroom; One second-level bedroom
- Bathrooms: Two bathrooms total; One main-level bathroom; Primary bathroom on second level
- Heating & cooling: Central heating; Central air conditioning
- Interior features: ENERGY STAR qualified appliances; Surveillance system
Neighborhood map
What this means for you Summary
Snapshot
- This is a 2-bed/1.0-bath single-family listed at $375k.
Deal economics
- At list price, monthly cash flow is $-325 ($-4k/yr) — negative.
- To cash-flow at today's rent, offer at most $318k (15.3% below list).
- To meet the 1% rule (rent ≥ 1% of price), the offer needs to be $236k (37.1% below list).
- Recommended offer: $236k (37.1% below list) — sets the bar for 1% rule.
- Cap rate 5.3% vs local median 4.3% in Barboursville — meaningfully above typical; check what's discounted (condition, days-on-market, listing class) to confirm the premium yield is real.
Location & tenants
- Location reads: area grade F — affects rentability + tenant quality, not the cash-flow math above.
- Orange County Public School District (rural): math 47% / reading 64% proficiency, ranked #71 of 131 in VA (top 54%) — acceptable for families but not a draw, mixed tenant base, ~2y average lease.
- Zoned schools: Gordon-Barbour Elementary (math 52% / reading 62%, grade C+, #597 of 1,108 statewide, top 57%, 321 students, 70% FRL); Prospect Heights Middle (math 43% / reading 63%, grade C+, #213 of 342 statewide, top 63%, 456 students, 68% FRL); Orange County High (math 61% / reading 72%, grade B, #195 of 319 statewide, top 62%, 1,476 students, 43% FRL) — zoned schools average 60% FRL vs 34% district-wide (27 pts higher); higher-poverty schools than district average — tighter screening recommended.
- Market conditions: 184 active listings in the ZIP; high-income renter base; 412 units permitted in Orange County in 2024 (0 in 5+ unit buildings).
Forward outlook
- Local home prices are declining (-3.0%/yr); year-one equity from $3k of loan paydown is wiped out by about $11k of value loss. Plan a longer hold.
- Orange County population projected at +18% by 2050 — long-run rental-demand tailwind backs the buy-and-hold thesis.
Negotiation context
- Only 7 days on market — expect competitive offers; lowballing is unlikely to land.
- Current owner paid $145k; list at $375k implies a 159% gain — meaningful room to come down on a strong offer.
Risks & watch-outs
- Watch-outs: built in 1950 — expect roof / HVAC / electrical / plumbing capex.
- Climate carrying-cost: moderate wildfire risk; extreme-heat days projected 7→16/yr by 2055 (HVAC capex compounding) — expect insurance premiums to compound above CPI over the hold.
Questions for the listing agent
- What do current leases actually rent for vs. the listed asking? Can we see a recent rent roll and the last 12 months of T-12 income?
- Built in 1950 — when were the roof, HVAC, electrical panel, plumbing, and water heater last replaced?
- Is there a deadline driving the sale (1031 exchange, divorce, estate, relocation)? That informs how much negotiation room exists.
- The area grade is low — what's the realistic commute time and amenity access for the typical tenant pool here? Any planned neighborhood developments (good or bad) we should know about?
- What's the average days-on-market for RENTAL listings here right now (not sales)? A rising rental-DOM trend means longer vacancies and softer asking-rent achievability than the comps imply.
- What's the recent tenant-quality profile in this submarket — average credit score on applications, eviction rate, late-payment / NSF rate, and stable-employment percentage? A property-management company in the area should have these aggregated.
- How much new for-sale + rental construction is in the pipeline within 1–3 miles? Heavy new supply typically softens prices + rents 12–24 months out; constrained supply supports both.
Investment metrics
- 1% rule
- 0.63% ✗
- Cap rate
- 5.25%
- Cash-on-cash
- -3.71%
- DSCR
- 0.83
- GRM
- 13.2
CMA / ARV
No comps found within radius.
Projected returns pro-forma
-3.0% appreciation · 3.0% rent growth · sell at horizon
- IRR
- -22.6%
- Equity multiple
- 0.22×
- Total profit
- $-81,681
- Equity at exit
- $55,914
- IRR
- -17.1%
- Equity multiple
- 0.06×
- Total profit
- $-98,645
- Equity at exit
- $32,423
Cash invested: $105,000 (down + closing). Projections, not guarantees.
Landlord ↔ Tenant lean methodology
- Overall (STATE)
- 55 Moderately Landlord-Leaning
- State Virginia
- 55 Moderately Landlord-Leaning · D+2
- County
- — inherits STATE
- City
- — inherits STATE
ZIP-level market 22923
- Home prices YoY
- -3.6%
- Active inventory
- 184
- Price-to-rent
- 13.2×
Monthly cashflow live
- Estimated rent
- $2,360 medium interval (Pro) →
- Mortgage (P&I)
- −$1,967
- Tax from tax record
- −$66 /mo · $795/yr
- Insurance
- −$156
- HOA
- −$0
- Vacancy / Maint / Mgmt
- −$495
- Net cashflow
- $-325
Break-even live
UW: 25.0% down · 7.5% · 30yr · 1.5% tax · 5.0% vac · 8.0% maint · 8.0% mgmt
Financing live
Cash to close
- Down payment
- $93,750
- Closing costs
- $11,250
- Reserves months
- —
- Total cash needed
- —
Loan-product check · same deal, 3 products live
Conventional
25% down · 7.5% · 30yr
- Down + closing
- —
- Monthly P&I
- —
- Monthly cashflow
- —
- DSCR
- —
- Eligible?
- —
Personal DTI + credit; lowest rate.
DSCR
20% down · 8.5% · 30yr
- Down + closing
- —
- Monthly P&I
- —
- Monthly cashflow
- —
- DSCR
- —
- Eligible?
- —
No personal income docs; deal must DSCR.
Hard money
10% down · 12.0% · 12mo
- Down + closing
- —
- Monthly P&I
- —
- Monthly cashflow
- —
- DSCR
- —
- Eligible?
- —
Short-term bridge; refi at stabilization.
Listing history 13 events
-
2026-06-18days on market $375,000 Active 7 DOM
-
2026-06-17days on market $375,000 Active 6 DOM
-
2026-06-16days on market $375,000 Active 5 DOM
-
2026-06-15days on market $375,000 Active 4 DOM
-
2026-06-13statusdays on market $375,000 Active 2 DOM
-
2026-06-09days on market $375,000 Coming Soon 11 DOM
-
2026-06-08days on market $375,000 Coming Soon 10 DOM
-
2026-06-07days on market $375,000 Coming Soon 9 DOM
-
2026-06-04days on market $375,000 Coming Soon 6 DOM
-
2026-06-03days on market $375,000 Coming Soon 5 DOM
-
2026-06-02days on market $375,000 Coming Soon 4 DOM
-
2026-06-01days on market $375,000 Coming Soon 3 DOM
-
2026-05-31days on market $375,000 Coming Soon 2 DOM
ⓘ Source: listings_history table (triggers on properties + properties_extension) + one-shot
backfill from property_details.listing_events for pre-trigger history.
Tax reassessment forecast VA · Resets to sale price
- Current annual tax
- $795 · $66/mo
- Projected year-2 tax
- $3,075 · $256/mo
- Expected delta
- +$2,280/yr (+$190/mo · 286.6%)
ⓘ Screening estimate from a state-policy table — verify with the county assessor before closing.
Climate risk First Street
- Flood 1/10 Low FEMA zone X (unshaded) · 0% chance over 30 yrs
- Wildfire 5/10 Major
- Heat 5/10 Major 7 d/yr ≥104°F today · 16 d/yr by 30 yrs out
- Wind 2/10 Low 4% chance of damaging wind over 30 yrs
- Air quality 1/10 Low 0 unhealthy d/yr today · 0 by 30 yrs out
Nearby sold comps map
Loading sold comps map…
Walkable amenities ~0.75 mi
Loading nearby amenities…
Taxation est. · year 1
- Rental income
- $28,314
- − Mortgage interest
- −$21,006
- − Property taxes
- −$795
- − Insurance
- −$1,875
- − Repairs & maintenance
- −$2,265
- − Management
- −$2,265
- − Depreciation
- −$10,909
- Taxable loss
- −$10,801
- Est. tax savings @ 24.0%
- +$2,592
- After-tax cash flow
- $-1,308/yr
For passive investors: Depreciation is non-cash, so a rental often shows a tax loss while cash-flowing — sheltering income. Rental losses are passive: they offset passive income freely, and up to $25,000/yr can offset ordinary (W-2) income if you actively participate and your MAGI is under $100k (phasing out to $0 by $150k); unused losses carry forward. On sale, claimed depreciation is recaptured at up to 25%, and gains may owe capital-gains tax (a 1031 exchange can defer both). Figures are a year-1 estimate at your 24.0% rate — not tax advice; consult a CPA.
Schools (NCES district)
- District
- Orange County Public School District
- NCES district ID
- 5102820
- Math proficiency
- 47% ▼ -35.00%
- Reading proficiency
- 64% ▼ -14.00%
- Median HH income
- $61,086
- Composite
- 48.34/100
- National rank
- #2147
- State rank
- #71 of 131 in VA
Livability — Barboursville
No livability data for this city. (Only ~50 U.S. cities are tracked.)
Census & demographics
- County
- Orange County · 21,992 people
- City population
- 6,435
- Metro
- Charlottesville, VA
- Population (ZIP)
- 6,435
- Household income
- $118,125
- Rent vs Own
- Severe rent burden
- 42.0
Population outlook (Orange County) Hauer SSP2
- Today (2025)
- 38,758 people
- By 2030
- 40,411 · +4.3%
- By 2040
- 43,477 · +12.2%
- By 2050
- 45,856 · +18.3%
- By 2075
- 51,067 · +31.8%
- By 2100
- 51,387 · +32.6%
Race, ethnicity, and origin ACS 2023
- Neighborhood character
- Predominantly White (89%)
- Race & ethnicity
- White 89% Black 5% Two or more races 5% Asian 1%
- Common ancestry
- Slovak 5% Portuguese 3% Italian 3%
- Foreign-born
- 3%
- Languages at home
- 97% English-only · Other Asian/Pacific 1% French/Haitian/Cajun 1% German/W. Germanic 1%
Political lean MEDSL · Orange
- 2024 margin
- Strong R (+24.7) · D 37.2% · R 61.9%
- 2008→2024 swing
- -15.8pp toward R · 2008: -8.8pp · 2024: -24.7pp
- All cycles
- 2024: R+24.7 2020: R+21.4 2016: R+26.6 2012: R+14.5 2008: R+8.8
Not yet ingested
- Civics
- —
Market trends
- HPI YoY
- ▼ -11.41%
- Current HPI
- 303.0348
- Rent YoY
- —
- Metro
- Charlottesville, VA
- State GDP YoY
- ▲ 2.40%
- F500 in state
- 50
Industry mix (Fortune 500 HQ in VA)
| Industry | F500 HQs | Revenue |
|---|---|---|
| Aerospace / Defense | 4 | $236B |
|
||
| Technology / Defense | 3 | $32B |
|
||
| Financial Services | 2 | $176B |
|
||
| Utilities | 2 | $27B |
|
||
| Insurance | 2 | $25B |
|
||
| Technology | 2 | $15B |
|
||
Price history
+681.2% since first listed3 events — show timeline
- 2026-05-29 Coming Soon $375,000 CAAR
- 2024-09-23 Sold (Public Records) $145,000 Public Records
- 2009-09-08 Sold (Public Records) $48,000 Public Records
Property tax history
+0.7%/yrLatest (2025): $795 · +17.8% YoY. Source: county tax records.
Cash-flow waterfall
monthlySold comps — $/sqft
last 12 mo · ≤1 miLoading sold comps…