642 Central Ave · South Williamson, KY
Flood risk 8/10 · Major
- FEMA flood zone
- X (unshaded)
- Chance of flooding over 30 yrs
- 0.78%
- Est. flood insurance / yr
- $507 – $1,088
Fire risk 5/10 · Moderate
- Est. fire insurance / yr
- $839 – $1,559
Heat risk 4/10 · Minor
- Hot days now (above 103°F)
- 7 days/yr
- Hot days in 30 yrs
- 20 days/yr
Wind risk 2/10 · Minimal
- Chance of severe wind over 30 yrs
- 1.0%
Air-quality risk 1/10 · Minimal
- Unhealthy air days now
- 0 days/yr
- Unhealthy air days in 30 yrs
- 0 days/yr
Risk factors via First Street. Map © Google.
Why this score? — see what drove the A- grade
The composite is a weighted blend of 9 inputs, each scored 0–100. Each bar is that input's sub-score; the figure is the points it added to the 100-point composite (weight × sub-score).
- Cash flow +30.0/30.0
- ARV discount +15.0/15.0
- 1% rule +10.0/10.0
- DSCR +10.0/10.0
- Appreciation +4.6/10.0
- Livability +3.4/5.0
- Schools +2.6/10.0
- Rent growth +2.5/5.0
- Condition / age +2.5/5.0
$69,000
🖨 Deal sheet 📄 Offer letter ✓ Due diligence
Listing remarks MLS
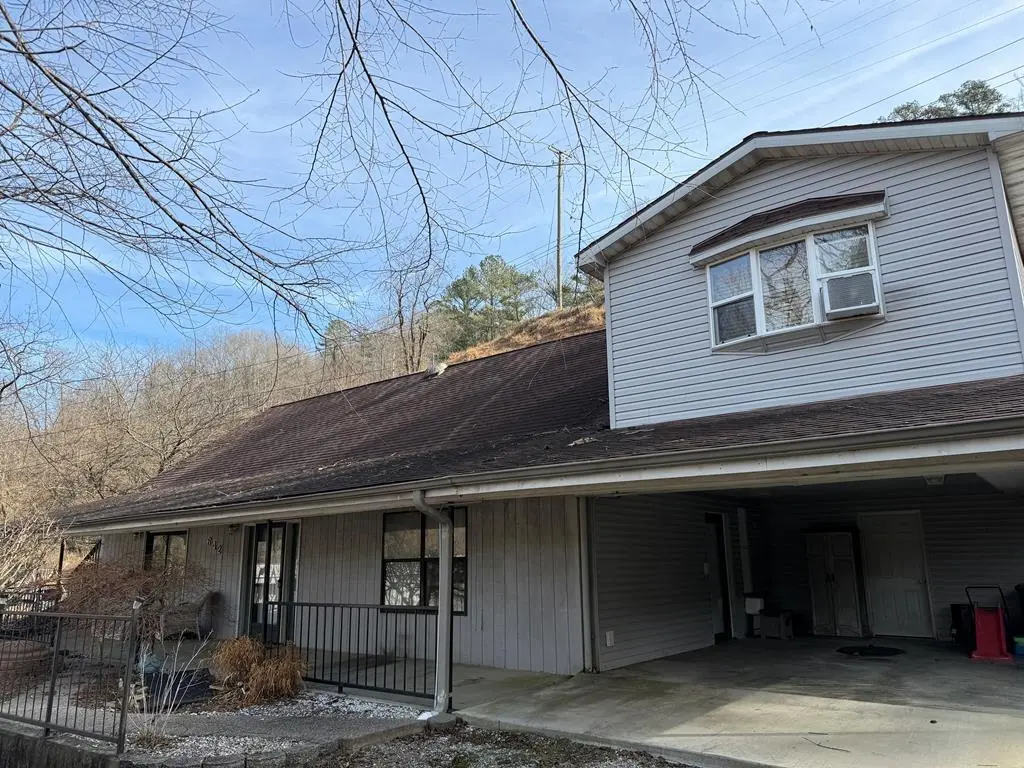
Very nice two bedroom home with large rooms and unique features such as the wooden beams and a spiral staircase. It has a lot of potential with part of the lot fenced and has an oversized 1 car carport. This home does need some repairs, schedule a showing it could be your dream home. Convenient Location to hospital and approx 15 min. from the Buffalo Mtn. Trail Head. {Note, this home is up against the hillside in the back. }
Key facts
- Oversized carport
- Wooden beams
- Spiral staircase
Tags
Neighborhood map
What this means for you Summary
Snapshot
- This is a 2-bed/1.5-bath single-family listed at $69k.
Deal economics
- At list price, monthly cash flow is $320 ($4k/yr) — positive.
- The deal already cash-flows at list — no discount required.
- Meets the 1% rule at list price ($1k rent vs $69k).
- Recommended offer: $63k (9.0% below list) — sets the bar for market timing.
Location & tenants
- Location reads 68/100 on livability (#193 in KY) — a middle-class / working-renter tenant base. Strengths: crime A+, employment A+, cost of living A+; Watch: schools F, amenities F, commute F.
- Pike County (rural): math 24% / reading 40% proficiency, ranked #98 of 165 in KY (top 59%) — families likely to look elsewhere, expect single-tenant / working-renter base with shorter leases.
- Market conditions: 8 active listings in the ZIP; 4 units permitted in Pike County in 2024 (0 in 5+ unit buildings).
Forward outlook
- Local home prices are declining (-0.8%/yr); year-one equity from $477 of loan paydown is wiped out by about $590 of value loss. Plan a longer hold.
- Pike County population projected at -33% by 2050 — secular population decline; favor cash flow + early exit over multi-decade hold.
- At projected returns (-0.8% appreciation + 3.0% rent growth), your $19k cash investment doubles in ~5 years — after that, you're playing with house money.
Negotiation context
- It's been on market 119 days — a 9% lower offer ($63k) is reasonable based on typical stale-listing flexibility.
Risks & watch-outs
- Watch-outs: flood insurance adds $66/mo.
- Climate carrying-cost: severe flood risk; moderate wildfire risk — expect insurance premiums to compound above CPI over the hold.
Questions for the listing agent
- It's been on market 119 days. Have you received any prior offers? Is the seller open to a 9% concession, seller financing, or rate buy-down credit?
- What's the actual annual flood-insurance premium (NFIP or private), and is the property in a SFHA with mandatory coverage?
- Why hasn't it sold? Are there any deal-killer items the seller is aware of (foundation, flood, title, zoning, code violations)?
- Is there a deadline driving the sale (1031 exchange, divorce, estate, relocation)? That informs how much negotiation room exists.
- Schools are F-rated, which usually means shorter tenancies and higher turnover. Who's the typical renter profile here, and what's been the actual vacancy rate?
- What's the average days-on-market for RENTAL listings here right now (not sales)? A rising rental-DOM trend means longer vacancies and softer asking-rent achievability than the comps imply.
- What's the recent tenant-quality profile in this submarket — average credit score on applications, eviction rate, late-payment / NSF rate, and stable-employment percentage? A property-management company in the area should have these aggregated.
- How much new for-sale + rental construction is in the pipeline within 1–3 miles? Heavy new supply typically softens prices + rents 12–24 months out; constrained supply supports both.
Investment metrics
- 1% rule
- 1.54% ✓
- Cap rate
- 13.02%
- Cash-on-cash
- 24.02%
- DSCR
- 2.07
- GRM
- 5.4
CMA / ARV
- ARV (median comp)
- $125,594
- List price
- $69,000
- Delta
- -45.06%
- Verdict
- UNDERPRICED
- Comps
- 9 within 1.0 mi
Projected returns pro-forma
-0.85% appreciation · 3.0% rent growth · sell at horizon
- IRR
- 17.7%
- Equity multiple
- 1.81×
- Total profit
- $15,692
- Equity at exit
- $17,137
- IRR
- 23.2%
- Equity multiple
- 3.39×
- Total profit
- $46,186
- Equity at exit
- $18,409
Cash invested: $19,320 (down + closing). Projections, not guarantees.
Landlord ↔ Tenant lean methodology
- Overall (STATE)
- 83 Strongly Landlord-Friendly
- State Kentucky
- 83 Strongly Landlord-Friendly · R+16
- County
- — inherits STATE
- City
- — inherits STATE
ZIP-level market 41503
- Home prices YoY
- -0.6%
- Active inventory
- 8
- Price-to-rent
- 5.4×
Monthly cashflow live
- Estimated rent
- $1,063 medium interval (Pro) →
- Mortgage (P&I)
- −$362
- Tax from tax record
- −$62 /mo · $747/yr
- Insurance
- −$29
- Flood insurance flood zone
- −$66 /mo · $798/yr
- HOA
- −$0
- Vacancy / Maint / Mgmt
- −$223
- Net cashflow
- $320
Break-even live
UW: 25.0% down · 7.5% · 30yr · 1.5% tax · 5.0% vac · 8.0% maint · 8.0% mgmt
Financing live
Cash to close
- Down payment
- $17,250
- Closing costs
- $2,070
- Reserves months
- —
- Total cash needed
- —
Loan-product check · same deal, 3 products live
Conventional
25% down · 7.5% · 30yr
- Down + closing
- —
- Monthly P&I
- —
- Monthly cashflow
- —
- DSCR
- —
- Eligible?
- —
Personal DTI + credit; lowest rate.
DSCR
20% down · 8.5% · 30yr
- Down + closing
- —
- Monthly P&I
- —
- Monthly cashflow
- —
- DSCR
- —
- Eligible?
- —
No personal income docs; deal must DSCR.
Hard money
10% down · 12.0% · 12mo
- Down + closing
- —
- Monthly P&I
- —
- Monthly cashflow
- —
- DSCR
- —
- Eligible?
- —
Short-term bridge; refi at stabilization.
Listing history 3 events
-
2026-05-12status Pending 429-char remark
Show marketing remark (429 chars)
Very nice two bedroom home with large rooms and unique features such as the wooden beams and a spiral staircase. It has a lot of potential with part of the lot fenced and has an oversized 1 car carport. This home does need some repairs, schedule a showing it could be your dream home. Convenient Location to hospital and approx 15 min. from the Buffalo Mtn. Trail Head. {Note, this home is up against the hillside in the back. }
-
2026-05-06price $69,000 429-char remark
Show marketing remark (429 chars)
Very nice two bedroom home with large rooms and unique features such as the wooden beams and a spiral staircase. It has a lot of potential with part of the lot fenced and has an oversized 1 car carport. This home does need some repairs, schedule a showing it could be your dream home. Convenient Location to hospital and approx 15 min. from the Buffalo Mtn. Trail Head. {Note, this home is up against the hillside in the back. }
-
2026-01-13$79,000 Active 429-char remark
Show marketing remark (429 chars)
Very nice two bedroom home with large rooms and unique features such as the wooden beams and a spiral staircase. It has a lot of potential with part of the lot fenced and has an oversized 1 car carport. This home does need some repairs, schedule a showing it could be your dream home. Convenient Location to hospital and approx 15 min. from the Buffalo Mtn. Trail Head. {Note, this home is up against the hillside in the back. }
ⓘ Source: listings_history table (triggers on properties + properties_extension) + one-shot
backfill from property_details.listing_events for pre-trigger history.
Tax reassessment forecast KY · Resets to sale price
- Current annual tax
- $747 · $62/mo
- Projected year-2 tax
- $747 · $62/mo
- Expected delta
- $0/yr ($0/mo · 0.0%)
ⓘ Screening estimate from a state-policy table — verify with the county assessor before closing.
Climate risk First Street
- Flood 8/10 Severe FEMA zone X (unshaded) · 78% chance over 30 yrs
- Wildfire 5/10 Major
- Heat 4/10 Moderate 7 d/yr ≥103°F today · 20 d/yr by 30 yrs out
- Wind 2/10 Low 100% chance of damaging wind over 30 yrs
- Air quality 1/10 Low 0 unhealthy d/yr today · 0 by 30 yrs out
Nearby sold comps map
Loading sold comps map…
Walkable amenities ~0.75 mi
Loading nearby amenities…
Taxation est. · year 1
- Rental income
- $12,752
- − Mortgage interest
- −$3,865
- − Property taxes
- −$747
- − Insurance
- −$1,142
- − Repairs & maintenance
- −$1,020
- − Management
- −$1,020
- − Depreciation
- −$2,007
- Taxable income
- $2,950
- Est. tax owed @ 24.0%
- −$708
- After-tax cash flow
- $3,134/yr
For passive investors: Depreciation is non-cash, so a rental often shows a tax loss while cash-flowing — sheltering income. Rental losses are passive: they offset passive income freely, and up to $25,000/yr can offset ordinary (W-2) income if you actively participate and your MAGI is under $100k (phasing out to $0 by $150k); unused losses carry forward. On sale, claimed depreciation is recaptured at up to 25%, and gains may owe capital-gains tax (a 1031 exchange can defer both). Figures are a year-1 estimate at your 24.0% rate — not tax advice; consult a CPA.
Schools (NCES district)
- District
- Pike County
- NCES district ID
- 2104800
- Math proficiency
- 24% ▼ -24.00%
- Reading proficiency
- 40% ▼ -20.00%
- Median HH income
- $32,601
- Composite
- 26.14/100
- National rank
- #7276
- State rank
- #98 of 165 in KY
Livability — South Williamson
- Score
- 68/100
- State rank
- #193
- US rank
- #9670
Category grades
Schools grade is shown separately in the Schools card above.
Census & demographics
- Census place
- South Williamson, KY
- City population
- 301
- Population (ZIP)
- 301
Population outlook (Pike County) Hauer SSP2
- Today (2025)
- 55,108 people
- By 2030
- 51,235 · -7.0%
- By 2040
- 43,573 · -20.9%
- By 2050
- 36,797 · -33.2%
- By 2075
- 24,330 · -55.9%
- By 2100
- 15,611 · -71.7%
Race, ethnicity, and origin ACS 2023
- Neighborhood character
- Predominantly White (95%)
- Race & ethnicity
- White 95%
Political lean MEDSL · Pike
- 2024 margin
- Solid R (+65.4) · D 16.8% · R 82.2%
- 2008→2024 swing
- -51.6pp toward R · 2008: -13.8pp · 2024: -65.4pp
- All cycles
- 2024: R+65.4 2020: R+60.7 2016: R+62.8 2012: R+50.5 2008: R+13.8
Not yet ingested
- Civics
- —
Market trends
- HPI YoY
- ▼ -0.85%
- Current HPI
- 150.7112
- Rent YoY
- —
- Metro
- —
- State GDP YoY
- ▲ 1.81%
- F500 in state
- 4
Industry mix (Fortune 500 HQ in KY)
| Industry | F500 HQs | Revenue |
|---|---|---|
| Healthcare | 1 | $118B |
|
||
| Food / Beverage | 1 | $7B |
|
||
Price history
-12.7% since first listed3 events — show timeline
- 2026-05-12 Pending — EKAR
- 2026-05-06 Price Changed $69,000 EKAR
- 2026-01-13 Listed $79,000 EKAR
Property tax history
+2.4%/yrLatest (2025): $747 · -0.7% YoY. Source: county tax records.
Cash-flow waterfall
monthlySold comps — $/sqft
last 12 mo · ≤1 miLoading sold comps…