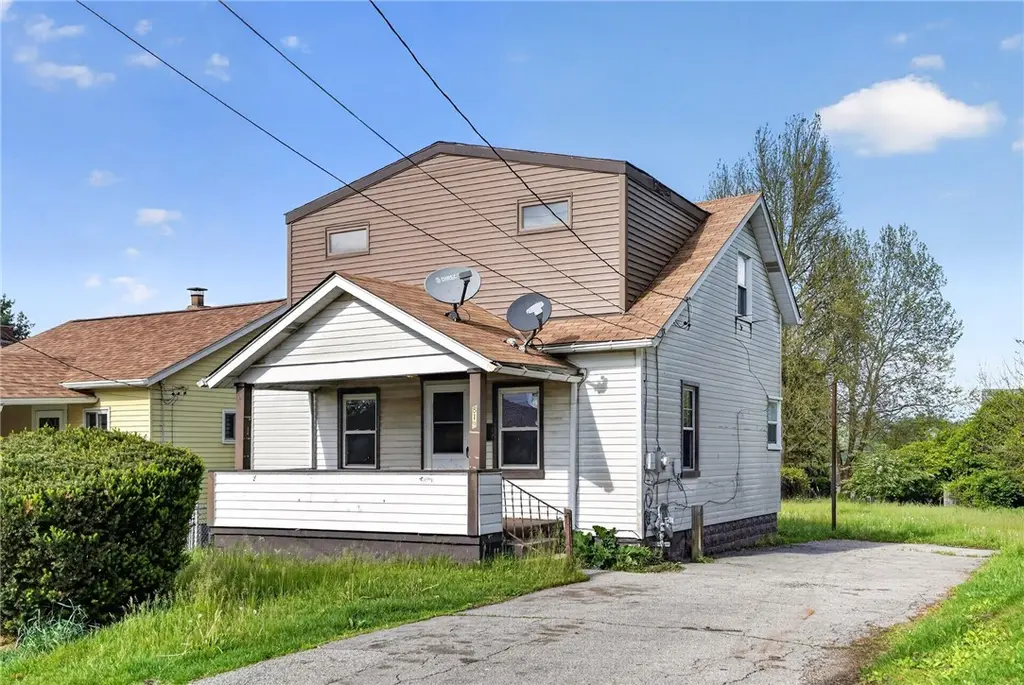
819 Monterey St · Duquesne, PA
Flood risk 1/10 · Minimal
- FEMA flood zone
- X (unshaded)
- Chance of flooding over 30 yrs
- 0.0%
- Est. flood insurance / yr
- $473 – $860
Fire risk 1/10 · Minimal
- Est. fire insurance / yr
- $511 – $949
Heat risk 4/10 · Minor
- Hot days now (above 97°F)
- 7 days/yr
- Hot days in 30 yrs
- 18 days/yr
Wind risk 2/10 · Minimal
- Chance of severe wind over 30 yrs
- 0.0%
Air-quality risk 4/10 · Minor
- Unhealthy air days now
- 4 days/yr
- Unhealthy air days in 30 yrs
- 5 days/yr
Risk factors via First Street. Map © Google.
Why this score? — see what drove the B+ grade
The composite is a weighted blend of 9 inputs, each scored 0–100. Each bar is that input's sub-score; the figure is the points it added to the 100-point composite (weight × sub-score).
- Cash flow +30.0/30.0
- ARV discount +15.0/15.0
- DSCR +10.0/10.0
- 1% rule +9.9/10.0
- Livability +3.4/5.0
- Rent growth +2.5/5.0
- Condition / age +2.5/5.0
- Appreciation +2.1/10.0
- Schools +1.3/10.0
$74,900
🖨 Deal sheet 📄 Offer letter ✓ Due diligence
Listing remarks MLS
NICE FAMILY HM W/ FENCE BACK YD, GARDEN. FRONT PORCH, NEW NEUTRAL WW, CIRC BRKRS, COUNTRY KITCHEN, WOOD CABINETS, BUILT-IN
Key facts
- Public transit
- Rear yard
- Kennywood area
Tags
Property features AI
Exterior
- Parking: Off-street parking for 4 vehicles
- Utilities: Public water; Public sewer
- Home design: 2-story home; Resale property; Composition roof; Aluminum siding with frame construction
- Construction: Aluminum siding; Frame construction; Composition roof
- Exterior features: Lot approximately 0.157 acres
Interior
- Kitchen: Main-level kitchen approx. 13 x 9
- Bedrooms: Upper-level bedrooms (two): one approx. 8 x 18, one approx. 13 x 15; Main-level bedroom approx. 10 x 10
- Flooring: Carpet; Vinyl
- Bathrooms: 1 full bathroom
- Heating & cooling: Forced-air heating (gas)
- Interior features: Carpet and vinyl flooring; Full basement
Neighborhood map
What this means for you Summary
Snapshot
- This is a 3-bed/1.0-bath single-family listed at $75k.
Deal economics
- At list price, monthly cash flow is $372 ($4k/yr) — positive.
- The deal already cash-flows at list — no discount required.
- Meets the 1% rule at list price ($1k rent vs $75k).
Location & tenants
- Location reads 68/100 on livability (#927 in PA) — a middle-class / working-renter tenant base. Strengths: commute A+, cost of living A+, housing A+; Watch: health & safety D+, schools F, crime F.
- Duquesne City SD (suburban): math 10% / reading 15% proficiency, ranked #611 of 658 in PA (top 93%) — low school quality limits family demand, transient renter base, plan for 1-2y turnover; 97% free/reduced lunch — lower-income household profile, screen leases tightly.
- Market conditions: 19 active listings in the ZIP; 8 comparable units currently listed for rent nearby; rentals at typical pace (median 24d on market — plan ~3-4 weeks tenant-placement turnaround); 2,996 units permitted in Allegheny County in 2024 (1,588 in 5+ unit buildings).
Forward outlook
- Local home prices are declining (-3.0%/yr); year-one equity from $518 of loan paydown is wiped out by about $2k of value loss. Plan a longer hold.
- At projected returns (-3.0% appreciation + 3.0% rent growth), your $21k cash investment doubles in ~6 years — after that, you're playing with house money.
Negotiation context
- Only 6 days on market — expect competitive offers; lowballing is unlikely to land.
- 2 sale attempts since 31y ago with the ask held roughly flat each time — persistent listings suggest the price (not the market) is what's stuck; bring a comps-based counter.
- Current owner paid $29k; list at $75k implies a 158% gain — meaningful room to come down on a strong offer.
Risks & watch-outs
- Watch-outs: built in 1935 — expect roof / HVAC / electrical / plumbing capex.
Questions for the listing agent
- Built in 1935 — when were the roof, HVAC, electrical panel, plumbing, and water heater last replaced?
- Is there a deadline driving the sale (1031 exchange, divorce, estate, relocation)? That informs how much negotiation room exists.
- Schools are F-rated, which usually means shorter tenancies and higher turnover. Who's the typical renter profile here, and what's been the actual vacancy rate?
- Crime grade is F in this area — have there been break-ins, vandalism, or insurance claims at this property in the last 3 years? What carrier currently insures it and at what premium?
- What's the average days-on-market for RENTAL listings here right now (not sales)? A rising rental-DOM trend means longer vacancies and softer asking-rent achievability than the comps imply.
- What's the recent tenant-quality profile in this submarket — average credit score on applications, eviction rate, late-payment / NSF rate, and stable-employment percentage? A property-management company in the area should have these aggregated.
- How much new for-sale + rental construction is in the pipeline within 1–3 miles? Heavy new supply typically softens prices + rents 12–24 months out; constrained supply supports both.
Investment metrics
- 1% rule
- 1.49% ✓
- Cap rate
- 12.25%
- Cash-on-cash
- 21.28%
- DSCR
- 1.95
- GRM
- 5.6
CMA / ARV
- ARV (on-the-fly)
- $105,994
- Comps found
- 12
Show comp detail 12 sales within ~0.75 mi
| Address | Dist | Beds/Ba | Sqft | Sold | Price | $/sf | Match |
|---|---|---|---|---|---|---|---|
| 1406 Maryland Ave | 0.25mi | 2/1.5 (-1) | 962 (+3%) | 5mo | $90,000 | $94 | 73 |
| 412 Viola Ave | 0.44mi | 2/1.0 (-1) | 930 (-1%) | 9mo | $42,500 | $46 | 65 |
| 1403 Maryland Ave | 0.25mi | 2/1.5 (-1) | 904 (-4%) | 12mo | $102,500 | $113 | 65 |
| 719 Catharine St | 0.24mi | 2/1.0 (-1) | 876 (-7%) | 12mo | $25,000 | $29 | 63 |
| 920 Maryland Ave | 0.12mi | 2/1.0 (-1) | 1,020 (+9%) | 16mo | $63,000 | $62 | 62 |
| 1728 Iowa Ave | 0.50mi | 2/1.0 (-1) | 900 (-4%) | 7mo | $65,000 | $72 | 59 |
| 1705 Texas Ave | 0.40mi | 2/1.0 (-1) | 1,053 (+12%) | 4mo | $31,900 | $30 | 53 |
| 1815 Iowa Ave | 0.56mi | 2/1.5 (-1) | 990 (+6%) | 14mo | $150,000 | $152 | 46 |
| 2002 Vermont Ave | 0.69mi | 2/1.0 (-1) | 1,056 (+13%) | 2mo | $155,000 | $147 | 40 |
| 1808 Vermont Ave | 0.53mi | 3/2.0 | 1,074 (+14%) | 8mo | $230,000 | $214 | 40 |
| 1721 Iowa Ave, | 0.47mi | 2/1.0 (-1) | 800 (-15%) | 10mo | $140,000 | $175 | 40 |
| 1818 Bluff St | 0.66mi | 2/1.0 (-1) | 1,056 (+13%) | 11mo | $135,000 | $128 | 35 |
Match score weights: distance 35% · size 25% · config 20% · recency 20%. Top-matched comps best support the ARV.
Projected returns pro-forma
-3.0% appreciation · 3.0% rent growth · sell at horizon
- IRR
- 13.8%
- Equity multiple
- 1.55×
- Total profit
- $11,568
- Equity at exit
- $11,168
- IRR
- 22.6%
- Equity multiple
- 2.94×
- Total profit
- $40,635
- Equity at exit
- $6,476
Cash invested: $20,972 (down + closing). Projections, not guarantees.
Landlord ↔ Tenant lean methodology
- Overall (STATE)
- 62 Landlord-Friendly
- State Pennsylvania
- 62 Landlord-Friendly · EVEN
- County
- — inherits STATE
- City
- — inherits STATE
ZIP-level market 15110
- Home prices YoY
- -4.0%
- Active inventory
- 19
- Price-to-rent
- 5.6×
Monthly cashflow live
- Estimated rent
- $1,119 high interval (Pro) →
- Mortgage (P&I)
- −$393
- Tax from tax record
- −$88 /mo · $1,059/yr
- Insurance
- −$31
- HOA
- −$0
- Vacancy / Maint / Mgmt
- −$235
- Net cashflow
- $372
Break-even live
UW: 25.0% down · 7.5% · 30yr · 1.5% tax · 5.0% vac · 8.0% maint · 8.0% mgmt
Financing live
Cash to close
- Down payment
- $18,725
- Closing costs
- $2,247
- Reserves months
- —
- Total cash needed
- —
Loan-product check · same deal, 3 products live
Conventional
25% down · 7.5% · 30yr
- Down + closing
- —
- Monthly P&I
- —
- Monthly cashflow
- —
- DSCR
- —
- Eligible?
- —
Personal DTI + credit; lowest rate.
DSCR
20% down · 8.5% · 30yr
- Down + closing
- —
- Monthly P&I
- —
- Monthly cashflow
- —
- DSCR
- —
- Eligible?
- —
No personal income docs; deal must DSCR.
Hard money
10% down · 12.0% · 12mo
- Down + closing
- —
- Monthly P&I
- —
- Monthly cashflow
- —
- DSCR
- —
- Eligible?
- —
Short-term bridge; refi at stabilization.
Rent comps 8 comps
| Address | Beds | Baths | Sqft | Rent | $/sqft | DOM | Units | Dist |
|---|---|---|---|---|---|---|---|---|
| 1010 Savey St Duquesne, PA | 2.0 | 1.0 | 1000 | $1,200 | $1.20 | 44d | 1 | 0.14mi |
| 207 Auriles St Duquesne, PA | 2.0 | 1.0 | 950 | $950 | $1.00 | 44d | 1 | 0.31mi |
| 1744 Highland Ave West Mifflin, PA | 2.0 | 1.0 | 1100 | $1,549 | $1.41 | 4d | 1 | 0.48mi |
| 604 Shaw Ave Unit 101 McKeesport, PA | 2.0 | 1.5 | 1050 | $900 | $0.86 | 14d | 1 | 1.08mi |
| 604 Shaw Ave McKeesport, PA | 2.0 | 1.0–1.5 | 800 | $900 | $1.12 | 12d | 3 | 1.08mi |
| 510 E Pittsburgh McKeesport Blvd Unit 1 North Versailles Township, PA | 2.0 | 1.0 | 663 | $950 | $1.43 | 23d | 1 | 1.23mi |
| 1114-1116 Ohio St Unit 2R McKeesport, PA | 2.0 | 1.0 | 878 | $850 | $0.97 | 16d | 1 | 1.37mi |
| 3101 Homestead Duquesne Rd West Mifflin, PA | 2.0 | 1.0 | 924 | $900 | $0.97 | 44d | 1 | 1.48mi |
Listing history 6 events
-
2026-06-18days on market $74,900 Active 6 DOM
-
2026-06-17days on market $74,900 Active 5 DOM
-
2026-06-16days on market $74,900 Active 4 DOM
-
2026-06-15days on market $74,900 Active 3 DOM
-
2026-06-13remarks 699-char remark
-
2026-06-13$74,900 Active 1 DOM
ⓘ Source: listings_history table (triggers on properties + properties_extension) + one-shot
backfill from property_details.listing_events for pre-trigger history.
Tax reassessment forecast PA · Partial reset (capped growth)
- Current annual tax
- $1,059 · $88/mo
- Projected year-2 tax
- $1,121 · $93/mo
- Expected delta
- +$62/yr (+$5/mo · 5.9%)
ⓘ Screening estimate from a state-policy table — verify with the county assessor before closing.
Climate risk First Street
- Flood 1/10 Low FEMA zone X (unshaded) · 0% chance over 30 yrs
- Wildfire 1/10 Low
- Heat 4/10 Moderate 7 d/yr ≥97°F today · 18 d/yr by 30 yrs out
- Wind 2/10 Low 0% chance of damaging wind over 30 yrs
- Air quality 4/10 Moderate 4 unhealthy d/yr today · 5 by 30 yrs out
Nearby sold comps map
Loading sold comps map…
Walkable amenities ~0.75 mi
Loading nearby amenities…
Taxation est. · year 1
- Rental income
- $13,431
- − Mortgage interest
- −$4,196
- − Property taxes
- −$1,059
- − Insurance
- −$374
- − Repairs & maintenance
- −$1,074
- − Management
- −$1,074
- − Depreciation
- −$2,179
- Taxable income
- $3,474
- Est. tax owed @ 24.0%
- −$834
- After-tax cash flow
- $3,630/yr
For passive investors: Depreciation is non-cash, so a rental often shows a tax loss while cash-flowing — sheltering income. Rental losses are passive: they offset passive income freely, and up to $25,000/yr can offset ordinary (W-2) income if you actively participate and your MAGI is under $100k (phasing out to $0 by $150k); unused losses carry forward. On sale, claimed depreciation is recaptured at up to 25%, and gains may owe capital-gains tax (a 1031 exchange can defer both). Figures are a year-1 estimate at your 24.0% rate — not tax advice; consult a CPA.
Schools (NCES district)
- District
- Duquesne City SD
- NCES district ID
- 4208010
- Math proficiency
- 10% ▲ 4.00%
- Reading proficiency
- 15% ▬ 0.00%
- Median HH income
- $24,173
- Composite
- 12.77/100
- National rank
- #14546
- State rank
- #611 of 658 in PA
Livability — Duquesne
- Score
- 68/100
- State rank
- #927
- US rank
- #10089
Category grades
Schools grade is shown separately in the Schools card above.
Census & demographics
- Census place
- Duquesne, PA
- City population
- 5,186
- Population (ZIP)
- 5,186
Population outlook (Allegheny County) Hauer SSP2
- Today (2025)
- 1,250,282 people
- By 2030
- 1,256,482 · +0.5%
- By 2040
- 1,256,318 · +0.5%
- By 2050
- 1,244,169 · -0.5%
- By 2075
- 1,197,693 · -4.2%
- By 2100
- 1,093,187 · -12.6%
Race, ethnicity, and origin ACS 2023
- Neighborhood character
- Diverse neighborhood (Simpson 0.67)
- Race & ethnicity
- Black 44% White 37% Two or more races 16% Hispanic / Latino 3%
- Common ancestry
- Romanian 3% Lithuanian 2% Slovene 1%
- Foreign-born
- 1% · Canada
- Languages at home
- 96% English-only · Spanish 3%
Political lean MEDSL · Allegheny
- 2024 margin
- Strong D (+20.3) · D 59.7% · R 39.4%
- 2008→2024 swing
- +4.8pp toward D · 2008: 15.5pp · 2024: 20.3pp
- All cycles
- 2024: D+20.3 2020: D+20.4 2016: D+16.4 2012: D+14.4 2008: D+15.5
Not yet ingested
- Civics
- —
Market trends
- HPI YoY
- ▼ -5.75%
- Current HPI
- 138.4974
- Rent YoY
- —
- Metro
- —
- State GDP YoY
- ▲ 1.68%
- F500 in state
- 34
Industry mix (Fortune 500 HQ in PA)
| Industry | F500 HQs | Revenue |
|---|---|---|
| Healthcare | 2 | $309B |
|
||
| Insurance | 2 | $27B |
|
||
| Telecommunications / Media | 1 | $124B |
|
||
| Industrial Distribution | 1 | $22B |
|
||
| Financial Services | 1 | $20B |
|
||
| Chemicals / Materials | 1 | $18B |
|
||
Price history
+499.2% since first listed6 events — show timeline
- 2026-06-12 Listed $74,900 West Penn MLS
- 2021-12-23 Sold (Public Records) $29,000 Public Records
- 1996-03-26 Sold (Public Records) $16,000 Public Records
- 1996-03-25 Sold (MLS) $16,000 West Penn MLS
- 1995-08-08 Listed $19,900 West Penn MLS
- 1975-07-02 Sold (Public Records) $12,500 Public Records
Property tax history
+3.5%/yrLatest (2026): $1,059 · +2.9% YoY. Source: county tax records.
Cash-flow waterfall
monthlySold comps — $/sqft
last 12 mo · ≤1 miLoading sold comps…