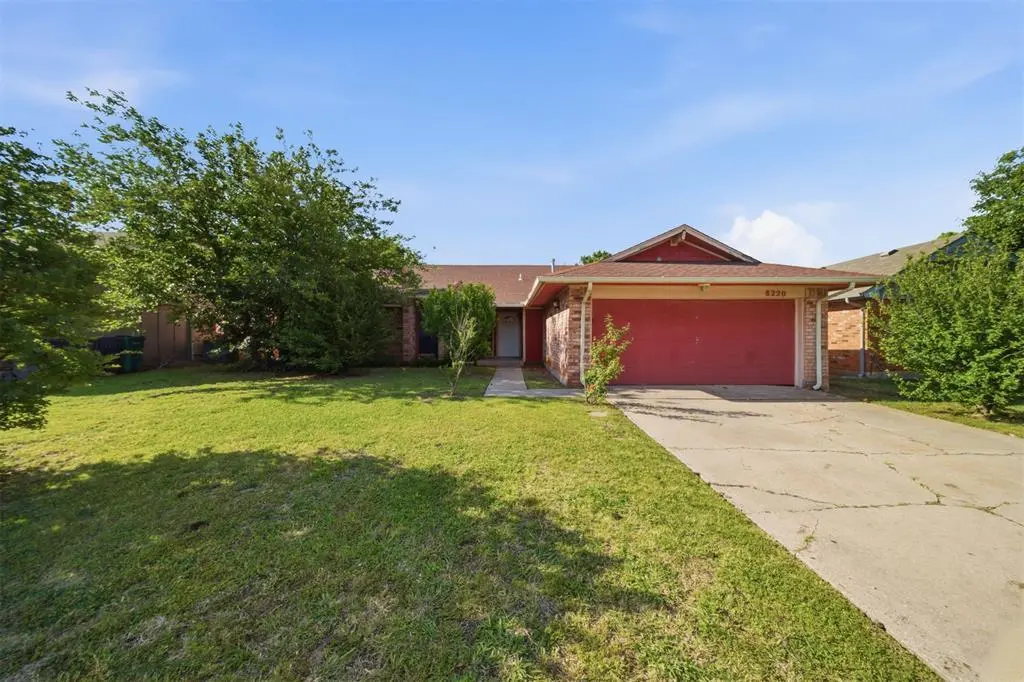
8220 NW 112th Ter · Oklahoma City, OK
Flood risk 1/10 · Minimal
- FEMA flood zone
- X (unshaded)
- Chance of flooding over 30 yrs
- 0.0%
- Est. flood insurance / yr
- $507 – $1,088
Fire risk 3/10 · Minor
- Est. fire insurance / yr
- $2,463 – $4,575
Heat risk 6/10 · Moderate
- Hot days now (above 107°F)
- 7 days/yr
- Hot days in 30 yrs
- 19 days/yr
Wind risk 2/10 · Minimal
- Chance of severe wind over 30 yrs
- 2.0%
Air-quality risk 1/10 · Minimal
- Unhealthy air days now
- 0 days/yr
- Unhealthy air days in 30 yrs
- 0 days/yr
Risk factors via First Street. Map © Google.
Why this score? — see what drove the C+ grade
The composite is a weighted blend of 9 inputs, each scored 0–100. Each bar is that input's sub-score; the figure is the points it added to the 100-point composite (weight × sub-score).
- Cash flow +22.9/30.0
- ARV discount +15.0/15.0
- DSCR +7.4/10.0
- 1% rule +6.0/10.0
- Livability +4.0/5.0
- Rent growth +3.9/5.0
- Condition / age +2.5/5.0
- Schools +1.3/10.0
- Appreciation +0.0/10.0
$169,900
🖨 Deal sheet 📄 Offer letter ✓ Due diligence
Listing remarks MLS
What a buy in NW OKC!! 2 living and 2 dining!! Good size bedrooms!! This won't last long!! Home needs a little TLC but look at the price!! Proof of funds required!! Home is priced as-is!!
Key facts
- 7,802 sq ft lot
- 2 garage spots
- Built 1981
Property features AI
Finance
- Other: Lot listed with other lot features
- Financial info: Listing offered as-is; Cash-only terms indicated; Not assumable; Does not qualify for loan (per listing)
- HOA & community: No mandatory association dues
Exterior
- Parking: 2-car garage
- Utilities: No homestead indicated
- Home design: Single family residence; One-level home; Residential property; Located in Eagle Ridge addition
- Construction: Brick construction; Other roof type; Slab foundation; Existing property
- Exterior features: No notable exterior features listed; Storm shelter (other type)
Interior
- Kitchen: Kitchen approximately 10 x 12
- Bedrooms: 3 bedrooms total; Primary bedroom approximately 13 x 18; Bedroom approximately 13 x 14; Bedroom approximately 11 x 14
- Bathrooms: 2 full bathrooms
- Heating & cooling: Electric heating
- Interior features: Two living areas; One fireplace (other type)
Neighborhood map
What this means for you Summary
Snapshot
- This is a 3-bed/2.0-bath single-family listed at $170k.
Deal economics
- At list price, monthly cash flow is $300 ($4k/yr) — positive.
- The deal already cash-flows at list — no discount required.
- Meets the 1% rule at list price ($2k rent vs $170k).
- Recommended offer: $167k (1.5% below list) — sets the bar for market timing.
- Cap rate 8.4% vs local median 3.7% in Oklahoma City — top-decile yield for the area; either an underpriced asset or a hidden risk that comps aren't pricing in. Stress-test before assuming the spread holds.
Location & tenants
- Location reads 80/100 on livability (#3 in OK, #1,635 nationally) — a professional / high-income tenant draw. Strengths: amenities A+, commute A+, cost of living A+; Watch: crime F.
- Putnam City (urban): math 12% / reading 16% proficiency, ranked #227 of 270 in OK (top 84%) — low school quality limits family demand, transient renter base, plan for 1-2y turnover; 65% free/reduced lunch — lower-income household profile, screen leases tightly.
- Zoned schools: Dennis Es (math 27% / reading 27%, grade F, #311 of 845 statewide, top 40%, 513 students, 0% FRL); Putnam City North Hs (math 18% / reading 29%, grade F, #218 of 447 statewide, top 49%, 1,579 students, 0% FRL) — zoned schools average 0% FRL vs 65% district-wide (65 pts lower); this property's tenant base skews higher-income than the district average.
- Market conditions: Rents rising fast (+5.6%/yr); 166 active listings in the ZIP; 36 comparable units currently listed for rent nearby; rentals at typical pace (median 16d on market — plan ~3-4 weeks tenant-placement turnaround); solid renter incomes; 5,365 units permitted in Oklahoma County in 2024 (569 in 5+ unit buildings).
Forward outlook
- Local home prices are declining (-3.0%/yr); year-one equity from $1k of loan paydown is wiped out by about $5k of value loss. Plan a longer hold.
- Oklahoma County population projected at +41% by 2050 — long-run rental-demand tailwind backs the buy-and-hold thesis.
- At projected returns (-3.0% appreciation + 5.6% rent growth), your $48k cash investment doubles in ~10 years — after that, you're playing with house money.
Negotiation context
- It's been on market 28 days — a 2% lower offer ($167k) is reasonable based on typical stale-listing flexibility.
- 3 sale attempts since 11y ago; this cycle's ask has dropped $15k (8%) from the opening price — seller is motivated, your offer sets the floor, not the list.
- Current owner paid $100k; list at $170k implies a 70% gain — meaningful room to come down on a strong offer.
Risks & watch-outs
- Climate carrying-cost: extreme-heat days projected 7→19/yr by 2055 (HVAC capex compounding) — expect insurance premiums to compound above CPI over the hold.
Questions for the listing agent
- Is there a deadline driving the sale (1031 exchange, divorce, estate, relocation)? That informs how much negotiation room exists.
- Schools are F-rated, which usually means shorter tenancies and higher turnover. Who's the typical renter profile here, and what's been the actual vacancy rate?
- Crime grade is F in this area — have there been break-ins, vandalism, or insurance claims at this property in the last 3 years? What carrier currently insures it and at what premium?
- What's the average days-on-market for RENTAL listings here right now (not sales)? A rising rental-DOM trend means longer vacancies and softer asking-rent achievability than the comps imply.
- What's the recent tenant-quality profile in this submarket — average credit score on applications, eviction rate, late-payment / NSF rate, and stable-employment percentage? A property-management company in the area should have these aggregated.
- How much new for-sale + rental construction is in the pipeline within 1–3 miles? Heavy new supply typically softens prices + rents 12–24 months out; constrained supply supports both.
Investment metrics
- 1% rule
- 1.10% ✓
- Cap rate
- 8.41%
- Cash-on-cash
- 7.56%
- DSCR
- 1.34
- GRM
- 7.6
CMA / ARV
- ARV (on-the-fly)
- $274,134
- Comps found
- 12
Show comp detail 12 sales within ~0.75 mi
| Address | Dist | Beds/Ba | Sqft | Sold | Price | $/sf | Match |
|---|---|---|---|---|---|---|---|
| 8317 NW 113th St | 0.13mi | 3/2.0 | 2,259 (+0%) | 0mo | $269,000 | $119 | 92 |
| 8400 NW 111th St | 0.22mi | 3/2.0 | 2,308 (+3%) | 2mo | $274,000 | $119 | 84 |
| 11408 Windmill Rd | 0.12mi | 3/2.0 | 2,463 (+10%) | 0mo | $168,000 | $68 | 78 |
| 8037 Willow Creek Blvd | 0.35mi | 3/2.0 | 2,194 (-2%) | 2mo | $249,000 | $113 | 78 |
| 8516 NW 111th St | 0.35mi | 4/2.0 (+1) | 2,139 (-5%) | 3mo | $327,500 | $153 | 69 |
| 8321 NW 113th Ter | 0.17mi | 3/2.0 | 1,962 (-13%) | 3mo | $245,000 | $125 | 68 |
| 8116 NW 119th St | 0.44mi | 3/2.0 | 2,009 (-11%) | 2mo | $245,000 | $122 | 60 |
| 8600 NW 111th St | 0.37mi | 3/3.0 | 2,500 (+11%) | 1mo | $438,000 | $175 | 59 |
| 8720 NW 109th Ter | 0.65mi | 4/2.0 (+1) | 2,184 (-3%) | 2mo | $369,900 | $169 | 58 |
| 11920 Skyway Ave | 0.62mi | 3/2.0 | 2,476 (+10%) | 1mo | $289,000 | $117 | 53 |
| 8913 NW 113th St | 0.66mi | 3/2.0 | 2,018 (-10%) | 2mo | $290,000 | $144 | 50 |
| 8713 NW 107th St | 0.66mi | 4/2.5 (+1) | 2,494 (+11%) | 2mo | $305,000 | $122 | 43 |
Match score weights: distance 35% · size 25% · config 20% · recency 20%. Top-matched comps best support the ARV.
Projected returns pro-forma
-3.0% appreciation · 5.59% rent growth · sell at horizon
- IRR
- -1.9%
- Equity multiple
- 0.93×
- Total profit
- $-3,423
- Equity at exit
- $25,333
- IRR
- 10.5%
- Equity multiple
- 1.91×
- Total profit
- $43,306
- Equity at exit
- $14,690
Cash invested: $47,572 (down + closing). Projections, not guarantees.
Landlord ↔ Tenant lean methodology
- Overall (STATE)
- 83 Strongly Landlord-Friendly
- State Oklahoma
- 83 Strongly Landlord-Friendly · R+20
- County
- — inherits STATE
- City
- — inherits STATE
ZIP-level market 73162
- Rents YoY
- 5.6%
- Active inventory
- 166
- Price-to-rent
- 7.6×
Monthly cashflow live
- Estimated rent
- $1,866 high interval (Pro) →
- Mortgage (P&I)
- −$891
- Tax from tax record
- −$213 /mo · $2,552/yr
- Insurance
- −$71
- HOA
- −$0
- Vacancy / Maint / Mgmt
- −$392
- Net cashflow
- $300
Break-even live
UW: 25.0% down · 7.5% · 30yr · 1.5% tax · 5.0% vac · 8.0% maint · 8.0% mgmt
Financing live
Cash to close
- Down payment
- $42,475
- Closing costs
- $5,097
- Reserves months
- —
- Total cash needed
- —
Loan-product check · same deal, 3 products live
Conventional
25% down · 7.5% · 30yr
- Down + closing
- —
- Monthly P&I
- —
- Monthly cashflow
- —
- DSCR
- —
- Eligible?
- —
Personal DTI + credit; lowest rate.
DSCR
20% down · 8.5% · 30yr
- Down + closing
- —
- Monthly P&I
- —
- Monthly cashflow
- —
- DSCR
- —
- Eligible?
- —
No personal income docs; deal must DSCR.
Hard money
10% down · 12.0% · 12mo
- Down + closing
- —
- Monthly P&I
- —
- Monthly cashflow
- —
- DSCR
- —
- Eligible?
- —
Short-term bridge; refi at stabilization.
Rent comps 36 comps
| Address | Beds | Baths | Sqft | Rent | $/sqft | DOM | Units | Dist |
|---|---|---|---|---|---|---|---|---|
| 8301 NW 112th St Oklahoma City, OK | 3.0 | 2.0 | 1720 | $1,625 | $0.94 | 23d | 1 | 0.07mi |
| 8312 NW 112th St Oklahoma City, OK | 3.0 | 2.0 | 2284 | $1,700 | $0.74 | 23d | 1 | 0.11mi |
| 11629 Kings Cir Oklahoma City, OK | 4.0 | 2.0 | 2082 | $1,950 | $0.94 | 2d | 1 | 0.25mi |
| 8024 NW 110th Dr Oklahoma City, OK | 3.0 | 2.0 | 1445 | $1,695 | $1.17 | 23d | 1 | 0.38mi |
| 8609 NW 113th Ct Oklahoma City, OK | 3.0 | 2.0 | 1800 | $2,000 | $1.11 | 23d | 1 | 0.39mi |
| 8016 NW 110th Dr Oklahoma City, OK | 3.0 | 2.0 | 1445 | $1,695 | $1.17 | 11d | 1 | 0.39mi |
| 8000 NW 110th Dr Oklahoma City, OK | 3.0 | 2.0 | 1445 | $1,745 | $1.21 | 14d | 1 | 0.41mi |
| 12216 Sylvester Dr Oklahoma City, OK | 3.0 | 2.0 | 2052 | $1,845 | $0.90 | 23d | 1 | 0.58mi |
| 12100 Blueway Ave Oklahoma City, OK | 3.0 | 2.0 | 2496 | $2,099 | $0.84 | 2d | 1 | 0.60mi |
| 12213 Sylvester Dr Oklahoma City, OK | 4.0 | 3.0 | 2441 | $2,050 | $0.84 | 4d | 1 | 0.61mi |
| 12213 Sylvester Dr Oklahoma City, OK | 4.0 | 3.0 | 2441 | $2,050 | $0.84 | 14d | 1 | 0.61mi |
| 8816 NW 114th St Oklahoma City, OK | 3.0 | 2.0 | 2013 | $2,200 | $1.09 | 4d | 1 | 0.62mi |
| 10522 Harvest Moon Ave Oklahoma City, OK | 3.0 | 2.5 | 1500 | $1,395 | $0.93 | 23d | 1 | 0.63mi |
| 8521 NW 121st St Oklahoma City, OK | 4.0 | 2.0 | 2417 | $1,999 | $0.83 | 2d | 1 | 0.66mi |
| 8824 NW 109th Ln Oklahoma City, OK | 3.0 | 2.5 | 1520 | $1,745 | $1.15 | 23d | 1 | 0.69mi |
| 8027 NW 104th St Oklahoma City, OK | 2.0 | 2.0 | 1570 | $1,395 | $0.89 | 3d | 1 | 0.72mi |
| 8821 NW 120th St Oklahoma City, OK | 4.0 | 3.0 | 2880 | $2,025 | $0.70 | 23d | 1 | 0.74mi |
| 8922 NW 109th Ter Oklahoma City, OK | 3.0 | 2.5 | 1412 | $1,600 | $1.13 | 23d | 1 | 0.77mi |
| 9113 NW 121st St Yukon, OK | 4.0 | 2.0 | 1650 | $1,986 | $1.20 | 23d | 1 | 1.07mi |
| 9777 N Council Rd Oklahoma City, OK | 3.0 | 2.0 | 1421 | $1,539 | $1.08 | 16d | 1 | 1.07mi |
| 7136 NW 115th St Unit 7138 Oklahoma City, OK | 3.0 | 2.0 | 1489 | $1,325 | $0.89 | 23d | 1 | 1.16mi |
| 7137 NW 116th St Unit 7137 Oklahoma City, OK | 3.0 | 2.0 | 1465 | $1,350 | $0.92 | 23d | 1 | 1.17mi |
| 7420 NW 126th St Oklahoma City, OK | 3.0 | 2.0 | 1580 | $1,600 | $1.01 | 23d | 1 | 1.21mi |
| 12829 High Plains Ave Oklahoma City, OK | 3.0 | 2.5 | 2006 | $2,195 | $1.09 | 2d | 1 | 1.24mi |
| 9109 NW 127th St Oklahoma City, OK | 3.0 | 2.0 | 1400 | $1,845 | $1.32 | 21d | 1 | 1.26mi |
| 9109 NW 127th St Oklahoma City, OK | 3.0 | 2.0 | 1400 | $1,845 | $1.32 | 23d | 1 | 1.26mi |
| 11620 Krew Way Yukon, OK | 4.0 | 2.0 | 1459 | $1,725 | $1.18 | 2d | 1 | 1.27mi |
| 12721 Cortona Ter Yukon, OK | 4.0 | 2.0 | 1650 | $2,095 | $1.27 | 23d | 1 | 1.28mi |
| 11625 Krew Way Yukon, OK | 4.0 | 2.0 | 1459 | $1,595 | $1.09 | 4d | 1 | 1.30mi |
| 12709 Torretta Way Yukon, OK | 4.0 | 2.5 | 1903 | $2,210 | $1.16 | 4d | 1 | 1.44mi |
| 12816 Torretta Way Yukon, OK | 4.0 | 2.0 | 1459 | $1,730 | $1.19 | 4d | 1 | 1.44mi |
| 12836 Torretta Way Yukon, OK | 4.0 | 2.0 | 2065 | $2,070 | $1.00 | 10d | 1 | 1.44mi |
| 12812 Torretta Way Yukon, OK | 4.0 | 2.0 | 2065 | $2,070 | $1.00 | 4d | 1 | 1.44mi |
| 12845 Torretta Way Yukon, OK | 4.0 | 2.0 | 1459 | $1,745 | $1.20 | 11d | 1 | 1.46mi |
| 12845 Torretta Way Yukon, OK | 4.0 | 2.0 | 1459 | $1,745 | $1.20 | 17d | 1 | 1.46mi |
| 13512 Vinita Dr Oklahoma City, OK | 3.0 | 2.5 | 1573 | $1,695 | $1.08 | 2d | 1 | 1.49mi |
Listing history 32 events
-
2026-06-13statusdays on market $169,900 Pending 28 DOM
-
2026-06-09days on market $169,900 Active 25 DOM
-
2026-06-08days on market $169,900 Active 24 DOM
-
2026-06-07days on market $169,900 Active 23 DOM
-
2026-06-03days on market $169,900 Active 19 DOM
-
2026-06-02days on market $169,900 Active 18 DOM
-
2026-06-01days on market $169,900 Active 17 DOM
-
2026-05-31days on market $169,900 Active 16 DOM
-
2026-05-15$185,000 Active
-
2026-03-15historical $1,715
-
2026-03-10price $1,715
-
2026-03-09price $1,750
-
2026-03-08price $1,745
-
2026-03-03price $1,715
-
2026-03-02price $1,750
-
2026-03-01price $1,745
-
2026-02-28price $1,740
-
2026-02-27price $1,735
-
2026-02-26price $1,730
-
2026-02-21price $1,735
-
2026-02-20price $1,770
-
2026-02-19price $1,765
-
2026-02-18price $1,760
-
2026-02-17price $1,795
-
2026-02-16price $1,790
-
2026-02-13price $1,785
-
2026-02-06price $1,810
-
2026-02-04$1,815
-
2015-03-10soldstatus $100,000
-
2015-03-09soldstatus $100,000 189-char remark
Show marketing remark (189 chars)
What a buy in NW OKC!! 2 living and 2 dining!! Good size bedrooms!! This won't last long!! Home needs a little TLC but look at the price!! Proof of funds required!! Home is priced as-is!!
-
2015-01-20$99,900 189-char remark
Show marketing remark (189 chars)
What a buy in NW OKC!! 2 living and 2 dining!! Good size bedrooms!! This won't last long!! Home needs a little TLC but look at the price!! Proof of funds required!! Home is priced as-is!!
-
1988-09-30soldstatus $57,000
ⓘ Source: listings_history table (triggers on properties + properties_extension) + one-shot
backfill from property_details.listing_events for pre-trigger history.
Tax reassessment forecast OK · Resets to sale price
- Current annual tax
- $2,552 · $213/mo
- Projected year-2 tax
- $2,552 · $213/mo
- Expected delta
- $0/yr ($0/mo · 0.0%)
ⓘ Screening estimate from a state-policy table — verify with the county assessor before closing.
Climate risk First Street
- Flood 1/10 Low FEMA zone X (unshaded) · 0% chance over 30 yrs
- Wildfire 3/10 Moderate
- Heat 6/10 Major 7 d/yr ≥107°F today · 19 d/yr by 30 yrs out
- Wind 2/10 Low 2% chance of damaging wind over 30 yrs
- Air quality 1/10 Low 0 unhealthy d/yr today · 0 by 30 yrs out
Nearby sold comps map
Loading sold comps map…
Walkable amenities ~0.75 mi
Loading nearby amenities…
Taxation est. · year 1
- Rental income
- $22,393
- − Mortgage interest
- −$9,517
- − Property taxes
- −$2,552
- − Insurance
- −$850
- − Repairs & maintenance
- −$1,791
- − Management
- −$1,791
- − Depreciation
- −$4,943
- Taxable income
- $949
- Est. tax owed @ 24.0%
- −$228
- After-tax cash flow
- $3,369/yr
For passive investors: Depreciation is non-cash, so a rental often shows a tax loss while cash-flowing — sheltering income. Rental losses are passive: they offset passive income freely, and up to $25,000/yr can offset ordinary (W-2) income if you actively participate and your MAGI is under $100k (phasing out to $0 by $150k); unused losses carry forward. On sale, claimed depreciation is recaptured at up to 25%, and gains may owe capital-gains tax (a 1031 exchange can defer both). Figures are a year-1 estimate at your 24.0% rate — not tax advice; consult a CPA.
Schools (NCES district)
- District
- Putnam City
- NCES district ID
- 4025290
- Math proficiency
- 12% ▼ -18.00%
- Reading proficiency
- 16% ▼ -14.00%
- Median HH income
- $46,657
- Composite
- 12.61/100
- National rank
- #9614
- State rank
- #227 of 270 in OK
Livability — Oklahoma City
- Score
- 80/100
- State rank
- #3
- US rank
- #1635
Category grades
Schools grade is shown separately in the Schools card above.
Census & demographics
- Census place
- Oklahoma City, OK
- County
- Oklahoma County · 771,644 people
- City population
- 498,656
- Metro
- Oklahoma City, OK
- Population (ZIP)
- 28,728
- Household income
- $88,031
- Rent vs Own
- Severe rent burden
- 913.0
Population outlook (Oklahoma County) Hauer SSP2
- Today (2025)
- 911,875 people
- By 2030
- 982,413 · +7.7%
- By 2040
- 1,130,468 · +24.0%
- By 2050
- 1,288,422 · +41.3%
- By 2075
- 1,711,482 · +87.7%
- By 2100
- 2,088,448 · +129.0%
Race, ethnicity, and origin ACS 2023
- Neighborhood character
- Diverse neighborhood (Simpson 0.59)
- Race & ethnicity
- White 62% Black 14% Two or more races 11% Hispanic / Latino 8% Asian 6% Native American 2%
- Hispanic origin (detail)
- Mexican 5%
- Common ancestry
- Slovak 4% Italian 2% Serbian 1%
- Foreign-born
- 8% · Vietnam, Canada, China
- Languages at home
- 90% English-only · Spanish 4% Vietnamese 2% Other Asian/Pacific 1%
Political lean MEDSL · Oklahoma
- 2024 margin
- Toss-up / Even · D 48.0% · R 49.7% · Other 2.3%
- 2008→2024 swing
- +15.1pp toward D · 2008: -16.8pp · 2024: -1.7pp
- All cycles
- 2024: R+1.7 2020: R+1.1 2016: R+10.5 2012: R+16.7 2008: R+16.8
Not yet ingested
- Civics
- —
Market trends
- HPI YoY
- ▼ -172.35%
- Current HPI
- 205.6639
- Rent YoY
- ▲ 5.59%
- Metro
- Oklahoma City, OK
- State GDP YoY
- ▲ 1.55%
- F500 in state
- 6
Industry mix (Fortune 500 HQ in OK)
| Industry | F500 HQs | Revenue |
|---|---|---|
| Energy | 3 | $48B |
|
||
Price history
+224.6% since first listed24 events — show timeline
- 2026-05-15 Listed $185,000 MLSOK
- 2026-03-15 Rental Removed $1,715 RENTPROGRESS
- 2026-03-10 Price Changed $1,715 RENTPROGRESS
- 2026-03-09 Price Changed $1,750 RENTPROGRESS
- 2026-03-08 Price Changed $1,745 RENTPROGRESS
- 2026-03-03 Price Changed $1,715 RENTPROGRESS
- 2026-03-02 Price Changed $1,750 RENTPROGRESS
- 2026-03-01 Price Changed $1,745 RENTPROGRESS
- 2026-02-28 Price Changed $1,740 RENTPROGRESS
- 2026-02-27 Price Changed $1,735 RENTPROGRESS
- 2026-02-26 Price Changed $1,730 RENTPROGRESS
- 2026-02-21 Price Changed $1,735 RENTPROGRESS
- 2026-02-20 Price Changed $1,770 RENTPROGRESS
- 2026-02-19 Price Changed $1,765 RENTPROGRESS
- 2026-02-18 Price Changed $1,760 RENTPROGRESS
- 2026-02-17 Price Changed $1,795 RENTPROGRESS
- 2026-02-16 Price Changed $1,790 RENTPROGRESS
- 2026-02-13 Price Changed $1,785 RENTPROGRESS
- 2026-02-06 Price Changed $1,810 RENTPROGRESS
- 2026-02-04 Listed for Rent $1,815 RENTPROGRESS
- 2015-03-10 Sold (Public Records) $100,000 Public Records
- 2015-03-09 Sold (MLS) $100,000 MLSOK
- 2015-01-20 Listed $99,900 MLSOK
- 1988-09-30 Sold (Public Records) $57,000 Public Records
Property tax history
+3.1%/yrLatest (2025): $2,552 · +5.7% YoY. Source: county tax records.
Cash-flow waterfall
monthlySold comps — $/sqft
last 12 mo · ≤1 miLoading sold comps…