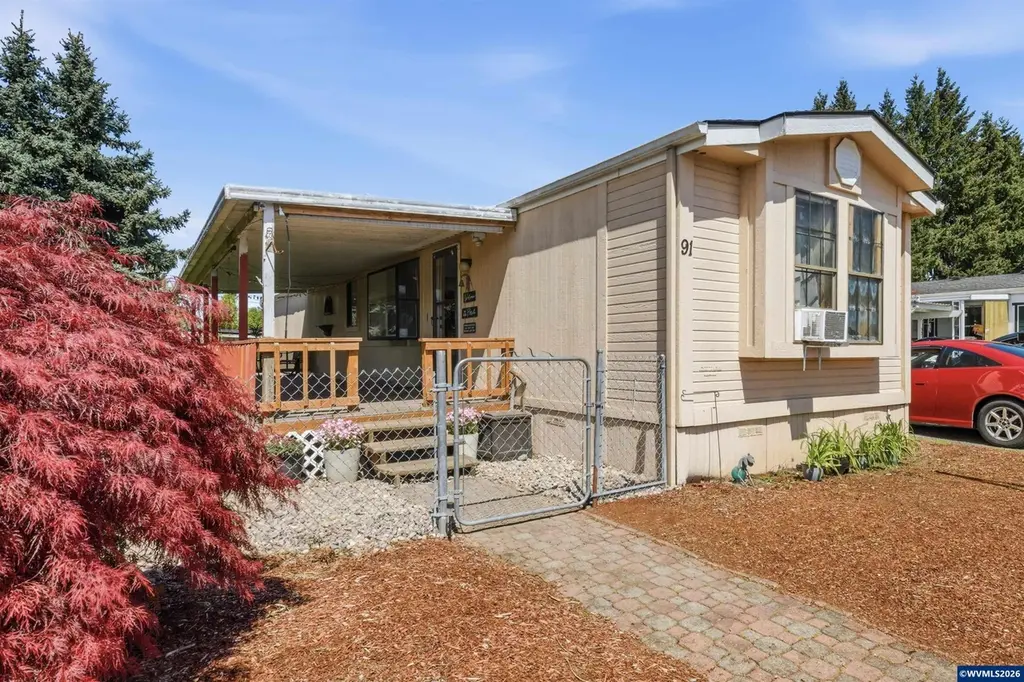
235 Edwards Rd S #91 · Monmouth, OR
Flood risk No data
- FEMA flood zone
- —
- Chance of flooding over 30 yrs
- —
- Est. flood insurance / yr
- —
Fire risk No data
- Est. fire insurance / yr
- —
Heat risk No data
- Hot days now (above threshold)
- —
- Hot days in 30 yrs
- —
Wind risk No data
- Chance of severe wind over 30 yrs
- —
Air-quality risk No data
- Unhealthy air days now
- —
- Unhealthy air days in 30 yrs
- —
Risk factors via First Street. Map © Google.
Why this score? — see what drove the B grade
The composite is a weighted blend of 9 inputs, each scored 0–100. Each bar is that input's sub-score; the figure is the points it added to the 100-point composite (weight × sub-score).
- Cash flow +30.0/30.0
- ARV discount +10.6/15.0
- 1% rule +10.0/10.0
- DSCR +10.0/10.0
- Livability +3.6/5.0
- Schools +3.1/10.0
- Rent growth +2.5/5.0
- Condition / age +2.5/5.0
- Appreciation +0.0/10.0
$75,000
🖨 Deal sheet 📄 Offer letter ✓ Due diligence
Listing remarks MLS
Upgraded kitchen cabinets, new stainless steel appliances, new floor coverings, new countertops in the kitchen and bathroom. Home located on end lot with a large deck and privacy hedge.
Key facts
- Short walk to parks
- Short walk to dining
- Fresh interior paint
Tags
Property features AI
Finance
- Other: Located in an all-ages park (Monmouth Mobile); Model: Silvercrest Cottage, Size: 14x66; Not in an adult-only park; Serial number available for the home
Exterior
- Parking: Carport; 1 garage space
- Utilities: City water; City sewer; Electric service
- Home design: Single-wide manufactured home; Located on a corner lot; Built in 1989
- Construction: T111 siding; Composition roof
- Exterior features: Covered deck; Yard shed
Interior
- Kitchen: Dishwasher; Electric range
- Flooring: Carpet; Vinyl
- Heating & cooling: Electric heating; Forced air; Central air conditioning
- Interior features: Dining area (combination); High-speed internet access available; Garbage disposal
- Laundry & utility: Electric water heater
Neighborhood map
What this means for you Summary
Snapshot
- This is a 2-bed/2.0-bath manufactured listed at $75k.
Deal economics
- At list price, monthly cash flow is $661 ($8k/yr) — positive.
- The deal already cash-flows at list — no discount required.
- Meets the 1% rule at list price ($1k rent vs $75k).
- Recommended offer: $73k (3.0% below list) — sets the bar for market timing.
- Cap rate 16.9% vs local median 2.6% in Monmouth — top-decile yield for the area; either an underpriced asset or a hidden risk that comps aren't pricing in. Stress-test before assuming the spread holds.
Location & tenants
- Location reads 72/100 on livability (#108 in OR) — a middle-class / working-renter tenant base. Strengths: crime A+, commute A+, housing B+; Watch: health & safety D+, amenities D, employment D.
- Central SD 13J (town): math 26% / reading 41% proficiency, ranked #149 of 183 in OR (top 81%) — families likely to look elsewhere, expect single-tenant / working-renter base with shorter leases.
- Zoned schools: Ash Creek Elementary School (473 students, 65% FRL); Central High School (1,100 students, 65% FRL).
- Market conditions: 67 active listings in the ZIP; 25 comparable units currently listed for rent nearby; rentals at typical pace (median 24d on market — plan ~3-4 weeks tenant-placement turnaround); 177 units permitted in Polk County in 2024 (14 in 5+ unit buildings).
Forward outlook
- Local home prices are declining (-3.0%/yr); year-one equity from $519 of loan paydown is wiped out by about $2k of value loss. Plan a longer hold.
- Polk County population projected at +25% by 2050 — long-run rental-demand tailwind backs the buy-and-hold thesis.
- At projected returns (-3.0% appreciation + 3.0% rent growth), your $21k cash investment doubles in ~4 years — after that, you're playing with house money.
Negotiation context
- It's been on market 51 days — a 3% lower offer ($73k) is reasonable based on typical stale-listing flexibility.
- 5 sale attempts since 18y ago with the ask held roughly flat each time — persistent listings suggest the price (not the market) is what's stuck; bring a comps-based counter.
- Current owner paid $15k; list at $75k implies a 400% gain — meaningful room to come down on a strong offer.
Questions for the listing agent
- It's been on market 51 days. Have you received any prior offers? Is the seller open to a 3% concession, seller financing, or rate buy-down credit?
- Is there a deadline driving the sale (1031 exchange, divorce, estate, relocation)? That informs how much negotiation room exists.
- What's the average days-on-market for RENTAL listings here right now (not sales)? A rising rental-DOM trend means longer vacancies and softer asking-rent achievability than the comps imply.
- What's the recent tenant-quality profile in this submarket — average credit score on applications, eviction rate, late-payment / NSF rate, and stable-employment percentage? A property-management company in the area should have these aggregated.
- How much new for-sale + rental construction is in the pipeline within 1–3 miles? Heavy new supply typically softens prices + rents 12–24 months out; constrained supply supports both.
Investment metrics
- 1% rule
- 1.99% ✓
- Cap rate
- 16.87%
- Cash-on-cash
- 37.77%
- DSCR
- 2.68
- GRM
- 4.2
CMA / ARV
- ARV (median comp)
- $80,483
- List price
- $75,000
- Delta
- -6.81%
- Verdict
- FAIR
- Comps
- 20 within 1.0 mi
Show comp detail 8 sales within ~0.75 mi
| Address | Dist | Beds/Ba | Sqft | Sold | Price | $/sf | Match |
|---|---|---|---|---|---|---|---|
| 235 Edwards Rd #99 | 0.02mi | 2/2.0 | 924 (0%) | 11mo | $80,000 | $87 | 90 |
| 151 Edward Rd S #71 | 0.08mi | 2/2.0 | 960 (+4%) | 20mo | $40,000 | $42 | 73 |
| 277 Edwards Rd S #136 | 0.02mi | 3/1.0 (+1) | 924 (0%) | 22mo | $86,000 | $93 | 71 |
| 141 S 17th St #7 | 0.58mi | 2/2.0 | 924 (0%) | 3mo | $90,000 | $97 | 71 |
| 277 Edwards Rd | 0.17mi | 3/1.0 (+1) | 924 (0%) | 22mo | $86,000 | $93 | 64 |
| 141 S 17th St #48 | 0.60mi | 2/1.5 | 924 (0%) | 11mo | $135,000 | $146 | 61 |
| 141 S 17th St #50 | 0.57mi | 2/2.0 | 924 (0%) | 16mo | $127,500 | $138 | 60 |
| 141 S 17th St #64 | 0.56mi | 3/1.5 (+1) | 1,008 (+9%) | 10mo | $134,500 | $133 | 43 |
Match score weights: distance 35% · size 25% · config 20% · recency 20%. Top-matched comps best support the ARV.
Projected returns pro-forma
-3.0% appreciation · 3.0% rent growth · sell at horizon
- IRR
- 33.8%
- Equity multiple
- 2.43×
- Total profit
- $29,963
- Equity at exit
- $11,183
- IRR
- 40.7%
- Equity multiple
- 4.83×
- Total profit
- $80,386
- Equity at exit
- $6,485
Cash invested: $21,000 (down + closing). Projections, not guarantees.
Landlord ↔ Tenant lean methodology
- Overall (STATE)
- 28 Tenant-Leaning
- State Oregon
- 28 Tenant-Leaning · D+6
- County
- — inherits STATE
- City
- — inherits STATE
ZIP-level market 97361
- Home prices YoY
- -34.5%
- Active inventory
- 67
- Price-to-rent
- 4.2×
Monthly cashflow live
- Estimated rent
- $1,493 high interval (Pro) →
- Mortgage (P&I)
- −$393
- Tax est. 1.5%
- −$94 /mo · $1,125/yr
- Insurance
- −$31
- HOA
- −$0
- Vacancy / Maint / Mgmt
- −$313
- Net cashflow
- $661
Break-even live
UW: 25.0% down · 7.5% · 30yr · 1.5% tax · 5.0% vac · 8.0% maint · 8.0% mgmt
Financing live
Cash to close
- Down payment
- $18,750
- Closing costs
- $2,250
- Reserves months
- —
- Total cash needed
- —
Loan-product check · same deal, 3 products live
Conventional
25% down · 7.5% · 30yr
- Down + closing
- —
- Monthly P&I
- —
- Monthly cashflow
- —
- DSCR
- —
- Eligible?
- —
Personal DTI + credit; lowest rate.
DSCR
20% down · 8.5% · 30yr
- Down + closing
- —
- Monthly P&I
- —
- Monthly cashflow
- —
- DSCR
- —
- Eligible?
- —
No personal income docs; deal must DSCR.
Hard money
10% down · 12.0% · 12mo
- Down + closing
- —
- Monthly P&I
- —
- Monthly cashflow
- —
- DSCR
- —
- Eligible?
- —
Short-term bridge; refi at stabilization.
Rent comps 25 comps
| Address | Beds | Baths | Sqft | Rent | $/sqft | DOM | Units | Dist |
|---|---|---|---|---|---|---|---|---|
| 1021 Main St E Unit 1021-1 Monmouth, OR | 2.0 | 1.0 | 800 | $1,450 | $1.81 | 44d | 1 | 0.26mi |
| 314 Monmouth Independence Hwy Monmouth, OR | 3.0 | 1.0 | 1100 | $1,795 | $1.63 | 44d | 1 | 0.28mi |
| 1630 Monmouth St Independence, OR | 2.0 | 1.5 | 900 | $1,375 | $1.53 | 14d | 1 | 0.43mi |
| 1630 Monmouth St Unit 1630-20 Independence, OR | 2.0 | 1.5 | 900 | $1,375 | $1.53 | 23d | 1 | 0.44mi |
| 163 Catron St N Unit 163-02 Monmouth, OR | 2.0 | 1.0 | 760 | $1,395 | $1.84 | 44d | 1 | 0.57mi |
| 1408 Falcon Loop Unit 1408 Independence, OR | 3.0 | 2.0 | 1056 | $1,795 | $1.70 | 14d | 1 | 0.65mi |
| 501 Catron St N Monmouth, OR | 2.0 | 2.0 | 1090 | $1,450 | $1.33 | 14d | 1 | 0.66mi |
| 523 Catron St N Unit 523-05 Monmouth, OR | 2.0 | 2.0 | 1090 | $1,450 | $1.33 | 23d | 1 | 0.70mi |
| 523 Catron St N Unit 523-11 Monmouth, OR | 2.0 | 2.0 | 1090 | $1,400 | $1.28 | 44d | 1 | 0.70mi |
| 1400 E St Independence, OR | 2.0–3.0 | 1.0–2.0 | 962 | $1,525 | $1.59 | 14d | 2 | 0.70mi |
| 537 Catron St N Unit 537-05 Monmouth, OR | 2.0 | 2.0 | 1090 | $1,400 | $1.28 | 44d | 1 | 0.72mi |
| 242 Jackson St E Unit B Monmouth, OR | 2.0 | 1.0 | 877 | $1,650 | $1.88 | 14d | 1 | 0.75mi |
| 130 Main St W Monmouth, OR | 2.0 | 1.0 | 750 | $1,499 | $2.00 | 14d | 1 | 0.85mi |
| 479 S Monmouth Ave Unit 479-18 Monmouth, OR | 2.0 | 1.5 | 996 | $1,545 | $1.55 | 23d | 1 | 0.88mi |
| 219 S Monmouth Ave Unit 212 Monmouth, OR | 2.0 | 1.0 | 980 | $1,499 | $1.53 | 44d | 1 | 0.89mi |
| 205 N Gun Club Rd Unit 123 Independence, OR | 2.0 | 1.0 | 868 | $1,400 | $1.61 | 23d | 1 | 0.92mi |
| 302 S Monmouth Ave Unit 302-A Monmouth, OR | 1.0 | 1.0 | 600 | $1,095 | $1.82 | 44d | 1 | 0.95mi |
| 675 White Oak Cir Independence, OR | 2.0 | 2.0 | 923 | $1,675 | $1.81 | 14d | 5 | 0.99mi |
| 475 Jackson St W Monmouth, OR | 1.0 | 1.0 | 700 | $1,050 | $1.50 | 44d | 1 | 1.12mi |
| 308 Hoxton Ave Unit 2bd/2ba_880sq Monmouth, OR | 2.0 | 2.0 | 880 | $1,720 | $1.95 | 14d | 1 | 1.21mi |
| 304 Hoxton Ave Unit 2bd/2ba_771sq Monmouth, OR | 2.0 | 2.0 | 771 | $1,500 | $1.95 | 14d | 1 | 1.21mi |
| 300 Hoxton Ave Monmouth, OR | 2.0–3.0 | 2.0 | 960 | $1,500 | $1.56 | 14d | 9 | 1.22mi |
| 739 Jackson St W Unit 3 Monmouth, OR | 2.0 | 2.0 | 850 | $1,450 | $1.71 | 44d | 1 | 1.24mi |
| 336 Whitesell St W Unit 336-7 Monmouth, OR | 2.0 | 2.0 | 800 | $1,400 | $1.75 | 23d | 1 | 1.25mi |
| 800 S 4th St Unit 800-08 Independence, OR | 2.0 | 1.0 | 775 | $1,250 | $1.61 | 23d | 1 | 1.46mi |
Listing history 31 events
-
2026-06-18status $75,000 Pending 51 DOM
-
2026-06-17days on market $75,000 Active under Contract 51 DOM
-
2026-06-16days on market $75,000 Active under Contract 50 DOM
-
2026-06-15days on market $75,000 Active under Contract 49 DOM
-
2026-06-14days on market $75,000 Active under Contract 47 DOM
-
2026-06-10days on market $75,000 Active under Contract 44 DOM
-
2026-06-09days on market $75,000 Active under Contract 43 DOM
-
2026-06-09status $75,000 Active under Contract 42 DOM
-
2026-06-08days on market $75,000 Active 42 DOM
-
2026-06-07days on market $75,000 Active 41 DOM
-
2026-06-05days on market $75,000 Active 38 DOM
-
2026-06-03days on market $75,000 Active 37 DOM
-
2026-06-02days on market $75,000 Active 36 DOM
-
2026-06-01days on market $75,000 Active 35 DOM
-
2026-05-31days on market $75,000 Active 34 DOM
-
2026-05-30days on market $75,000 Active 33 DOM
-
2026-04-28$75,000 Active 1895-char remark
-
2012-08-09historical 185-char remark
Show marketing remark (185 chars)
Upgraded kitchen cabinets, new stainless steel appliances, new floor coverings, new countertops in the kitchen and bathroom. Home located on end lot with a large deck and privacy hedge.
-
2012-08-07soldstatus $15,000 Sold 185-char remark
Show marketing remark (185 chars)
Upgraded kitchen cabinets, new stainless steel appliances, new floor coverings, new countertops in the kitchen and bathroom. Home located on end lot with a large deck and privacy hedge.
-
2012-07-20historical Active under Contract 185-char remark
Show marketing remark (185 chars)
Upgraded kitchen cabinets, new stainless steel appliances, new floor coverings, new countertops in the kitchen and bathroom. Home located on end lot with a large deck and privacy hedge.
-
2012-05-29$18,500 Active 185-char remark
Show marketing remark (185 chars)
Upgraded kitchen cabinets, new stainless steel appliances, new floor coverings, new countertops in the kitchen and bathroom. Home located on end lot with a large deck and privacy hedge.
-
2011-08-05soldstatus $18,000 Sold
-
2011-08-05soldstatus $18,000 Sold
-
2011-06-29historical
-
2011-06-29status Pending
-
2011-06-13historical Active under Contract
-
2011-05-25$19,000 Active
-
2011-05-20$19,000 Active
-
2008-05-01soldstatus $15,000
-
2008-04-07historical
-
2008-03-18$15,900
ⓘ Source: listings_history table (triggers on properties + properties_extension) + one-shot
backfill from property_details.listing_events for pre-trigger history.
Nearby sold comps map
Loading sold comps map…
Walkable amenities ~0.75 mi
Loading nearby amenities…
Taxation est. · year 1
- Rental income
- $17,912
- − Mortgage interest
- −$4,201
- − Property taxes
- −$1,125
- − Insurance
- −$375
- − Repairs & maintenance
- −$1,433
- − Management
- −$1,433
- − Depreciation
- −$2,182
- Taxable income
- $7,163
- Est. tax owed @ 24.0%
- −$1,719
- After-tax cash flow
- $6,212/yr
For passive investors: Depreciation is non-cash, so a rental often shows a tax loss while cash-flowing — sheltering income. Rental losses are passive: they offset passive income freely, and up to $25,000/yr can offset ordinary (W-2) income if you actively participate and your MAGI is under $100k (phasing out to $0 by $150k); unused losses carry forward. On sale, claimed depreciation is recaptured at up to 25%, and gains may owe capital-gains tax (a 1031 exchange can defer both). Figures are a year-1 estimate at your 24.0% rate — not tax advice; consult a CPA.
Schools (NCES district)
- District
- Central SD 13J
- NCES district ID
- 4102840
- Math proficiency
- 26% ▼ -3.00%
- Reading proficiency
- 41% ▼ -2.00%
- Median HH income
- $42,374
- Composite
- 31.04/100
- National rank
- #11310
- State rank
- #149 of 183 in OR
Livability — Monmouth
- Score
- 72/100
- State rank
- #108
- US rank
- #5992
Category grades
Schools grade is shown separately in the Schools card above.
Census & demographics
- Census place
- Monmouth, OR
- County
- Polk County · 84,240 people
- City population
- 14,488
- Metro
- Salem, OR
- Population (ZIP)
- 14,488
- Household income
- $69,505
- Rent vs Own
- Severe rent burden
- 412.0
Population outlook (Polk County) Hauer SSP2
- Today (2025)
- 88,594 people
- By 2030
- 93,209 · +5.2%
- By 2040
- 101,942 · +15.1%
- By 2050
- 110,395 · +24.6%
- By 2075
- 131,091 · +48.0%
- By 2100
- 141,746 · +60.0%
Race, ethnicity, and origin ACS 2023
- Neighborhood character
- Predominantly White (76%)
- Race & ethnicity
- White 76% Hispanic / Latino 16% Two or more races 12% Native American 2% Asian 1%
- Hispanic origin (detail)
- Mexican 15%
- Common ancestry
- Slovak 4% Italian 3% Portuguese 3%
- Foreign-born
- 6% · Canada, South Korea
- Languages at home
- 87% English-only · Spanish 10% Other Asian/Pacific 1% Korean 1%
Political lean MEDSL · Polk
- 2024 margin
- Toss-up / Even · D 46.6% · R 50.4% · Other 3.0%
- 2008→2024 swing
- -3.3pp toward R · 2008: -0.5pp · 2024: -3.8pp
- All cycles
- 2024: R+3.8 2020: R+1.7 2016: R+7.0 2012: R+4.8 2008: R+0.5
Not yet ingested
- Civics
- —
Market trends
- HPI YoY
- ▼ -162.97%
- Current HPI
- 309.076
- Rent YoY
- —
- Metro
- Salem, OR
- State GDP YoY
- ▲ 2.05%
- F500 in state
- 2
Industry mix (Fortune 500 HQ in OR)
| Industry | F500 HQs | Revenue |
|---|---|---|
| Consumer Goods | 1 | $51B |
|
||
Price history
+371.7% since first listed17 events — show timeline
- 2026-06-18 Pending — WVMLS
- 2026-06-08 Contingent — WVMLS
- 2026-04-28 Listed $75,000 WVMLS
- 2012-08-09 Listing Removed — WVMLS
- 2012-08-07 Sold (MLS) $15,000 WVMLS
- 2012-07-20 Contingent — WVMLS
- 2012-05-29 Listed $18,500 WVMLS
- 2011-08-05 Sold (MLS) $18,000 WVMLS
- 2011-08-05 Sold (MLS) $18,000 RMLS
- 2011-06-29 Listing Removed — WVMLS
- 2011-06-29 Pending — RMLS
- 2011-06-13 Contingent — WVMLS
- 2011-05-25 Listed $19,000 RMLS
- 2011-05-20 Listed $19,000 WVMLS
- 2008-05-01 Sold (MLS) $15,000 WVMLS
- 2008-04-07 Listing Removed — WVMLS
- 2008-03-18 Listed $15,900 WVMLS
Cash-flow waterfall
monthlySold comps — $/sqft
last 12 mo · ≤1 miLoading sold comps…