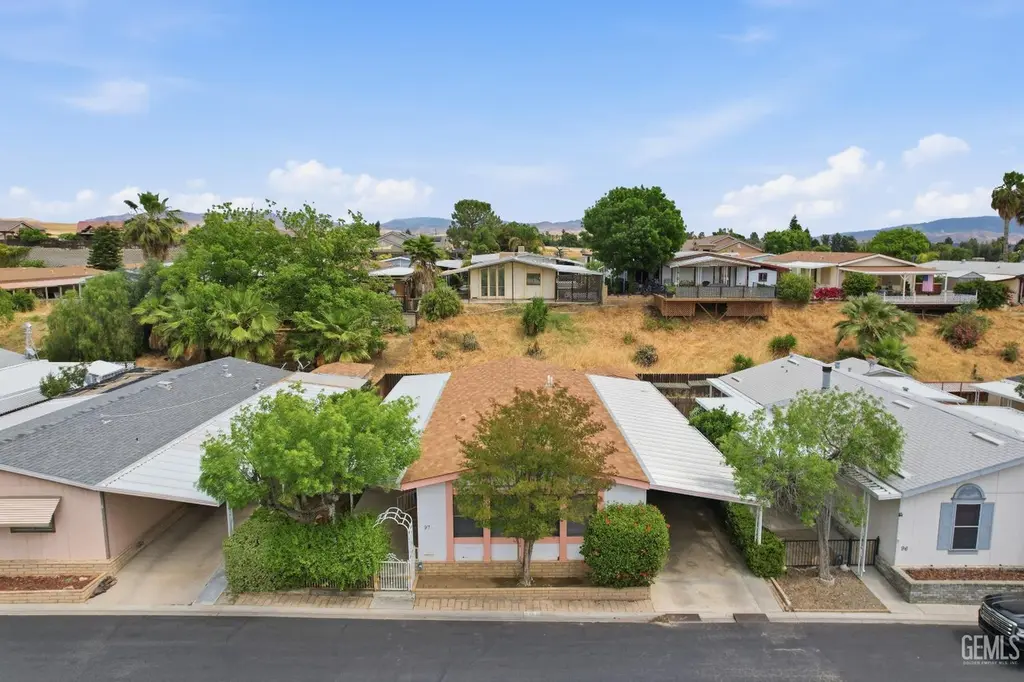
8536 Kern Canyon Rd #97 · East Niles, CA
Flood risk 1/10 · Minimal
- FEMA flood zone
- X (unshaded)
- Chance of flooding over 30 yrs
- 0.0%
- Est. flood insurance / yr
- $507 – $1,088
Fire risk 7/10 · Major
- Est. fire insurance / yr
- $659 – $1,223
Heat risk 8/10 · Major
- Hot days now (above 105°F)
- 6 days/yr
- Hot days in 30 yrs
- 16 days/yr
Wind risk 1/10 · Minimal
- Chance of severe wind over 30 yrs
- —
Air-quality risk 10/10 · Severe
- Unhealthy air days now
- 34 days/yr
- Unhealthy air days in 30 yrs
- 40 days/yr
Risk factors via First Street. Map © Google.
Why this score? — see what drove the B+ grade
The composite is a weighted blend of 9 inputs, each scored 0–100. Each bar is that input's sub-score; the figure is the points it added to the 100-point composite (weight × sub-score).
- Cash flow +30.0/30.0
- ARV discount +15.0/15.0
- 1% rule +10.0/10.0
- DSCR +10.0/10.0
- Schools +3.4/10.0
- Rent growth +3.1/5.0
- Livability +2.5/5.0
- Condition / age +2.5/5.0
- Appreciation +0.0/10.0
$79,000
🖨 Deal sheet (PDF) 📄 Offer letter ✓ Due diligence
Listing remarks MLS
Kern Canyon Estates 1344sf 2 bed 2 bath Manufacture Home value priced for quick sale. This home includes a . spacious great room with faux wood bean vaulted ceilings, dining area, kitchen with breakfast bar wood cabinetry, double oven, range, dishwasher, fridge. Also includes a spacious master bedroom, master bath includes separate shower and tub, indoor laundry with washer and dryer and other furniture will be included. The outside includes shaded carport driveway, wood storage building, fenced backyard, covered patio and mature landscaping.
Key facts
- Shaded carport
- Master bath
- Great room
Tags
Neighborhood map
What this means for you Summary
Snapshot
- This is a 2-bed/2.0-bath manufactured listed at $79k.
Deal economics
- At list price, monthly cash flow is $845 ($10k/yr) — positive.
- The deal already cash-flows at list — no discount required.
- Meets the 1% rule at list price ($2k rent vs $79k).
- Recommended offer: $78k (1.5% below list) — sets the bar for market timing.
- Cap rate 19.1% vs local median 4.4% in East Niles — top-decile yield for the area; either an underpriced asset or a hidden risk that comps aren't pricing in. Stress-test before assuming the spread holds.
Location & tenants
- Location reads: area grade B — affects rentability + tenant quality, not the cash-flow math above.
- Kern High (urban): math 21% / reading 51% proficiency, ranked #860 of 1,400 in CA (top 61%) — families likely to look elsewhere, expect single-tenant / working-renter base with shorter leases.
- Market conditions: Rents rising (+2.2%/yr); 387 active listings in the ZIP; 8 comparable units currently listed for rent nearby; rentals leasing fast (median 4d on market — plan ~1-2 weeks tenant-placement turnaround); 3,244 units permitted in Kern County in 2024 (73 in 5+ unit buildings).
Forward outlook
- Local home prices are declining (-3.0%/yr); year-one equity from $546 of loan paydown is wiped out by about $2k of value loss. Plan a longer hold.
- Kern County population projected at +17% by 2050 — long-run rental-demand tailwind backs the buy-and-hold thesis.
- At projected returns (-3.0% appreciation + 2.2% rent growth), your $22k cash investment doubles in ~3 years — after that, you're playing with house money.
Negotiation context
- It's been on market 30 days — a 2% lower offer ($78k) is reasonable based on typical stale-listing flexibility.
- 2 sale attempts since 21y ago with the ask held roughly flat each time — persistent listings suggest the price (not the market) is what's stuck; bring a comps-based counter.
Risks & watch-outs
- Climate carrying-cost: major wildfire risk; extreme-heat days projected 6→16/yr by 2055 (HVAC capex compounding) — expect insurance premiums to compound above CPI over the hold.
Questions for the listing agent
- Is there a deadline driving the sale (1031 exchange, divorce, estate, relocation)? That informs how much negotiation room exists.
- What's the average days-on-market for RENTAL listings here right now (not sales)? A rising rental-DOM trend means longer vacancies and softer asking-rent achievability than the comps imply.
- What's the recent tenant-quality profile in this submarket — average credit score on applications, eviction rate, late-payment / NSF rate, and stable-employment percentage? A property-management company in the area should have these aggregated.
- How much new for-sale + rental construction is in the pipeline within 1–3 miles? Heavy new supply typically softens prices + rents 12–24 months out; constrained supply supports both.
Investment metrics
- 1% rule
- 2.12% ✓
- Cap rate
- 19.13%
- Cash-on-cash
- 45.86%
- DSCR
- 3.04
- GRM
- 3.9
CMA / ARV
- ARV (median comp)
- $104,197
- List price
- $79,000
- Delta
- -24.18%
- Verdict
- UNDERPRICED
- Comps
- 20 within 1.0 mi
Show comp detail 12 sales within ~0.75 mi
| Address | Dist | Beds/Ba | Sqft | Sold | Price | $/sf | Match |
|---|---|---|---|---|---|---|---|
| 8536 Kern Canyon Rd #44 | 0.00mi | 2/2.0 | 1,344 (0%) | 6mo | $63,000 | $47 | 95 |
| 8536 Kern Canyon Rd #100 | 0.00mi | 2/2.0 | 1,344 (0%) | 8mo | $105,000 | $78 | 93 |
| 8500 Kern Canyon Rd #139 | 0.18mi | 2/2.0 | 1,344 (0%) | 3mo | $74,000 | $55 | 89 |
| 8536 Kern Canyon Rd #73 | 0.00mi | 2/2.0 | 1,440 (+7%) | 2mo | $105,000 | $73 | 86 |
| 8536 Kern Canyon Rd #186 | 0.00mi | 2/2.0 | 1,440 (+7%) | 3mo | $129,900 | $90 | 85 |
| 8300 Kern Canyon Rd #150 | 0.19mi | 3/2.0 (+1) | 1,344 (0%) | 1mo | $93,000 | $69 | 85 |
| 8536 Kern Canyon Rd #136 | 0.00mi | 2/2.0 | 1,430 (+6%) | 8mo | $125,000 | $87 | 83 |
| 8536 Kern Canyon Rd #146 | 0.00mi | 2/2.0 | 1,248 (-7%) | 8mo | $85,000 | $68 | 82 |
| 9305 Eastwind Cir | 0.25mi | 3/2.0 (+1) | 1,344 (0%) | 6mo | $250,000 | $186 | 78 |
| 8300 Kern Canyon Rd #93 | 0.19mi | 2/2.0 | 1,248 (-7%) | 2mo | $68,000 | $54 | 78 |
| 9108 Eastwind Cir | 0.31mi | 2/2.0 | 1,404 (+4%) | 7mo | $245,000 | $175 | 72 |
| 8904 Eastwind Cir | 0.28mi | 2/2.0 | 1,248 (-7%) | 6mo | $285,000 | $228 | 70 |
Match score weights: distance 35% · size 25% · config 20% · recency 20%. Top-matched comps best support the ARV.
Projected returns pro-forma
-3.0% appreciation · 2.24% rent growth · sell at horizon
- IRR
- 42.2%
- Equity multiple
- 2.80×
- Total profit
- $39,756
- Equity at exit
- $11,779
- IRR
- 48.0%
- Equity multiple
- 5.46×
- Total profit
- $98,749
- Equity at exit
- $6,830
Cash invested: $22,120 (down + closing). Projections, not guarantees.
Landlord ↔ Tenant lean methodology
- Overall (STATE)
- 18 Strongly Tenant-Friendly
- State California
- 18 Strongly Tenant-Friendly · D+13
- County
- — inherits STATE
- City
- — inherits STATE
ZIP-level market 93306
- Rents YoY
- 2.2%
- Active inventory
- 387
- Price-to-rent
- 3.9×
Monthly cashflow live
- Estimated rent
- $1,676 high interval (Pro) →
- Mortgage (P&I)
- −$414
- Tax from tax record
- −$31 /mo · $374/yr
- Insurance
- −$33
- HOA
- −$0
- Vacancy / Maint / Mgmt
- −$352
- Net cashflow
- $845
Break-even live
Sensitivity live
| Price | -10% $890 | -5% $868 | +0% $845 | +5% $823 | +10% $801 |
|---|---|---|---|---|---|
| Rent | -10% $713 | -5% $779 | +0% $845 | +5% $912 | +10% $978 |
| Rate | -1.0pp $885 | -0.5pp $866 | base $845 | +0.5pp $825 | +1.0pp $804 |
UW: 25.0% down · 7.5% · 30yr · 1.5% tax · 5.0% vac · 8.0% maint · 8.0% mgmt
Financing live
Cash to close
- Down payment
- $19,750
- Closing costs
- $2,370
- Reserves months
- —
- Total cash needed
- —
Loan-product check · same deal, 3 products live
Conventional
25% down · 7.5% · 30yr
- Down + closing
- —
- Monthly P&I
- —
- Monthly cashflow
- —
- DSCR
- —
- Eligible?
- —
Personal DTI + credit; lowest rate.
DSCR
20% down · 8.5% · 30yr
- Down + closing
- —
- Monthly P&I
- —
- Monthly cashflow
- —
- DSCR
- —
- Eligible?
- —
No personal income docs; deal must DSCR.
Hard money
10% down · 12.0% · 12mo
- Down + closing
- —
- Monthly P&I
- —
- Monthly cashflow
- —
- DSCR
- —
- Eligible?
- —
Short-term bridge; refi at stabilization.
Rent comps 8 comps
| Address | Beds | Baths | Sqft | Rent | $/sqft | DOM | Units | Dist |
|---|---|---|---|---|---|---|---|---|
| 3217 Fortier St Unit B Bakersfield, CA | 3.0 | 2.0 | 1072 | $1,650 | $1.54 | 3d | 1 | 0.39mi |
| 600 Morning Dr Unit 661-363-6434 Bakersfield, CA | 2.0 | 1.0 | 884 | $1,005 | $1.14 | 3d | 1 | 0.98mi |
| 600 Morning Dr Unit 661-363-6434 Bakersfield, CA | 3.0 | 1.0 | 1054 | $1,067 | $1.01 | 44d | 1 | 0.98mi |
| 7000 College Ave Apt 168 Bakersfield, CA | 2.0 | 2.0 | 957 | $1,655 | $1.73 | 20d | 1 | 1.00mi |
| 8817 Butternut Ave Bakersfield, CA | 3.0 | 2.0 | 1383 | $2,200 | $1.59 | 3d | 1 | 1.16mi |
| 9802 Krista Vineyard Way Bakersfield, CA | 3.0 | 2.0 | 1300 | $2,195 | $1.69 | 3d | 1 | 1.17mi |
| 6900 Valleyview Dr Unit 152 Bakersfield, CA | 2.0 | 2.0 | 1040 | $1,610 | $1.55 | 3d | 1 | 1.40mi |
| 6900 Valleyview Dr Apt 127 Bakersfield, CA | 2.0 | 1.5 | 975 | $1,535 | $1.57 | 44d | 1 | 1.40mi |
Listing history 5 events
-
2026-05-14status Pending 548-char remark
Show marketing remark (548 chars)
Kern Canyon Estates 1344sf 2 bed 2 bath Manufacture Home value priced for quick sale. This home includes a . spacious great room with faux wood bean vaulted ceilings, dining area, kitchen with breakfast bar wood cabinetry, double oven, range, dishwasher, fridge. Also includes a spacious master bedroom, master bath includes separate shower and tub, indoor laundry with washer and dryer and other furniture will be included. The outside includes shaded carport driveway, wood storage building, fenced backyard, covered patio and mature landscaping.
-
2026-04-14$79,000 Active 548-char remark
Show marketing remark (548 chars)
Kern Canyon Estates 1344sf 2 bed 2 bath Manufacture Home value priced for quick sale. This home includes a . spacious great room with faux wood bean vaulted ceilings, dining area, kitchen with breakfast bar wood cabinetry, double oven, range, dishwasher, fridge. Also includes a spacious master bedroom, master bath includes separate shower and tub, indoor laundry with washer and dryer and other furniture will be included. The outside includes shaded carport driveway, wood storage building, fenced backyard, covered patio and mature landscaping.
-
2006-01-20soldstatus $75,000 165-char remark
Show marketing remark (165 chars)
Great Family Park Clean, Light And Bright, Lots Of Windows Built In Buffet, Includes Refrigerator, Washer/Dryer, Large Master Bath With Soaking Tub, Shower + 2 Sinks
-
2006-01-20price $79,950 165-char remark
Show marketing remark (165 chars)
Great Family Park Clean, Light And Bright, Lots Of Windows Built In Buffet, Includes Refrigerator, Washer/Dryer, Large Master Bath With Soaking Tub, Shower + 2 Sinks
-
2005-12-19$75,000 165-char remark
Show marketing remark (165 chars)
Great Family Park Clean, Light And Bright, Lots Of Windows Built In Buffet, Includes Refrigerator, Washer/Dryer, Large Master Bath With Soaking Tub, Shower + 2 Sinks
ⓘ Source: listings_history table (triggers on properties + properties_extension) + one-shot
backfill from property_details.listing_events for pre-trigger history.
Tax reassessment forecast CA · Resets to sale price
- Current annual tax
- $374 · $31/mo
- Projected year-2 tax
- $600 · $50/mo
- Expected delta
- +$227/yr (+$19/mo · 60.7%)
ⓘ Screening estimate from a state-policy table — verify with the county assessor before closing.
Climate risk First Street
- Flood 1/10 Low FEMA zone X (unshaded) · 0% chance over 30 yrs
- Wildfire 7/10 Severe
- Heat 8/10 Severe 6 d/yr ≥105°F today · 16 d/yr by 30 yrs out
- Wind 1/10 Low
- Air quality 10/10 Extreme 34 unhealthy d/yr today · 40 by 30 yrs out
Nearby sold comps map
Loading sold comps map…
Walkable amenities ~0.75 mi
Loading nearby amenities…
Taxation est. · year 1
- Rental income
- $20,108
- − Mortgage interest
- −$4,425
- − Property taxes
- −$374
- − Insurance
- −$395
- − Repairs & maintenance
- −$1,609
- − Management
- −$1,609
- − Depreciation
- −$2,298
- Taxable income
- $9,399
- Est. tax owed @ 24.0%
- −$2,256
- After-tax cash flow
- $7,890/yr
For passive investors: Depreciation is non-cash, so a rental often shows a tax loss while cash-flowing — sheltering income. Rental losses are passive: they offset passive income freely, and up to $25,000/yr can offset ordinary (W-2) income if you actively participate and your MAGI is under $100k (phasing out to $0 by $150k); unused losses carry forward. On sale, claimed depreciation is recaptured at up to 25%, and gains may owe capital-gains tax (a 1031 exchange can defer both). Figures are a year-1 estimate at your 24.0% rate — not tax advice; consult a CPA.
Schools (NCES district)
- District
- Kern High
- NCES district ID
- 0619540
- Math proficiency
- 21% ▬ 0.00%
- Reading proficiency
- 51% ▲ 2.00%
- Median HH income
- $49,686
- Composite
- 33.68/100
- National rank
- #10443
- State rank
- #860 of 1400 in CA
Livability — East Niles
No livability data for this city. (Only ~50 U.S. cities are tracked.)
Census & demographics
- Census place
- East Niles, CA
- County
- Kern County · 710,371 people
- Metro
- Bakersfield, CA
- Population (ZIP)
- 74,116
- Household income
- $69,805
- Rent vs Own
- Severe rent burden
- 2871.0
Population outlook (Kern County) Hauer SSP2
- Today (2025)
- 947,286 people
- By 2030
- 978,984 · +3.3%
- By 2040
- 1,045,018 · +10.3%
- By 2050
- 1,105,232 · +16.7%
- By 2075
- 1,229,538 · +29.8%
- By 2100
- 1,238,059 · +30.7%
Race, ethnicity, and origin ACS 2023
- Neighborhood character
- Predominantly Hispanic (67%)
- Race & ethnicity
- Hispanic / Latino 67% White 23% Two or more races 20% Black 3% Asian 2% Native American 1%
- Hispanic origin (detail)
- Mexican 63%
- Common ancestry
- Italian 2% Slovak 1% Russian 1%
- Foreign-born
- 19% · Canada
- Languages at home
- 50% English-only · Spanish 46% Other Asian/Pacific 1% Arabic 1%
Political lean MEDSL · Kern
- 2024 margin
- Strong R (+21.1) · D 38.2% · R 59.3% · Other 2.5%
- 2008→2024 swing
- -3.3pp toward R · 2008: -17.8pp · 2024: -21.1pp
- All cycles
- 2024: R+21.1 2020: R+10.2 2016: R+15.0 2012: R+20.9 2008: R+17.8
Not yet ingested
- Civics
- —
Market trends
- HPI YoY
- ▼ -323.02%
- Current HPI
- 358.5434
- Rent YoY
- ▲ 2.24%
- Metro
- Bakersfield, CA
- State GDP YoY
- ▲ 3.21%
- F500 in state
- 116
Industry mix (Fortune 500 HQ in CA)
| Industry | F500 HQs | Revenue |
|---|---|---|
| Technology | 27 | $1,492B |
|
||
| Financial Services | 3 | $174B |
|
||
| Retail | 3 | $44B |
|
||
| Insurance | 3 | $26B |
|
||
| Media / Entertainment | 2 | $115B |
|
||
| Pharmaceuticals / Biotech | 2 | $62B |
|
||
Price history
+5.3% since first listed5 events — show timeline
- 2026-05-14 Pending — GEMLS
- 2026-04-14 Listed $79,000 GEMLS
- 2006-01-20 Price Changed $79,950 GEMLS
- 2006-01-20 Sold (MLS) $75,000 GEMLS
- 2005-12-19 Listed $75,000 GEMLS
Property tax history
+5.2%/yrLatest (2025): $374 · +5.3% YoY. Source: county tax records.
Cash-flow waterfall
monthlySold comps — $/sqft
last 12 mo · ≤1 miLoading sold comps…