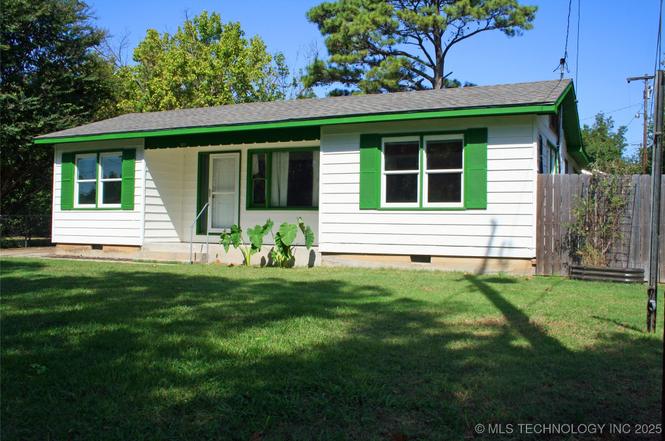
511 7th SE · Ardmore, OK
Flood risk 1/10 · Minimal
- FEMA flood zone
- X (unshaded)
- Chance of flooding over 30 yrs
- 0.0%
- Est. flood insurance / yr
- $507 – $1,088
Fire risk 5/10 · Moderate
- Est. fire insurance / yr
- $2,463 – $4,575
Heat risk 6/10 · Moderate
- Hot days now (above 112°F)
- 7 days/yr
- Hot days in 30 yrs
- 20 days/yr
Wind risk 4/10 · Minor
- Chance of severe wind over 30 yrs
- 12.0%
Air-quality risk 3/10 · Minor
- Unhealthy air days now
- 2 days/yr
- Unhealthy air days in 30 yrs
- 3 days/yr
Risk factors via First Street. Map © Google.
Why this score? — see what drove the B grade
The composite is a weighted blend of 9 inputs, each scored 0–100. Each bar is that input's sub-score; the figure is the points it added to the 100-point composite (weight × sub-score).
- Cash flow +30.0/30.0
- ARV discount +13.5/15.0
- DSCR +10.0/10.0
- 1% rule +9.6/10.0
- Rent growth +4.3/5.0
- Livability +2.9/5.0
- Condition / age +2.5/5.0
- Schools +1.1/10.0
- Appreciation +0.0/10.0
$98,000
🖨 Deal sheet 📄 Offer letter ✓ Due diligence
Listing remarks MLS
Three bedroom 1 bath. Garage was turned into a workshop/storage area. Fenced in back yard. Would make a great investment property or starter home. Sold on 1 shot!
Key facts
- Roof 2020
- Updated bath
- Mini splits 2020
Tags
Property features AI
Exterior
- Parking: Attached or detached garage with 1 garage space
- Security: No safety shelter
- Utilities: Electricity available; Public water; Public sewer
- Home design: Single-story; Faces south; Crawlspace foundation
- Construction: Vinyl siding; Wood frame construction; Asphalt/fiberglass roof
- Exterior features: Covered porch; Shed(s); Privacy fencing; Mature trees
Interior
- Kitchen: Dishwasher; Oven; Range
- Bedrooms: 1 story home (bedroom level not specified)
- Flooring: Vinyl flooring; Wood flooring
- Bathrooms: 1 full bathroom
- Heating & cooling: Ductless heating; Electric heating; Zoned heating; Ductless cooling; Zoned cooling
- Interior features: Ceiling fan(s); Laminate counters; Electric oven connection; Insulated windows with vinyl and wood frames; Other interior features
- Laundry & utility: Electric dryer hookup
Neighborhood map
What this means for you Summary
Snapshot
- This is a 3-bed/2.0-bath single-family listed at $98k.
Deal economics
- At list price, monthly cash flow is $500 ($6k/yr) — positive.
- The deal already cash-flows at list — no discount required.
- Meets the 1% rule at list price ($1k rent vs $98k).
- Recommended offer: $86k (12.0% below list) — sets the bar for market timing.
- Cap rate 12.4% vs local median 4.6% in Ardmore — top-decile yield for the area; either an underpriced asset or a hidden risk that comps aren't pricing in. Stress-test before assuming the spread holds.
Location & tenants
- Location reads 58/100 on livability (#447 in OK) — a working-class tenant base; expect higher turnover. Strengths: cost of living A+, housing A+; Watch: schools F, crime F, amenities F.
- Ardmore (town): math 12% / reading 15% proficiency, ranked #241 of 270 in OK (top 89%) — low school quality limits family demand, transient renter base, plan for 1-2y turnover; 73% free/reduced lunch — lower-income household profile, screen leases tightly.
- Market conditions: Rents rising fast (+7.4%/yr); 379 active listings in the ZIP; 73 units permitted in Carter County in 2024 (0 in 5+ unit buildings).
Forward outlook
- Local home prices are declining (-3.0%/yr); year-one equity from $678 of loan paydown is wiped out by about $3k of value loss. Plan a longer hold.
- Carter County population projected at +9% by 2050 — modest demand growth; plan on rents tracking national, not racing it.
- At projected returns (-3.0% appreciation + 7.4% rent growth), your $27k cash investment doubles in ~5 years — after that, you're playing with house money.
Negotiation context
- It's been on market 260 days — a 12% lower offer ($86k) is reasonable based on typical stale-listing flexibility.
- 3 sale attempts since 6y ago; this cycle's ask has dropped $51k (34%) from the opening price — seller is motivated, your offer sets the floor, not the list.
- Current owner paid $60k; list at $98k implies a 63% gain — meaningful room to come down on a strong offer.
Risks & watch-outs
- Watch-outs: built in 1937 — expect roof / HVAC / electrical / plumbing capex.
- Climate carrying-cost: moderate wildfire risk; extreme-heat days projected 7→20/yr by 2055 (HVAC capex compounding) — expect insurance premiums to compound above CPI over the hold.
Questions for the listing agent
- It's been on market 260 days. Have you received any prior offers? Is the seller open to a 12% concession, seller financing, or rate buy-down credit?
- Built in 1937 — when were the roof, HVAC, electrical panel, plumbing, and water heater last replaced?
- Why hasn't it sold? Are there any deal-killer items the seller is aware of (foundation, flood, title, zoning, code violations)?
- Is there a deadline driving the sale (1031 exchange, divorce, estate, relocation)? That informs how much negotiation room exists.
- Schools are F-rated, which usually means shorter tenancies and higher turnover. Who's the typical renter profile here, and what's been the actual vacancy rate?
- Crime grade is F in this area — have there been break-ins, vandalism, or insurance claims at this property in the last 3 years? What carrier currently insures it and at what premium?
- What's the average days-on-market for RENTAL listings here right now (not sales)? A rising rental-DOM trend means longer vacancies and softer asking-rent achievability than the comps imply.
- What's the recent tenant-quality profile in this submarket — average credit score on applications, eviction rate, late-payment / NSF rate, and stable-employment percentage? A property-management company in the area should have these aggregated.
- How much new for-sale + rental construction is in the pipeline within 1–3 miles? Heavy new supply typically softens prices + rents 12–24 months out; constrained supply supports both.
Investment metrics
- 1% rule
- 1.46% ✓
- Cap rate
- 12.42%
- Cash-on-cash
- 21.87%
- DSCR
- 1.97
- GRM
- 5.7
CMA / ARV
- ARV (on-the-fly)
- $113,160
- Comps found
- 12
Show comp detail 12 sales within ~0.75 mi
| Address | Dist | Beds/Ba | Sqft | Sold | Price | $/sf | Match |
|---|---|---|---|---|---|---|---|
| 301 Carter St | 0.37mi | 3/2.0 | 1,255 (+2%) | 2mo | $160,000 | $127 | 78 |
| 701 4th Ave SE | 0.29mi | 3/1.0 | 1,235 (+0%) | 10mo | $35,000 | $28 | 73 |
| 909 SE D St | 0.33mi | 3/1.0 | 1,181 (-4%) | 10mo | $142,500 | $121 | 66 |
| 41 G SE | 0.64mi | 3/1.0 | 1,156 (-6%) | 1mo | $50,000 | $43 | 55 |
| 520 Carter St | 0.08mi | 2/1.0 (-1) | 1,122 (-9%) | 22mo | $23,000 | $20 | 54 |
| 1108 Douglas St SE | 0.43mi | 3/2.0 | 1,100 (-11%) | 16mo | $115,000 | $105 | 49 |
| 1118 Heath SE | 0.46mi | 3/1.0 | 1,053 (-14%) | 4mo | $90,000 | $85 | 48 |
| 225 SW A St | 0.67mi | 3/2.0 | 1,284 (+4%) | 17mo | $177,500 | $138 | 47 |
| 310 G SE | 0.37mi | 3/1.5 | 1,407 (+14%) | 14mo | $130,000 | $92 | 45 |
| 410 D SE | 0.25mi | 2/1.0 (-1) | 1,390 (+13%) | 20mo | $59,000 | $42 | 41 |
| 1002 SW Howard St | 0.70mi | 2/1.0 (-1) | 1,056 (-14%) | 0mo | $125,000 | $118 | 34 |
| 17 NE F St | 0.75mi | 3/1.0 | 1,072 (-13%) | 14mo | $15,000 | $14 | 28 |
Match score weights: distance 35% · size 25% · config 20% · recency 20%. Top-matched comps best support the ARV.
Projected returns pro-forma
-3.0% appreciation · 7.38% rent growth · sell at horizon
- IRR
- 19.2%
- Equity multiple
- 1.82×
- Total profit
- $22,533
- Equity at exit
- $14,612
- IRR
- 30.3%
- Equity multiple
- 4.28×
- Total profit
- $90,107
- Equity at exit
- $8,473
Cash invested: $27,440 (down + closing). Projections, not guarantees.
Landlord ↔ Tenant lean methodology
- Overall (STATE)
- 83 Strongly Landlord-Friendly
- State Oklahoma
- 83 Strongly Landlord-Friendly · R+20
- County
- — inherits STATE
- City
- — inherits STATE
ZIP-level market 73401
- Home prices YoY
- -21.7%
- Rents YoY
- 7.4%
- Active inventory
- 379
- Price-to-rent
- 5.7×
Monthly cashflow live
- Estimated rent
- $1,427 medium interval (Pro) →
- Mortgage (P&I)
- −$514
- Tax from tax record
- −$73 /mo · $874/yr
- Insurance
- −$41
- HOA
- −$0
- Vacancy / Maint / Mgmt
- −$300
- Net cashflow
- $500
Break-even live
UW: 25.0% down · 7.5% · 30yr · 1.5% tax · 5.0% vac · 8.0% maint · 8.0% mgmt
Financing live
Cash to close
- Down payment
- $24,500
- Closing costs
- $2,940
- Reserves months
- —
- Total cash needed
- —
Loan-product check · same deal, 3 products live
Conventional
25% down · 7.5% · 30yr
- Down + closing
- —
- Monthly P&I
- —
- Monthly cashflow
- —
- DSCR
- —
- Eligible?
- —
Personal DTI + credit; lowest rate.
DSCR
20% down · 8.5% · 30yr
- Down + closing
- —
- Monthly P&I
- —
- Monthly cashflow
- —
- DSCR
- —
- Eligible?
- —
No personal income docs; deal must DSCR.
Hard money
10% down · 12.0% · 12mo
- Down + closing
- —
- Monthly P&I
- —
- Monthly cashflow
- —
- DSCR
- —
- Eligible?
- —
Short-term bridge; refi at stabilization.
Listing history 28 events
-
2026-06-19days on market $98,000 Active 260 DOM
-
2026-06-18days on market $98,000 Active 259 DOM
-
2026-06-17days on market $98,000 Active 258 DOM
-
2026-06-16days on market $98,000 Active 257 DOM
-
2026-06-15days on market $98,000 Active 256 DOM
-
2026-06-14days on market $98,000 Active 254 DOM
-
2026-06-12days on market $98,000 Active 253 DOM
-
2026-06-09days on market $98,000 Active 250 DOM
-
2026-06-08days on market $98,000 Active 249 DOM
-
2026-06-07days on market $98,000 Active 248 DOM
-
2026-06-05days on market $98,000 Active 245 DOM
-
2026-06-03days on market $98,000 Active 244 DOM
-
2026-06-02days on market $98,000 Active 243 DOM
-
2026-06-01days on market $98,000 Active 242 DOM
-
2026-05-31days on market $98,000 Active 241 DOM
-
2026-05-30days on market $98,000 Active 240 DOM
-
2026-03-22price $98,000
-
2026-03-04price $110,000
-
2026-01-26price $118,000
-
2025-12-07price $128,000
-
2025-11-06price $139,000
-
2025-10-10price $145,000
-
2025-10-02$149,000 Active
-
2020-09-16soldstatus $60,000
-
2020-09-14soldstatus $60,000 162-char remark
Show marketing remark (162 chars)
Three bedroom 1 bath. Garage was turned into a workshop/storage area. Fenced in back yard. Would make a great investment property or starter home. Sold on 1 shot!
-
2020-08-14$60,000 162-char remark
Show marketing remark (162 chars)
Three bedroom 1 bath. Garage was turned into a workshop/storage area. Fenced in back yard. Would make a great investment property or starter home. Sold on 1 shot!
-
2020-06-09soldstatus $25,000 146-char remark
Show marketing remark (146 chars)
Three bedroom 1 bath. Garage was turned into a workshop/storage area. Fenced in back yard. Would make a great investment property or starter home.
-
2020-05-11$25,000 146-char remark
Show marketing remark (146 chars)
Three bedroom 1 bath. Garage was turned into a workshop/storage area. Fenced in back yard. Would make a great investment property or starter home.
ⓘ Source: listings_history table (triggers on properties + properties_extension) + one-shot
backfill from property_details.listing_events for pre-trigger history.
Tax reassessment forecast OK · Resets to sale price
- Current annual tax
- $874 · $73/mo
- Projected year-2 tax
- $882 · $73/mo
- Expected delta
- +$8/yr (+$1/mo · 0.9%)
ⓘ Screening estimate from a state-policy table — verify with the county assessor before closing.
Climate risk First Street
- Flood 1/10 Low FEMA zone X (unshaded) · 0% chance over 30 yrs
- Wildfire 5/10 Major
- Heat 6/10 Major 7 d/yr ≥112°F today · 20 d/yr by 30 yrs out
- Wind 4/10 Moderate 12% chance of damaging wind over 30 yrs
- Air quality 3/10 Moderate 2 unhealthy d/yr today · 3 by 30 yrs out
Nearby sold comps map
Loading sold comps map…
Walkable amenities ~0.75 mi
Loading nearby amenities…
Taxation est. · year 1
- Rental income
- $17,130
- − Mortgage interest
- −$5,490
- − Property taxes
- −$874
- − Insurance
- −$490
- − Repairs & maintenance
- −$1,370
- − Management
- −$1,370
- − Depreciation
- −$2,851
- Taxable income
- $4,685
- Est. tax owed @ 24.0%
- −$1,124
- After-tax cash flow
- $4,877/yr
For passive investors: Depreciation is non-cash, so a rental often shows a tax loss while cash-flowing — sheltering income. Rental losses are passive: they offset passive income freely, and up to $25,000/yr can offset ordinary (W-2) income if you actively participate and your MAGI is under $100k (phasing out to $0 by $150k); unused losses carry forward. On sale, claimed depreciation is recaptured at up to 25%, and gains may owe capital-gains tax (a 1031 exchange can defer both). Figures are a year-1 estimate at your 24.0% rate — not tax advice; consult a CPA.
Schools (NCES district)
- District
- Ardmore
- NCES district ID
- 4003180
- Math proficiency
- 12% ▼ -7.00%
- Reading proficiency
- 15% ▼ -6.00%
- Median HH income
- $35,194
- Composite
- 11.1/100
- National rank
- #9733
- State rank
- #241 of 270 in OK
Livability — Ardmore
- Score
- 58/100
- State rank
- #447
- US rank
- #21387
Category grades
Schools grade is shown separately in the Schools card above.
Census & demographics
- Census place
- Ardmore, OK
- County
- Carter County · 36,833 people
- City population
- 36,833
- Metro
- Ardmore, OK
- Population (ZIP)
- 36,833
- Household income
- $61,989
- Rent vs Own
- Severe rent burden
- 1026.0
Population outlook (Carter County) Hauer SSP2
- Today (2025)
- 50,892 people
- By 2030
- 51,913 · +2.0%
- By 2040
- 53,857 · +5.8%
- By 2050
- 55,604 · +9.3%
- By 2075
- 60,670 · +19.2%
- By 2100
- 62,366 · +22.5%
Race, ethnicity, and origin ACS 2023
- Neighborhood character
- Diverse neighborhood (Simpson 0.57)
- Race & ethnicity
- White 65% Two or more races 14% Hispanic / Latino 9% Native American 8% Black 7% Asian 1%
- Hispanic origin (detail)
- Mexican 7%
- Common ancestry
- Slovak 2% Lithuanian 1% Italian 1%
- Foreign-born
- 4% · Canada
- Languages at home
- 92% English-only · Spanish 5%
Political lean MEDSL · Carter
- 2024 margin
- Solid R (+54.7) · D 21.9% · R 76.7% · Other 1.4%
- 2008→2024 swing
- -14.2pp toward R · 2008: -40.5pp · 2024: -54.7pp
- All cycles
- 2024: R+54.7 2020: R+52.5 2016: R+52.6 2012: R+42.7 2008: R+40.5
Not yet ingested
- Civics
- —
Market trends
- HPI YoY
- ▼ -74.93%
- Current HPI
- 269.7381
- Rent YoY
- ▲ 7.38%
- Metro
- Ardmore, OK
- State GDP YoY
- ▲ 1.55%
- F500 in state
- 6
Industry mix (Fortune 500 HQ in OK)
| Industry | F500 HQs | Revenue |
|---|---|---|
| Energy | 3 | $48B |
|
||
Price history
+292.0% since first listed12 events — show timeline
- 2026-03-22 Price Changed $98,000 MLS Technology, Inc.
- 2026-03-04 Price Changed $110,000 MLS Technology, Inc.
- 2026-01-26 Price Changed $118,000 MLS Technology, Inc.
- 2025-12-07 Price Changed $128,000 MLS Technology, Inc.
- 2025-11-06 Price Changed $139,000 MLS Technology, Inc.
- 2025-10-10 Price Changed $145,000 MLS Technology, Inc.
- 2025-10-02 Listed $149,000 MLS Technology, Inc.
- 2020-09-16 Sold (Public Records) $60,000 Public Records
- 2020-09-14 Sold (MLS) $60,000 MLS Technology, Inc.
- 2020-08-14 Listed $60,000 MLS Technology, Inc.
- 2020-06-09 Sold (MLS) $25,000 MLS Technology, Inc.
- 2020-05-11 Listed $25,000 MLS Technology, Inc.
Property tax history
+41.1%/yrLatest (2025): $874 · +5.0% YoY. Source: county tax records.
Cash-flow waterfall
monthlySold comps — $/sqft
last 12 mo · ≤1 miLoading sold comps…