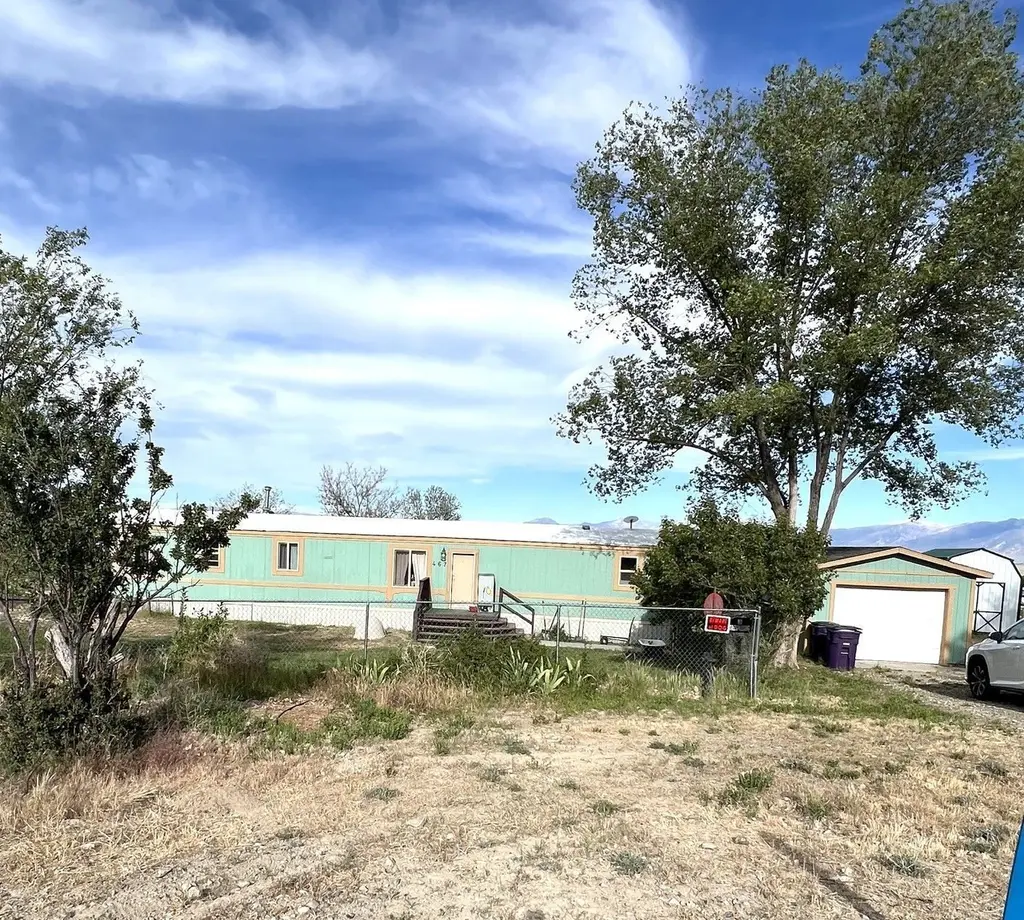
467 Smokey Pl · Spring Creek, NV
Flood risk 1/10 · Minimal
- FEMA flood zone
- X (unshaded)
- Chance of flooding over 30 yrs
- 0.0%
- Est. flood insurance / yr
- $507 – $1,088
Fire risk 9/10 · Severe
- Est. fire insurance / yr
- $490 – $910
Heat risk 4/10 · Minor
- Hot days now (above 91°F)
- 7 days/yr
- Hot days in 30 yrs
- 19 days/yr
Wind risk 1/10 · Minimal
- Chance of severe wind over 30 yrs
- —
Air-quality risk 2/10 · Minimal
- Unhealthy air days now
- 1 days/yr
- Unhealthy air days in 30 yrs
- 2 days/yr
Risk factors via First Street. Map © Google.
Why this score? — see what drove the B- grade
The composite is a weighted blend of 9 inputs, each scored 0–100. Each bar is that input's sub-score; the figure is the points it added to the 100-point composite (weight × sub-score).
- Cash flow +27.9/30.0
- DSCR +9.9/10.0
- ARV discount +7.5/15.0
- 1% rule +7.0/10.0
- Appreciation +5.1/10.0
- Livability +3.4/5.0
- Schools +2.8/10.0
- Rent growth +2.5/5.0
- Condition / age +2.5/5.0
$170,000
🖨 Deal sheet 📄 Offer letter ✓ Due diligence
Listing remarks MLS
This great home has been nicely updated with newer flooring & paint and would make a great investment property or first home! This non-permanent manufactured home is located on 1.38 acres in a cul-de-sac with a detached garage + storage shed! The main living area has vaulted ceilings and an open layout. The bedrooms have a split floorplan. The front and backyard have a wood deck and the yard is fenced. Give me a call to schedule your showing!
Key facts
- Remodeled
- Plenty of storage
- New flooring
Tags
Property features AI
Finance
- Other: Lot size approximately 1.38 acres
- HOA & community: Homeowners association with monthly fee; HOA amenities include golf course and marina; HOA fee approximately $86 per month
Exterior
- Parking: 1 covered parking space; 1-car garage
- Security: Fire alarm
- Utilities: Public utilities (standard connections)
- Home design: Manufactured home; Residential property; Zoned AR
- Construction: Wood siding; Metal roof
- Exterior features: Deck; Fenced yard (full); Shed(s)
Interior
- Kitchen: Dishwasher; Oven; Range; Refrigerator
- Bedrooms: Total of 7 rooms (includes bedrooms and living spaces)
- Flooring: Carpet; Laminate
- Bathrooms: 2 full bathrooms
- Heating & cooling: Central air; Ceiling fan cooling; Forced air heating; Propane heating
- Interior features: Ceiling fans; Window coverings; Storage
- Laundry & utility: Washer; Dryer; Crawl space
Neighborhood map
What this means for you Summary
Snapshot
- This is a 3-bed/2.0-bath manufactured listed at $170k.
Deal economics
- At list price, monthly cash flow is $522 ($6k/yr) — positive.
- The deal already cash-flows at list — no discount required.
- Meets the 1% rule at list price ($2k rent vs $170k).
- Cap rate 10.0% vs local median 4.0% in Spring Creek — top-decile yield for the area; either an underpriced asset or a hidden risk that comps aren't pricing in. Stress-test before assuming the spread holds.
Location & tenants
- Location reads 68/100 on livability (#32 in NV) — a middle-class / working-renter tenant base. Strengths: employment A+, housing A+, crime B; Watch: schools C-, health & safety C-, amenities F.
- Elko County School District (town): math 22% / reading 38% proficiency, ranked #9 of 17 in NV (top 53%) — families likely to look elsewhere, expect single-tenant / working-renter base with shorter leases.
- Market conditions: 126 active listings in the ZIP; solid renter incomes; 120 units permitted in Elko County in 2024 (0 in 5+ unit buildings).
Forward outlook
- In year one you build about $1k of equity ($1k loan paydown + $185 appreciation (0.1% local appreciation)).
- Elko County population projected at +18% by 2050 — long-run rental-demand tailwind backs the buy-and-hold thesis.
- At projected returns (0.1% appreciation + 3.0% rent growth), your $48k cash investment doubles in ~6 years — after that, you're playing with house money.
Negotiation context
- Only 11 days on market — expect competitive offers; lowballing is unlikely to land.
- 3 sale attempts since 6y ago with the ask held roughly flat each time — persistent listings suggest the price (not the market) is what's stuck; bring a comps-based counter.
- Current owner paid $143k; 19% above their basis — modest negotiation headroom, anchor on the comps not their cost.
Risks & watch-outs
- Climate carrying-cost: severe wildfire risk — expect insurance premiums to compound above CPI over the hold.
Questions for the listing agent
- What does the HOA fee cover, when was the last increase, and are there any pending special assessments or reserve-fund shortfalls?
- Is there a deadline driving the sale (1031 exchange, divorce, estate, relocation)? That informs how much negotiation room exists.
- What's the average days-on-market for RENTAL listings here right now (not sales)? A rising rental-DOM trend means longer vacancies and softer asking-rent achievability than the comps imply.
- What's the recent tenant-quality profile in this submarket — average credit score on applications, eviction rate, late-payment / NSF rate, and stable-employment percentage? A property-management company in the area should have these aggregated.
- How much new for-sale + rental construction is in the pipeline within 1–3 miles? Heavy new supply typically softens prices + rents 12–24 months out; constrained supply supports both.
Investment metrics
- 1% rule
- 1.20% ✓
- Cap rate
- 9.98%
- Cash-on-cash
- 13.16%
- DSCR
- 1.59
- GRM
- 6.9
CMA / ARV
- ARV (on-the-fly)
- $170,016
- Comps found
- 10
Show comp detail 10 sales within ~0.75 mi
| Address | Dist | Beds/Ba | Sqft | Sold | Price | $/sf | Match |
|---|---|---|---|---|---|---|---|
| 398 Smokey Dr | 0.26mi | 3/2.0 | 924 (0%) | 2mo | $180,000 | $195 | 86 |
| 738 Hayland Dr | 0.32mi | 3/1.0 | 924 (0%) | 2mo | $100,000 | $108 | 79 |
| 415 Westby Dr | 0.14mi | 3/2.0 | 980 (+6%) | 12mo | $120,000 | $122 | 73 |
| 448 Merino Dr | 0.39mi | 2/2.0 (-1) | 924 (0%) | 10mo | $185,000 | $200 | 68 |
| 376 Merino Dr | 0.39mi | 3/2.0 | 924 (0%) | 20mo | $170,000 | $184 | 65 |
| 754 Cessna Ct | 0.56mi | 3/2.0 | 924 (0%) | 11mo | $132,500 | $143 | 64 |
| 676 Spring Valley Pkwy | 0.35mi | 3/2.0 | 924 (0%) | 24mo | $200,000 | $216 | 64 |
| 779 Cessna Ct | 0.63mi | 3/2.0 | 924 (0%) | 13mo | $110,000 | $119 | 60 |
| 732 Spring Valley Pkwy | 0.41mi | 3/2.0 | 980 (+6%) | 23mo | $180,000 | $184 | 51 |
| 524 Tiffany Dr | 0.71mi | 3/2.0 | 1,040 (+13%) | 6mo | $238,000 | $229 | 41 |
Match score weights: distance 35% · size 25% · config 20% · recency 20%. Top-matched comps best support the ARV.
Projected returns pro-forma
0.11% appreciation · 3.0% rent growth · sell at horizon
- IRR
- 12.7%
- Equity multiple
- 1.61×
- Total profit
- $29,124
- Equity at exit
- $50,292
- IRR
- 17.3%
- Equity multiple
- 2.92×
- Total profit
- $91,386
- Equity at exit
- $61,200
Cash invested: $47,600 (down + closing). Projections, not guarantees.
Landlord ↔ Tenant lean methodology
- Overall (STATE)
- 71 Landlord-Friendly
- State Nevada
- 71 Landlord-Friendly · R+1
- County
- — inherits STATE
- City
- — inherits STATE
ZIP-level market 89815
- Home prices YoY
- 0.1%
- Active inventory
- 126
- Price-to-rent
- 6.9×
Monthly cashflow live
- Estimated rent
- $2,048 medium interval (Pro) →
- Mortgage (P&I)
- −$891
- Tax from tax record
- −$47 /mo · $568/yr
- Insurance
- −$71
- HOA
- −$86
- Vacancy / Maint / Mgmt
- −$430
- Net cashflow
- $522
Break-even live
UW: 25.0% down · 7.5% · 30yr · 1.5% tax · 5.0% vac · 8.0% maint · 8.0% mgmt
Financing live
Cash to close
- Down payment
- $42,500
- Closing costs
- $5,100
- Reserves months
- —
- Total cash needed
- —
Loan-product check · same deal, 3 products live
Conventional
25% down · 7.5% · 30yr
- Down + closing
- —
- Monthly P&I
- —
- Monthly cashflow
- —
- DSCR
- —
- Eligible?
- —
Personal DTI + credit; lowest rate.
DSCR
20% down · 8.5% · 30yr
- Down + closing
- —
- Monthly P&I
- —
- Monthly cashflow
- —
- DSCR
- —
- Eligible?
- —
No personal income docs; deal must DSCR.
Hard money
10% down · 12.0% · 12mo
- Down + closing
- —
- Monthly P&I
- —
- Monthly cashflow
- —
- DSCR
- —
- Eligible?
- —
Short-term bridge; refi at stabilization.
HOA detail
- Monthly dues
- $86 · $1,032/yr
Listing history 9 events
-
2026-06-19days on market $170,000 Active 11 DOM
-
2026-06-18days on market $170,000 Active 10 DOM
-
2026-06-17days on market $170,000 Active 9 DOM
-
2026-06-16days on market $170,000 Active 8 DOM
-
2026-06-15days on market $170,000 Active 7 DOM
-
2026-06-14days on market $170,000 Active 5 DOM
-
2026-06-12days on market $170,000 Active 4 DOM
-
2026-06-09remarks 408-char remark
-
2026-06-09$170,000 Active 1 DOM
ⓘ Source: listings_history table (triggers on properties + properties_extension) + one-shot
backfill from property_details.listing_events for pre-trigger history.
Tax reassessment forecast NV · Resets to sale price
- Current annual tax
- $568 · $47/mo
- Projected year-2 tax
- $1,003 · $84/mo
- Expected delta
- +$435/yr (+$36/mo · 76.7%)
ⓘ Screening estimate from a state-policy table — verify with the county assessor before closing.
Climate risk First Street
- Flood 1/10 Low FEMA zone X (unshaded) · 0% chance over 30 yrs
- Wildfire 9/10 Extreme
- Heat 4/10 Moderate 7 d/yr ≥91°F today · 19 d/yr by 30 yrs out
- Wind 1/10 Low
- Air quality 2/10 Low 1 unhealthy d/yr today · 2 by 30 yrs out
Nearby sold comps map
Loading sold comps map…
Walkable amenities ~0.75 mi
Loading nearby amenities…
Taxation est. · year 1
- Rental income
- $24,570
- − Mortgage interest
- −$9,523
- − Property taxes
- −$568
- − Insurance
- −$850
- − Repairs & maintenance
- −$1,966
- − Management
- −$1,966
- − HOA
- −$1,032
- − Depreciation
- −$4,945
- Taxable income
- $3,721
- Est. tax owed @ 24.0%
- −$893
- After-tax cash flow
- $5,370/yr
For passive investors: Depreciation is non-cash, so a rental often shows a tax loss while cash-flowing — sheltering income. Rental losses are passive: they offset passive income freely, and up to $25,000/yr can offset ordinary (W-2) income if you actively participate and your MAGI is under $100k (phasing out to $0 by $150k); unused losses carry forward. On sale, claimed depreciation is recaptured at up to 25%, and gains may owe capital-gains tax (a 1031 exchange can defer both). Figures are a year-1 estimate at your 24.0% rate — not tax advice; consult a CPA.
Schools (NCES district)
- District
- Elko County School District
- NCES district ID
- 3200120
- Math proficiency
- 22% ▼ -10.00%
- Reading proficiency
- 38% ▼ -6.00%
- Median HH income
- $70,371
- Composite
- 28.09/100
- National rank
- #6831
- State rank
- #9 of 17 in NV
Livability — Spring Creek
- Score
- 68/100
- State rank
- #32
- US rank
- #9445
Category grades
Schools grade is shown separately in the Schools card above.
Census & demographics
- Census place
- Spring Creek, NV
- County
- Elko County · 15,636 people
- City population
- 15,636
- Metro
- Elko, NV
- Population (ZIP)
- 15,636
- Household income
- $102,926
- Rent vs Own
- Severe rent burden
- 172.0
Population outlook (Elko County) Hauer SSP2
- Today (2025)
- 56,797 people
- By 2030
- 59,107 · +4.1%
- By 2040
- 63,513 · +11.8%
- By 2050
- 66,996 · +18.0%
- By 2075
- 73,785 · +29.9%
- By 2100
- 72,352 · +27.4%
Race, ethnicity, and origin ACS 2023
- Neighborhood character
- Predominantly White (81%)
- Race & ethnicity
- White 81% Hispanic / Latino 10% Two or more races 9%
- Hispanic origin (detail)
- Mexican 8%
- Common ancestry
- Italian 5% Lithuanian 4% Portuguese 2%
- Foreign-born
- 3% · Canada
- Languages at home
- 94% English-only · Spanish 4%
Political lean MEDSL · Elko
- 2024 margin
- Solid R (+56.6) · D 20.6% · R 77.2% · Other 2.1%
- 2008→2024 swing
- -16.2pp toward R · 2008: -40.5pp · 2024: -56.6pp
- All cycles
- 2024: R+56.6 2020: R+55.5 2016: R+54.7 2012: R+53.2 2008: R+40.5
Not yet ingested
- Civics
- —
Market trends
- HPI YoY
- ▲ 0.11%
- Current HPI
- 160.8242
- Rent YoY
- —
- Metro
- Elko, NV
- State GDP YoY
- ▲ 3.08%
- F500 in state
- 6
Industry mix (Fortune 500 HQ in NV)
| Industry | F500 HQs | Revenue |
|---|---|---|
| Hotels / Casinos | 3 | $36B |
|
||
Price history
+1316.7% since first listed9 events — show timeline
- 2026-06-08 Listed $170,000 ECRMLS
- 2024-06-17 Sold (Public Records) $143,000 Public Records
- 2024-06-17 Sold (MLS) $143,000 ECRMLS
- 2024-04-06 Contingent — ECRMLS
- 2024-03-27 Listed $143,000 ECRMLS
- 2020-11-18 Sold (MLS) $125,000 ECRMLS
- 2020-11-17 Sold (Public Records) $125,000 Public Records
- 2020-06-12 Listed $125,000 ECRMLS
- 1994-04-15 Sold (Public Records) $12,000 Public Records
Property tax history
+3.7%/yrLatest (2025): $568 · -0.8% YoY. Source: county tax records.
Cash-flow waterfall
monthlySold comps — $/sqft
last 12 mo · ≤1 miLoading sold comps…