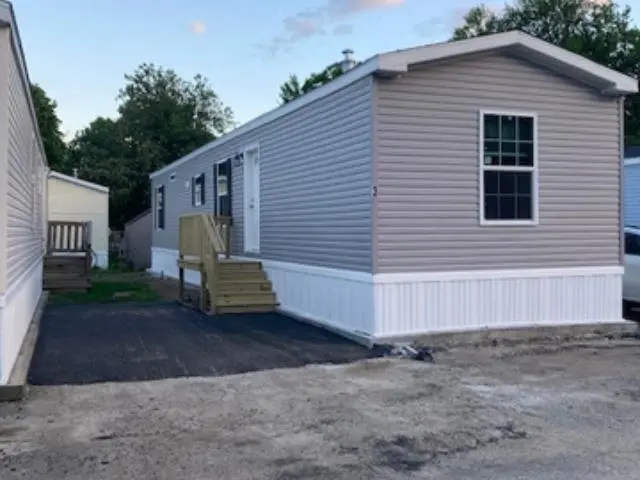
75 S Policy St #3 · Methuen Town, MA
Flood risk 1/10 · Minimal
- FEMA flood zone
- X (unshaded)
- Chance of flooding over 30 yrs
- 0.0%
- Est. flood insurance / yr
- $507 – $1,088
Fire risk 1/10 · Minimal
- Est. fire insurance / yr
- $507 – $941
Heat risk 5/10 · Moderate
- Hot days now (above 96°F)
- 7 days/yr
- Hot days in 30 yrs
- 15 days/yr
Wind risk 6/10 · Moderate
- Chance of severe wind over 30 yrs
- 27.0%
Air-quality risk 2/10 · Minimal
- Unhealthy air days now
- 2 days/yr
- Unhealthy air days in 30 yrs
- 2 days/yr
Risk factors via First Street. Map © Google.
Why this score? — see what drove the C+ grade
The composite is a weighted blend of 9 inputs, each scored 0–100. Each bar is that input's sub-score; the figure is the points it added to the 100-point composite (weight × sub-score).
- Cash flow +24.3/30.0
- DSCR +7.8/10.0
- ARV discount +7.5/15.0
- 1% rule +7.0/10.0
- Schools +4.6/10.0
- Livability +3.7/5.0
- Rent growth +3.2/5.0
- Condition / age +2.5/5.0
- Appreciation +0.0/10.0
$249,900
🖨 Deal sheet (PDF) 📄 Offer letter ✓ Due diligence
Listing remarks MLS
Well Maintained 2 Bedroom Mobile, Great Location for Commuting, Shopping and Recreation. Close to Canbobie Lake Park, Rockingham Mall and Rte 28- New Thermopane windows, New Roof with Lifetime Warranty. Mobile features 1 1/2 Baths, Screen Porch in a Nice Park!
Key facts
- Near shopping
- Near restaurants
- Near route 28
Tags
Property features AI
Finance
- HOA & community: Mobile park fee $400 monthly
Exterior
- Utilities: Public water; Public sewer; Circuit breaker electrical system; Cable internet available
- Home design: Manufactured / Mobile home; Existing structure; Lot/unit number 3; Year built 2026
- Construction: Vinyl siding; Asphalt shingle roof
- Exterior features: Located in Policy Lane Mobile Park; Mobile park approved for placement; Country setting; Near shopping; Near schools; Paved driveway; Paved road frontage
Interior
- Bathrooms: One full bathroom; One 3/4 bathroom
- Heating & cooling: Propane heat
- Interior features: 4 total rooms
Neighborhood map
What this means for you Summary
Snapshot
- This is a 2-bed/1.5-bath manufactured listed at $250k.
Deal economics
- At list price, monthly cash flow is $502 ($6k/yr) — positive.
- The deal already cash-flows at list — no discount required.
- Meets the 1% rule at list price ($3k rent vs $250k).
- Cap rate 8.7% vs local median 2.9% in Methuen Town — top-decile yield for the area; either an underpriced asset or a hidden risk that comps aren't pricing in. Stress-test before assuming the spread holds.
Location & tenants
- Location reads 73/100 on livability (#108 in MA) — a middle-class / working-renter tenant base. Strengths: housing A+, crime A, employment A; Watch: schools D+, commute D+, amenities F.
- Salem School District (suburban): math 47% / reading 56% proficiency, ranked #28 of 98 in NH (top 29%) — acceptable for families but not a draw, mixed tenant base, ~2y average lease; only 14% free/reduced lunch — higher-income household profile.
- Market conditions: Rents rising (+2.6%/yr); 9 comparable units currently listed for rent nearby; rentals leasing fast (median 2d on market — plan ~1-2 weeks tenant-placement turnaround); high-income renter base; 1,276 units permitted in Rockingham County in 2024 (593 in 5+ unit buildings).
- This rent runs 33% of the median local income ($110k/yr) — at the standard rent-burdened threshold; future hikes will face affordability resistance.
Forward outlook
- Local home prices are declining (-3.0%/yr); year-one equity from $2k of loan paydown is wiped out by about $7k of value loss. Plan a longer hold.
Negotiation context
- Only 11 days on market — expect competitive offers; lowballing is unlikely to land.
- 2 sale attempts since 16y ago with the ask held roughly flat each time — persistent listings suggest the price (not the market) is what's stuck; bring a comps-based counter.
- Current owner paid $29k; list at $250k implies a 765% gain — meaningful room to come down on a strong offer.
Risks & watch-outs
- Climate carrying-cost: major wind risk, 27% chance of damaging wind over 30y; extreme-heat days projected 7→15/yr by 2055 (HVAC capex compounding) — expect insurance premiums to compound above CPI over the hold.
Questions for the listing agent
- What does the HOA fee cover, when was the last increase, and are there any pending special assessments or reserve-fund shortfalls?
- Is there a deadline driving the sale (1031 exchange, divorce, estate, relocation)? That informs how much negotiation room exists.
- Schools are D-rated, which usually means shorter tenancies and higher turnover. Who's the typical renter profile here, and what's been the actual vacancy rate?
- What's the average days-on-market for RENTAL listings here right now (not sales)? A rising rental-DOM trend means longer vacancies and softer asking-rent achievability than the comps imply.
- What's the recent tenant-quality profile in this submarket — average credit score on applications, eviction rate, late-payment / NSF rate, and stable-employment percentage? A property-management company in the area should have these aggregated.
- How much new for-sale + rental construction is in the pipeline within 1–3 miles? Heavy new supply typically softens prices + rents 12–24 months out; constrained supply supports both.
Investment metrics
- 1% rule
- 1.20% ✓
- Cap rate
- 8.70%
- Cash-on-cash
- 8.61%
- DSCR
- 1.38
- GRM
- 6.9
CMA / ARV
- ARV (on-the-fly)
- $159,216
- Comps found
- 6
Show comp detail 6 sales within ~0.75 mi
| Address | Dist | Beds/Ba | Sqft | Sold | Price | $/sf | Match |
|---|---|---|---|---|---|---|---|
| 75 S Polcy St #45 | 0.00mi | 2/1.0 | 744 (0%) | 3mo | $135,000 | $181 | 96 |
| 75 South Policy St #48 | 0.00mi | 2/1.0 | 840 (+13%) | 6mo | $139,900 | $167 | 72 |
| 60 Brookwood Dr | 0.74mi | 2/1.0 | 728 (-2%) | 7mo | $170,000 | $234 | 54 |
| 7 Friendship Dr | 0.61mi | 2/1.0 | 770 (+4%) | 15mo | $85,000 | $110 | 51 |
| 19 Princess Dr | 0.70mi | 2/1.0 | 650 (-13%) | 11mo | $159,900 | $246 | 35 |
| 10 Princess Dr | 0.72mi | 2/1.0 | 840 (+13%) | 18mo | $179,900 | $214 | 28 |
Match score weights: distance 35% · size 25% · config 20% · recency 20%. Top-matched comps best support the ARV.
Projected returns pro-forma
-3.0% appreciation · 2.64% rent growth · sell at horizon
- IRR
- -3.6%
- Equity multiple
- 0.86×
- Total profit
- $-9,485
- Equity at exit
- $37,261
- IRR
- 5.7%
- Equity multiple
- 1.41×
- Total profit
- $29,022
- Equity at exit
- $21,607
Cash invested: $69,972 (down + closing). Projections, not guarantees.
Landlord ↔ Tenant lean methodology
- Overall (STATE)
- 20 Strongly Tenant-Friendly
- State Massachusetts
- 20 Strongly Tenant-Friendly · D+15
- County
- — inherits STATE
- City
- — inherits STATE
ZIP-level market 03079
- Rents YoY
- 2.6%
- Price-to-rent
- 6.9×
Monthly cashflow live
- Estimated rent
- $3,007 high interval (Pro) →
- Mortgage (P&I)
- −$1,311
- Tax from tax record
- −$59 /mo · $708/yr
- Insurance
- −$104
- HOA
- −$400
- Vacancy / Maint / Mgmt
- −$631
- Net cashflow
- $502
Break-even live
Sensitivity live
| Price | -10% $643 | -5% $573 | +0% $502 | +5% $431 | +10% $360 |
|---|---|---|---|---|---|
| Rent | -10% $264 | -5% $383 | +0% $502 | +5% $621 | +10% $739 |
| Rate | -1.0pp $628 | -0.5pp $565 | base $502 | +0.5pp $437 | +1.0pp $371 |
UW: 25.0% down · 7.5% · 30yr · 1.5% tax · 5.0% vac · 8.0% maint · 8.0% mgmt
Financing live
Cash to close
- Down payment
- $62,475
- Closing costs
- $7,497
- Reserves months
- —
- Total cash needed
- —
Loan-product check · same deal, 3 products live
Conventional
25% down · 7.5% · 30yr
- Down + closing
- —
- Monthly P&I
- —
- Monthly cashflow
- —
- DSCR
- —
- Eligible?
- —
Personal DTI + credit; lowest rate.
DSCR
20% down · 8.5% · 30yr
- Down + closing
- —
- Monthly P&I
- —
- Monthly cashflow
- —
- DSCR
- —
- Eligible?
- —
No personal income docs; deal must DSCR.
Hard money
10% down · 12.0% · 12mo
- Down + closing
- —
- Monthly P&I
- —
- Monthly cashflow
- —
- DSCR
- —
- Eligible?
- —
Short-term bridge; refi at stabilization.
Rent comps 9 comps
| Address | Beds | Baths | Sqft | Rent | $/sqft | DOM | Units | Dist |
|---|---|---|---|---|---|---|---|---|
| 103 S Policy St Unit 4 Salem, NH | 1.0 | 1.0 | 650 | $2,000 | $3.08 | 15d | 1 | 0.23mi |
| 3 Artisan Dr Salem, NH | 2.0 | 1.0–2.0 | 920 | $4,401 | $4.78 | 2d | 43 | 0.30mi |
| 4 Tuscan Blvd Salem, NH | 2.0 | 1.0–2.0 | 739 | $3,390 | $4.58 | 2d | 18 | 0.40mi |
| 15 Artisan Dr Salem, NH | 2.0 | 1.0–2.0 | 910 | $3,873 | $4.26 | 2d | 35 | 0.41mi |
| 800 Central St Salem, NH | 2.0 | 1.0–2.0 | 776 | $2,825 | $3.64 | 2d | 14 | 0.49mi |
| 22 Via Toscana Salem, NH | 2.0 | 1.0–2.0 | 846 | $4,598 | $5.43 | 2d | 61 | 0.59mi |
| 11 Lancelot Ct #7 Salem, NH | 2.0 | 1.0 | 676 | $1,850 | $2.74 | 5d | 1 | 0.76mi |
| 3 Lancelot Ct Salem, NH | 2.0 | 1.0 | 736 | $1,800 | $2.45 | 44d | 1 | 0.85mi |
| 1 Lancelot Ct #2 Salem, NH | 2.0 | 1.0 | 728 | $1,950 | $2.68 | 24d | 1 | 0.85mi |
HOA detail
- Monthly dues
- $400 · $4,800/yr
Listing history 8 events
-
2026-06-18days on market $249,900 Active 11 DOM
-
2026-06-17days on market $249,900 Active 10 DOM
-
2026-06-16days on market $249,900 Active 9 DOM
-
2026-06-15days on market $249,900 Active 8 DOM
-
2026-06-13days on market $249,900 Active 6 DOM
-
2026-06-09days on market $249,900 Active 2 DOM
-
2026-06-08remarks 613-char remark
-
2026-06-08$249,900 Active 1 DOM
ⓘ Source: listings_history table (triggers on properties + properties_extension) + one-shot
backfill from property_details.listing_events for pre-trigger history.
Tax reassessment forecast MA · Partial reset (capped growth)
- Current annual tax
- $708 · $59/mo
- Projected year-2 tax
- $1,891 · $158/mo
- Expected delta
- +$1,183/yr (+$99/mo · 167.1%)
ⓘ Screening estimate from a state-policy table — verify with the county assessor before closing.
Climate risk First Street
- Flood 1/10 Low FEMA zone X (unshaded) · 0% chance over 30 yrs
- Wildfire 1/10 Low
- Heat 5/10 Major 7 d/yr ≥96°F today · 15 d/yr by 30 yrs out
- Wind 6/10 Major 27% chance of damaging wind over 30 yrs
- Air quality 2/10 Low 2 unhealthy d/yr today · 2 by 30 yrs out
Nearby sold comps map
Loading sold comps map…
Walkable amenities ~0.75 mi
Loading nearby amenities…
Taxation est. · year 1
- Rental income
- $36,082
- − Mortgage interest
- −$13,998
- − Property taxes
- −$708
- − Insurance
- −$1,250
- − Repairs & maintenance
- −$2,887
- − Management
- −$2,887
- − HOA
- −$4,800
- − Depreciation
- −$7,270
- Taxable income
- $2,283
- Est. tax owed @ 24.0%
- −$548
- After-tax cash flow
- $5,473/yr
For passive investors: Depreciation is non-cash, so a rental often shows a tax loss while cash-flowing — sheltering income. Rental losses are passive: they offset passive income freely, and up to $25,000/yr can offset ordinary (W-2) income if you actively participate and your MAGI is under $100k (phasing out to $0 by $150k); unused losses carry forward. On sale, claimed depreciation is recaptured at up to 25%, and gains may owe capital-gains tax (a 1031 exchange can defer both). Figures are a year-1 estimate at your 24.0% rate — not tax advice; consult a CPA.
Schools (NCES district)
- District
- Salem School District
- NCES district ID
- 3306060
- Math proficiency
- 47% ▼ -4.00%
- Reading proficiency
- 56% ▼ -2.00%
- Median HH income
- $75,648
- Composite
- 46.45/100
- National rank
- #2446
- State rank
- #28 of 98 in NH
Livability — Methuen Town
- Score
- 73/100
- State rank
- #108
- US rank
- #5537
Category grades
Schools grade is shown separately in the Schools card above.
Census & demographics
- County
- Rockingham County
- City population
- 53,015
- Metro
- Boston-Cambridge-Newton, MA-NH
- Population (ZIP)
- 30,964
- Household income
- $110,490
- Rent vs Own
- Severe rent burden
- 702.0
Population outlook (Rockingham County) Hauer SSP2
- Today (2025)
- 316,118 people
- By 2030
- 320,929 · +1.5%
- By 2040
- 323,358 · +2.3%
- By 2050
- 314,977 · -0.4%
- By 2075
- 297,686 · -5.8%
- By 2100
- 256,363 · -18.9%
Race, ethnicity, and origin ACS 2023
- Neighborhood character
- Predominantly White (82%)
- Race & ethnicity
- White 82% Hispanic / Latino 9% Two or more races 4% Asian 4%
- Hispanic origin (detail)
- Puerto Rican 2% Dominican 4%
- Common ancestry
- Lithuanian 9% Romanian 4% Russian 4%
- Foreign-born
- 11% · Canada, Vietnam, South Korea
- Languages at home
- 88% English-only · Spanish 6% Other Asian/Pacific 2% Other Indo-European 1%
Political lean MEDSL · Rockingham
- 2024 margin
- Toss-up / Even · D 48.3% · R 50.8%
- 2008→2024 swing
- -3.5pp toward R · 2008: 1.1pp · 2024: -2.4pp
- All cycles
- 2024: R+2.4 2020: D+2.1 2016: R+5.8 2012: R+4.5 2008: D+1.1
Not yet ingested
- Civics
- —
Market trends
- HPI YoY
- ▼ -265.55%
- Current HPI
- 311.547
- Rent YoY
- ▲ 2.64%
- Metro
- Boston-Cambridge-Newton, MA-NH
- State GDP YoY
- ▲ 2.28%
- F500 in state
- 38
Industry mix (Fortune 500 HQ in MA)
| Industry | F500 HQs | Revenue |
|---|---|---|
| Technology | 3 | $17B |
|
||
| Insurance | 2 | $84B |
|
||
| Retail | 2 | $76B |
|
||
| Life Sciences | 1 | $43B |
|
||
| Energy Technology | 1 | $31B |
|
||
| Aerospace / Defense | 1 | $18B |
|
||
Price history
+735.8% since first listed3 events — show timeline
- 2026-06-07 Listed $249,900 PrimeMLS
- 2010-09-15 Sold (MLS) $28,900 PrimeMLS
- 2010-07-27 Listed $29,900 PrimeMLS
Property tax history
+3.9%/yrLatest (2025): $708 · +3.2% YoY. Source: county tax records.
Cash-flow waterfall
monthlySold comps — $/sqft
last 12 mo · ≤1 miLoading sold comps…