31 Campigatta Holw · Van Lear, KY
Flood risk 10/10 · Severe
- FEMA flood zone
- X (shaded)
- Chance of flooding over 30 yrs
- 0.99%
- Est. flood insurance / yr
- $507 – $1,088
Fire risk 4/10 · Minor
- Est. fire insurance / yr
- $839 – $1,559
Heat risk 4/10 · Minor
- Hot days now (above 104°F)
- 7 days/yr
- Hot days in 30 yrs
- 20 days/yr
Wind risk 2/10 · Minimal
- Chance of severe wind over 30 yrs
- 2.0%
Air-quality risk 1/10 · Minimal
- Unhealthy air days now
- 0 days/yr
- Unhealthy air days in 30 yrs
- 0 days/yr
Risk factors via First Street. Map © Google.
Why this score? — see what drove the B- grade
The composite is a weighted blend of 9 inputs, each scored 0–100. Each bar is that input's sub-score; the figure is the points it added to the 100-point composite (weight × sub-score).
- Cash flow +30.0/30.0
- DSCR +10.0/10.0
- 1% rule +8.0/10.0
- ARV discount +7.5/15.0
- Appreciation +2.6/10.0
- Rent growth +2.5/5.0
- Schools +2.5/10.0
- Livability +2.5/5.0
- Condition / age +2.5/5.0
$80,000
🖨 Deal sheet 📄 Offer letter ✓ Due diligence
Listing remarks
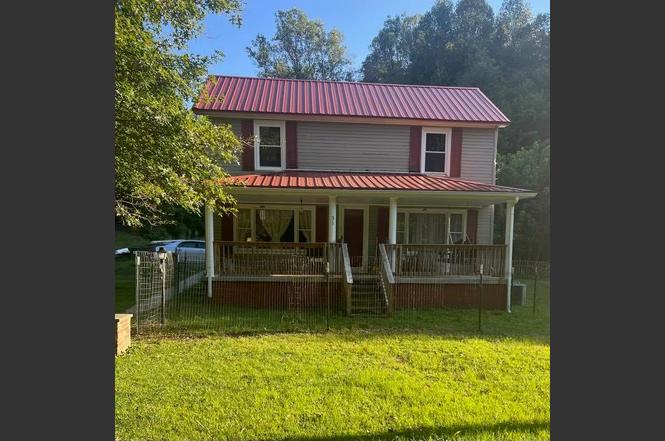
REDUCED!! Want to sell! Ready to sell! Quiet, serene, easily accessible. .. Lots remodeled and new - Brand new metal roof, 11 new windows, new wiring throughout, new plumbing to the meter, bathroom and utility rm remodeled this year. See Sellers Disclosure for extensive list
Key facts
- Metal roof
- New plumbing
- New wiring
Tags
Property features AI
Exterior
- Parking: Concrete parking
- Utilities: Public water; Septic tank sewer
- Home design: Single family residence; One story
- Construction: Vinyl siding; Metal roof
- Exterior features: Garden; Patio; Storage structure
Interior
- Kitchen: Dishwasher; Refrigerator; Cooktop
- Flooring: Laminate flooring; Vinyl flooring
- Bathrooms: One three-quarter bathroom
- Heating & cooling: Electric heating; Ceiling fan(s) for cooling
- Interior features: Window coverings; 5 total rooms
Neighborhood map
What this means for you Summary
Snapshot
- This is a 2-bed/1.0-bath single-family listed at $80k.
Deal economics
- At list price, monthly cash flow is $270 ($3k/yr) — positive.
- The deal already cash-flows at list — no discount required.
- Meets the 1% rule at list price ($1k rent vs $80k).
- Recommended offer: $73k (9.0% below list) — sets the bar for market timing.
Location & tenants
- Location reads: area grade B — affects rentability + tenant quality, not the cash-flow math above.
- Johnson County (rural): math 23% / reading 39% proficiency, ranked #103 of 165 in KY (top 62%) — families likely to look elsewhere, expect single-tenant / working-renter base with shorter leases.
- Zoned schools: Porter Elementary School (math 17% / reading 37%, grade F, #434 of 676 statewide, top 69%, 412 students, 55% FRL); Johnson County Middle School (math 25% / reading 49%, grade F, #80 of 217 statewide, top 41%, 475 students, 61% FRL); Johnson Central High School (math 20% / reading 25%, grade F, #200 of 254 statewide, top 79%, 955 students, 61% FRL) — zoned schools at 59% FRL track the district average.
- Market conditions: 13 active listings in the ZIP.
Forward outlook
- Local home prices are declining (-3.0%/yr); year-one equity from $553 of loan paydown is wiped out by about $2k of value loss. Plan a longer hold.
- Johnson County population projected at -18% by 2050 — secular population decline; favor cash flow + early exit over multi-decade hold.
- At projected returns (-3.0% appreciation + 3.0% rent growth), your $22k cash investment doubles in ~9 years — after that, you're playing with house money.
Negotiation context
- It's been on market 119 days — a 9% lower offer ($73k) is reasonable based on typical stale-listing flexibility.
- 2 sale attempts; this cycle's ask has dropped $30k (27%) from the opening price — seller is motivated, your offer sets the floor, not the list.
Risks & watch-outs
- Watch-outs: flood insurance adds $66/mo; built in 1930 — expect roof / HVAC / electrical / plumbing capex.
- Climate carrying-cost: severe flood risk — expect insurance premiums to compound above CPI over the hold.
Questions for the listing agent
- It's been on market 119 days. Have you received any prior offers? Is the seller open to a 9% concession, seller financing, or rate buy-down credit?
- Built in 1930 — when were the roof, HVAC, electrical panel, plumbing, and water heater last replaced?
- What's the actual annual flood-insurance premium (NFIP or private), and is the property in a SFHA with mandatory coverage?
- Why hasn't it sold? Are there any deal-killer items the seller is aware of (foundation, flood, title, zoning, code violations)?
- Is there a deadline driving the sale (1031 exchange, divorce, estate, relocation)? That informs how much negotiation room exists.
- What's the average days-on-market for RENTAL listings here right now (not sales)? A rising rental-DOM trend means longer vacancies and softer asking-rent achievability than the comps imply.
- What's the recent tenant-quality profile in this submarket — average credit score on applications, eviction rate, late-payment / NSF rate, and stable-employment percentage? A property-management company in the area should have these aggregated.
- How much new for-sale + rental construction is in the pipeline within 1–3 miles? Heavy new supply typically softens prices + rents 12–24 months out; constrained supply supports both.
Investment metrics
- 1% rule
- 1.30% ✓
- Cap rate
- 11.35%
- Cash-on-cash
- 18.05%
- DSCR
- 1.80
- GRM
- 6.4
CMA / ARV
No comps found within radius.
Projected returns pro-forma
-3.0% appreciation · 3.0% rent growth · sell at horizon
- IRR
- 4.9%
- Equity multiple
- 1.19×
- Total profit
- $4,277
- Equity at exit
- $11,928
- IRR
- 14.4%
- Equity multiple
- 2.16×
- Total profit
- $25,960
- Equity at exit
- $6,917
Cash invested: $22,400 (down + closing). Projections, not guarantees.
Landlord ↔ Tenant lean methodology
- Overall (STATE)
- 83 Strongly Landlord-Friendly
- State Kentucky
- 83 Strongly Landlord-Friendly · R+16
- County
- — inherits STATE
- City
- — inherits STATE
ZIP-level market 41265
- Home prices YoY
- -2.0%
- Active inventory
- 13
- Price-to-rent
- 6.4×
Monthly cashflow live
- Estimated rent
- $1,036 medium interval (Pro) →
- Mortgage (P&I)
- −$420
- Tax from tax record
- −$29 /mo · $344/yr
- Insurance
- −$33
- Flood insurance flood zone
- −$66 /mo · $798/yr
- HOA
- −$0
- Vacancy / Maint / Mgmt
- −$218
- Net cashflow
- $270
Break-even live
UW: 25.0% down · 7.5% · 30yr · 1.5% tax · 5.0% vac · 8.0% maint · 8.0% mgmt
Financing live
Cash to close
- Down payment
- $20,000
- Closing costs
- $2,400
- Reserves months
- —
- Total cash needed
- —
Loan-product check · same deal, 3 products live
Conventional
25% down · 7.5% · 30yr
- Down + closing
- —
- Monthly P&I
- —
- Monthly cashflow
- —
- DSCR
- —
- Eligible?
- —
Personal DTI + credit; lowest rate.
DSCR
20% down · 8.5% · 30yr
- Down + closing
- —
- Monthly P&I
- —
- Monthly cashflow
- —
- DSCR
- —
- Eligible?
- —
No personal income docs; deal must DSCR.
Hard money
10% down · 12.0% · 12mo
- Down + closing
- —
- Monthly P&I
- —
- Monthly cashflow
- —
- DSCR
- —
- Eligible?
- —
Short-term bridge; refi at stabilization.
Listing history 20 events
-
2026-06-18days on market $80,000 Active 119 DOM
-
2026-06-17days on market $80,000 Active 118 DOM
-
2026-06-16days on market $80,000 Active 117 DOM
-
2026-06-16remarks 278-char remark
-
2026-06-16price $80,000 Active 116 DOM
-
2026-06-15days on market $90,000 Active 116 DOM
-
2026-06-13days on market $90,000 Active 114 DOM
-
2026-06-12days on market $90,000 Active 113 DOM
-
2026-06-09days on market $90,000 Active 110 DOM
-
2026-06-08days on market $90,000 Active 109 DOM
-
2026-06-07days on market $90,000 Active 108 DOM
-
2026-06-04days on market $90,000 Active 104 DOM
-
2026-06-02days on market $90,000 Active 103 DOM
-
2026-06-01days on market $90,000 Active 102 DOM
-
2026-05-31days on market $90,000 Active 101 DOM
-
2026-05-31days on market $90,000 Active 100 DOM
-
2026-02-19price $100,000
-
2026-02-19price $110,000
-
2026-02-19$110,000 Active
-
2025-11-05$120,000 Active
ⓘ Source: listings_history table (triggers on properties + properties_extension) + one-shot
backfill from property_details.listing_events for pre-trigger history.
Tax reassessment forecast KY · Resets to sale price
- Current annual tax
- $344 · $29/mo
- Projected year-2 tax
- $688 · $57/mo
- Expected delta
- +$344/yr (+$29/mo · 100.2%)
ⓘ Screening estimate from a state-policy table — verify with the county assessor before closing.
Climate risk First Street
- Flood 10/10 Extreme FEMA zone X (shaded) · 99% chance over 30 yrs
- Wildfire 4/10 Moderate
- Heat 4/10 Moderate 7 d/yr ≥104°F today · 20 d/yr by 30 yrs out
- Wind 2/10 Low 2% chance of damaging wind over 30 yrs
- Air quality 1/10 Low 0 unhealthy d/yr today · 0 by 30 yrs out
Nearby sold comps map
Loading sold comps map…
Walkable amenities ~0.75 mi
Loading nearby amenities…
Taxation est. · year 1
- Rental income
- $12,432
- − Mortgage interest
- −$4,481
- − Property taxes
- −$344
- − Insurance
- −$1,198
- − Repairs & maintenance
- −$995
- − Management
- −$995
- − Depreciation
- −$2,327
- Taxable income
- $2,093
- Est. tax owed @ 24.0%
- −$502
- After-tax cash flow
- $2,744/yr
For passive investors: Depreciation is non-cash, so a rental often shows a tax loss while cash-flowing — sheltering income. Rental losses are passive: they offset passive income freely, and up to $25,000/yr can offset ordinary (W-2) income if you actively participate and your MAGI is under $100k (phasing out to $0 by $150k); unused losses carry forward. On sale, claimed depreciation is recaptured at up to 25%, and gains may owe capital-gains tax (a 1031 exchange can defer both). Figures are a year-1 estimate at your 24.0% rate — not tax advice; consult a CPA.
Schools (NCES district)
- District
- Johnson County
- NCES district ID
- 2103060
- Math proficiency
- 23% ▼ -26.00%
- Reading proficiency
- 39% ▼ -23.00%
- Median HH income
- $34,508
- Composite
- 25.49/100
- National rank
- #7441
- State rank
- #103 of 165 in KY
Livability — Van Lear
No livability data for this city. (Only ~50 U.S. cities are tracked.)
Census & demographics
- Census place
- Van Lear, KY
- Population (ZIP)
- 1,114
Population outlook (Johnson County) Hauer SSP2
- Today (2025)
- 22,330 people
- By 2030
- 21,570 · -3.4%
- By 2040
- 19,849 · -11.1%
- By 2050
- 18,204 · -18.5%
- By 2075
- 14,588 · -34.7%
- By 2100
- 11,127 · -50.2%
Race, ethnicity, and origin ACS 2023
- Neighborhood character
- Predominantly White (89%)
- Race & ethnicity
- White 89% Two or more races 6% Hispanic / Latino 5% Black 4% Native American 1%
- Hispanic origin (detail)
- Mexican 5%
- Common ancestry
- Slovak 2% Iranian 1%
- Foreign-born
- 5% · Canada, Jamaica
- Languages at home
- 95% English-only · Spanish 5%
Political lean MEDSL · Johnson
- 2024 margin
- Solid R (+70.7) · D 14.0% · R 84.7% · Other 1.3%
- 2008→2024 swing
- -29.1pp toward R · 2008: -41.6pp · 2024: -70.7pp
- All cycles
- 2024: R+70.7 2020: R+67.1 2016: R+71.0 2012: R+59.5 2008: R+41.6
Not yet ingested
- Civics
- —
Market trends
- HPI YoY
- ▼ -4.84%
- Current HPI
- 236.5048
- Rent YoY
- —
- Metro
- —
- State GDP YoY
- ▲ 1.81%
- F500 in state
- 4
Industry mix (Fortune 500 HQ in KY)
| Industry | F500 HQs | Revenue |
|---|---|---|
| Healthcare | 1 | $118B |
|
||
| Food / Beverage | 1 | $7B |
|
||
Price history
-16.7% since first listed4 events — show timeline
- 2026-02-19 Price Changed $100,000 EKAR
- 2026-02-19 Price Changed $110,000 EKAR
- 2026-02-19 Listed $110,000 EKAR
- 2025-11-05 Listed $120,000 EKAR
Property tax history
+62.9%/yrLatest (2019): $344 · +1045.5% YoY. Source: county tax records.
Cash-flow waterfall
monthlySold comps — $/sqft
last 12 mo · ≤1 miLoading sold comps…