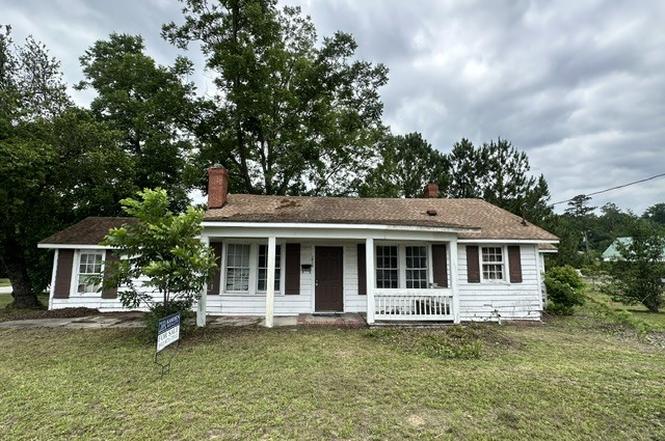
1012 S Main St · Sylvania, GA
Flood risk 1/10 · Minimal
- FEMA flood zone
- X (unshaded)
- Chance of flooding over 30 yrs
- 0.0%
- Est. flood insurance / yr
- $507 – $1,088
Fire risk 4/10 · Minor
- Est. fire insurance / yr
- $963 – $1,789
Heat risk 8/10 · Major
- Hot days now (above 108°F)
- 7 days/yr
- Hot days in 30 yrs
- 18 days/yr
Wind risk 8/10 · Major
- Chance of severe wind over 30 yrs
- 80.0%
Air-quality risk 3/10 · Minor
- Unhealthy air days now
- 3 days/yr
- Unhealthy air days in 30 yrs
- 3 days/yr
Risk factors via First Street. Map © Google.
Why this score? — see what drove the B+ grade
The composite is a weighted blend of 9 inputs, each scored 0–100. Each bar is that input's sub-score; the figure is the points it added to the 100-point composite (weight × sub-score).
- Cash flow +30.0/30.0
- ARV discount +15.0/15.0
- 1% rule +10.0/10.0
- DSCR +10.0/10.0
- Livability +3.2/5.0
- Schools +3.0/10.0
- Rent growth +2.5/5.0
- Condition / age +2.5/5.0
- Appreciation +0.0/10.0
$89,999
🖨 Deal sheet 📄 Offer letter ✓ Due diligence
Listing remarks
LOCATION! LOCATION! LOCATION! Opportunity awaits with this charming 3 bedroom, 1 bath home located right on South Main St in the heart of Sylvania. Offering approximately 1224 sq ft this property is full of potential and ready for your vision. Featuring a spacious living room with a fireplace, original character throughout, a covered front porch and large yard, this home could be trasnformed into the perfect starter home, rental property or investment opportunity. With the right repairs and updates, this property has the potential to shine once again, Conveniently located near shopping, dining, schools and downtown Sylvania, you'll love the accessibility and small town charm this locatio
Key facts
- Covered front porch
- Large yard
- Spacious living room
Tags
Property features AI
Finance
- Other: Lot size approximately 0.35 acre
- HOA & community: No HOA
Exterior
- Parking: No dedicated parking listed
- Utilities: Public water; Public sewer; Electricity available
- Home design: Single family residence (house); Resale property; Built in 1940
- Construction: Wood siding; Composition roof; One story
- Exterior features: Corner lot
Interior
- Kitchen: No appliances specified
- Bedrooms: 3 bedrooms on the main level
- Flooring: Other flooring
- Bathrooms: 1 full bathroom on the main level
- Heating & cooling: Heating present (other type); Cooling present (other type)
- Interior features: One-level living; Family room; Mud room/laundry area; Fireplace (1)
- Laundry & utility: Mud room for laundry/utility
Neighborhood map
What this means for you Summary
Snapshot
- This is a 3-bed/1.0-bath single-family listed at $90k.
Deal economics
- At list price, monthly cash flow is $548 ($7k/yr) — positive.
- The deal already cash-flows at list — no discount required.
- Meets the 1% rule at list price ($1k rent vs $90k).
- Recommended offer: $89k (1.5% below list) — sets the bar for market timing.
- Cap rate 13.6% vs local median 4.3% in Sylvania — top-decile yield for the area; either an underpriced asset or a hidden risk that comps aren't pricing in. Stress-test before assuming the spread holds.
Location & tenants
- Location reads 64/100 on livability (#259 in GA) — a middle-class / working-renter tenant base. Strengths: crime A+, cost of living A+, housing A; Watch: health & safety C-, amenities F, commute F.
- Screven County (town): math 39% / reading 33% proficiency, ranked #66 of 174 in GA (top 38%) — families likely to look elsewhere, expect single-tenant / working-renter base with shorter leases; 65% free/reduced lunch — lower-income household profile, screen leases tightly.
- Zoned schools: Screven County Elementary School (math 40% / reading 29%, grade F, #531 of 1,228 statewide, top 45%, 1,004 students, 81% FRL) — zoned schools average 81% FRL vs 65% district-wide (16 pts higher); higher-poverty schools than district average — tighter screening recommended.
- Market conditions: 76 active listings in the ZIP; 23 units permitted in Screven County in 2024 (0 in 5+ unit buildings).
Forward outlook
- Local home prices are declining (-3.0%/yr); year-one equity from $622 of loan paydown is wiped out by about $3k of value loss. Plan a longer hold.
- Screven County population projected at -21% by 2050 — secular population decline; favor cash flow + early exit over multi-decade hold.
- At projected returns (-3.0% appreciation + 3.0% rent growth), your $25k cash investment doubles in ~5 years — after that, you're playing with house money.
Negotiation context
- It's been on market 16 days — a 2% lower offer ($89k) is reasonable based on typical stale-listing flexibility.
Risks & watch-outs
- Watch-outs: built in 1940 — expect roof / HVAC / electrical / plumbing capex.
- Climate carrying-cost: severe wind risk, 80% chance of damaging wind over 30y; extreme-heat days projected 7→18/yr by 2055 (HVAC capex compounding) — expect insurance premiums to compound above CPI over the hold.
Questions for the listing agent
- Built in 1940 — when were the roof, HVAC, electrical panel, plumbing, and water heater last replaced?
- Is there a deadline driving the sale (1031 exchange, divorce, estate, relocation)? That informs how much negotiation room exists.
- Schools are D-rated, which usually means shorter tenancies and higher turnover. Who's the typical renter profile here, and what's been the actual vacancy rate?
- What's the average days-on-market for RENTAL listings here right now (not sales)? A rising rental-DOM trend means longer vacancies and softer asking-rent achievability than the comps imply.
- What's the recent tenant-quality profile in this submarket — average credit score on applications, eviction rate, late-payment / NSF rate, and stable-employment percentage? A property-management company in the area should have these aggregated.
- How much new for-sale + rental construction is in the pipeline within 1–3 miles? Heavy new supply typically softens prices + rents 12–24 months out; constrained supply supports both.
Investment metrics
- 1% rule
- 1.58% ✓
- Cap rate
- 13.60%
- Cash-on-cash
- 26.08%
- DSCR
- 2.16
- GRM
- 5.3
CMA / ARV
- ARV (on-the-fly)
- $137,088
- Comps found
- 7
Show comp detail 7 sales within ~0.75 mi
| Address | Dist | Beds/Ba | Sqft | Sold | Price | $/sf | Match |
|---|---|---|---|---|---|---|---|
| 123 Hiers Ave | 0.20mi | 3/1.0 | 1,056 (-14%) | 1mo | $115,000 | $109 | 67 |
| 502 S Hull St | 0.47mi | 3/1.0 | 1,115 (-9%) | 4mo | $130,400 | $117 | 60 |
| 607 S Hull St | 0.39mi | 3/2.0 | 1,125 (-8%) | 5mo | $135,000 | $120 | 60 |
| 221 Sylvan Heights Dr | 0.68mi | 3/2.0 | 1,248 (+2%) | 2mo | $195,000 | $156 | 59 |
| 126 Lee St | 0.32mi | 3/2.0 | 1,092 (-11%) | 14mo | $117,000 | $107 | 51 |
| 222 Syvan Heights Dr | 0.67mi | 2/1.0 (-1) | 1,072 (-12%) | 1mo | $120,000 | $112 | 42 |
| 120 Dixie Ave | 0.28mi | 2/1.5 (-1) | 1,404 (+15%) | 17mo | $71,250 | $51 | 41 |
Match score weights: distance 35% · size 25% · config 20% · recency 20%. Top-matched comps best support the ARV.
Projected returns pro-forma
-3.0% appreciation · 3.0% rent growth · sell at horizon
- IRR
- 19.8%
- Equity multiple
- 1.81×
- Total profit
- $20,292
- Equity at exit
- $13,419
- IRR
- 28.1%
- Equity multiple
- 3.48×
- Total profit
- $62,554
- Equity at exit
- $7,781
Cash invested: $25,200 (down + closing). Projections, not guarantees.
Landlord ↔ Tenant lean methodology
- Overall (STATE)
- 90 Strongly Landlord-Friendly
- State Georgia
- 90 Strongly Landlord-Friendly · R+3
- County
- — inherits STATE
- City
- — inherits STATE
ZIP-level market 30467
- Home prices YoY
- -14.3%
- Active inventory
- 76
- Price-to-rent
- 5.3×
Monthly cashflow live
- Estimated rent
- $1,419 medium interval (Pro) →
- Mortgage (P&I)
- −$472
- Tax from tax record
- −$64 /mo · $763/yr
- Insurance
- −$37
- HOA
- −$0
- Vacancy / Maint / Mgmt
- −$298
- Net cashflow
- $548
Break-even live
UW: 25.0% down · 7.5% · 30yr · 1.5% tax · 5.0% vac · 8.0% maint · 8.0% mgmt
Financing live
Cash to close
- Down payment
- $22,500
- Closing costs
- $2,700
- Reserves months
- —
- Total cash needed
- —
Loan-product check · same deal, 3 products live
Conventional
25% down · 7.5% · 30yr
- Down + closing
- —
- Monthly P&I
- —
- Monthly cashflow
- —
- DSCR
- —
- Eligible?
- —
Personal DTI + credit; lowest rate.
DSCR
20% down · 8.5% · 30yr
- Down + closing
- —
- Monthly P&I
- —
- Monthly cashflow
- —
- DSCR
- —
- Eligible?
- —
No personal income docs; deal must DSCR.
Hard money
10% down · 12.0% · 12mo
- Down + closing
- —
- Monthly P&I
- —
- Monthly cashflow
- —
- DSCR
- —
- Eligible?
- —
Short-term bridge; refi at stabilization.
Listing history 13 events
-
2026-06-19days on market $89,999 Active 16 DOM
-
2026-06-18days on market $89,999 Active 15 DOM
-
2026-06-17statusdays on market $89,999 Active 14 DOM
-
2026-06-16days on market $89,999 New 13 DOM
-
2026-06-15days on market $89,999 New 12 DOM
-
2026-06-14days on market $89,999 New 10 DOM
-
2026-06-13days on market $89,999 New 9 DOM
-
2026-06-10days on market $89,999 New 7 DOM
-
2026-06-09days on market $89,999 New 6 DOM
-
2026-06-08days on market $89,999 New 5 DOM
-
2026-06-07days on market $89,999 New 4 DOM
-
2026-06-03remarks 699-char remark
-
2026-06-03$89,999 New 1 DOM
ⓘ Source: listings_history table (triggers on properties + properties_extension) + one-shot
backfill from property_details.listing_events for pre-trigger history.
Tax reassessment forecast GA · Resets to sale price
- Current annual tax
- $763 · $64/mo
- Projected year-2 tax
- $828 · $69/mo
- Expected delta
- +$65/yr (+$5/mo · 8.5%)
ⓘ Screening estimate from a state-policy table — verify with the county assessor before closing.
Climate risk First Street
- Flood 1/10 Low FEMA zone X (unshaded) · 0% chance over 30 yrs
- Wildfire 4/10 Moderate
- Heat 8/10 Severe 7 d/yr ≥108°F today · 18 d/yr by 30 yrs out
- Wind 8/10 Severe 80% chance of damaging wind over 30 yrs
- Air quality 3/10 Moderate 3 unhealthy d/yr today · 3 by 30 yrs out
Nearby sold comps map
Loading sold comps map…
Walkable amenities ~0.75 mi
Loading nearby amenities…
Taxation est. · year 1
- Rental income
- $17,025
- − Mortgage interest
- −$5,041
- − Property taxes
- −$763
- − Insurance
- −$450
- − Repairs & maintenance
- −$1,362
- − Management
- −$1,362
- − Depreciation
- −$2,618
- Taxable income
- $5,428
- Est. tax owed @ 24.0%
- −$1,303
- After-tax cash flow
- $5,270/yr
For passive investors: Depreciation is non-cash, so a rental often shows a tax loss while cash-flowing — sheltering income. Rental losses are passive: they offset passive income freely, and up to $25,000/yr can offset ordinary (W-2) income if you actively participate and your MAGI is under $100k (phasing out to $0 by $150k); unused losses carry forward. On sale, claimed depreciation is recaptured at up to 25%, and gains may owe capital-gains tax (a 1031 exchange can defer both). Figures are a year-1 estimate at your 24.0% rate — not tax advice; consult a CPA.
Schools (NCES district)
- District
- Screven County
- NCES district ID
- 1304500
- Math proficiency
- 39% ▼ -3.00%
- Reading proficiency
- 33% ▼ -4.00%
- Median HH income
- $34,477
- Composite
- 29.72/100
- National rank
- #6447
- State rank
- #66 of 174 in GA
Livability — Sylvania
- Score
- 64/100
- State rank
- #259
- US rank
- #14225
Category grades
Schools grade is shown separately in the Schools card above.
Census & demographics
- Census place
- Sylvania, GA
- Population (ZIP)
- 11,606
Population outlook (Screven County) Hauer SSP2
- Today (2025)
- 13,462 people
- By 2030
- 12,957 · -3.8%
- By 2040
- 11,853 · -12.0%
- By 2050
- 10,686 · -20.6%
- By 2075
- 8,272 · -38.6%
- By 2100
- 6,545 · -51.4%
Race, ethnicity, and origin ACS 2023
- Neighborhood character
- Majority White (53%)
- Race & ethnicity
- White 53% Black 42% Two or more races 5% Hispanic / Latino 2%
- Common ancestry
- Italian 3% Danish 1% Slovak 1%
- Foreign-born
- 0% · Canada
- Languages at home
- 98% English-only · Spanish 1%
Political lean MEDSL · Screven
- 2024 margin
- Strong R (+25.2) · D 37.3% · R 62.5%
- 2008→2024 swing
- -19.0pp toward R · 2008: -6.2pp · 2024: -25.2pp
- All cycles
- 2024: R+25.2 2020: R+18.9 2016: R+17.6 2012: R+8.5 2008: R+6.2
Not yet ingested
- Civics
- —
Market trends
- HPI YoY
- ▼ -38.03%
- Current HPI
- 227.565
- Rent YoY
- —
- Metro
- —
- State GDP YoY
- ▲ 2.66%
- F500 in state
- 28
Industry mix (Fortune 500 HQ in GA)
| Industry | F500 HQs | Revenue |
|---|---|---|
| Paper / Packaging | 2 | $29B |
|
||
| Retail | 1 | $160B |
|
||
| Transportation / Logistics | 1 | $91B |
|
||
| Airlines | 1 | $62B |
|
||
| Consumer Goods | 1 | $47B |
|
||
| Utilities | 1 | $25B |
|
||
Price history
1 event — show timeline
- 2026-06-03 Listed $89,999 GAMLS
Property tax history
+5.2%/yrLatest (2025): $763 · +65.9% YoY. Source: county tax records.
Cash-flow waterfall
monthlySold comps — $/sqft
last 12 mo · ≤1 miLoading sold comps…