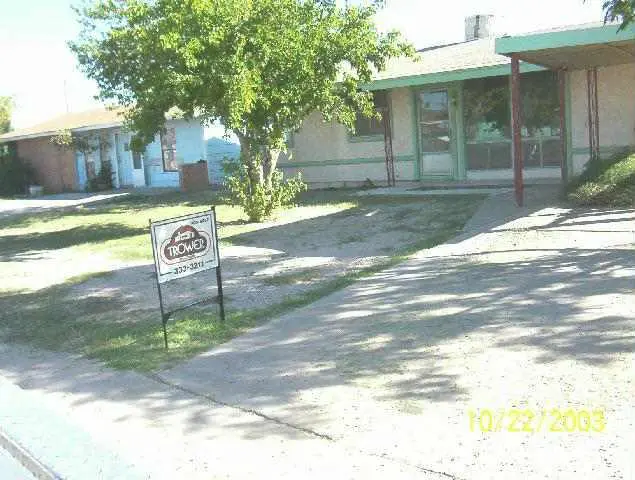
2105 Butternut Ln · Midland, TX
Flood risk 6/10 · Moderate
- FEMA flood zone
- AE
- Chance of flooding over 30 yrs
- 0.7%
- Est. flood insurance / yr
- $1,737 – $8,500
Fire risk 8/10 · Major
- Est. fire insurance / yr
- $1,222 – $2,270
Heat risk 6/10 · Moderate
- Hot days now (above 102°F)
- 7 days/yr
- Hot days in 30 yrs
- 21 days/yr
Wind risk 2/10 · Minimal
- Chance of severe wind over 30 yrs
- 4.0%
Air-quality risk 1/10 · Minimal
- Unhealthy air days now
- 0 days/yr
- Unhealthy air days in 30 yrs
- 0 days/yr
Risk factors via First Street. Map © Google.
Why this score? — see what drove the B- grade
The composite is a weighted blend of 9 inputs, each scored 0–100. Each bar is that input's sub-score; the figure is the points it added to the 100-point composite (weight × sub-score).
- Cash flow +30.0/30.0
- DSCR +10.0/10.0
- 1% rule +9.5/10.0
- ARV discount +7.5/15.0
- Livability +4.0/5.0
- Schools +3.2/10.0
- Rent growth +3.1/5.0
- Condition / age +2.5/5.0
- Appreciation +0.0/10.0
$130,000
🖨 Deal sheet 📄 Offer letter ✓ Due diligence
Listing remarks MLS
GOOD INVESTMENT PROPERTY. MUST HAVE $1,500 ERNEST MONEY WITH CASH OFFERS AND CLOSE AT W TX ABSTR IN MIDLAND. S OF SCHARBAUER DR. AND N OF E. GOLF COURSE RD.
Key facts
- 8,364 sq ft lot
- Built 1954
- Listed 19 days
Neighborhood map
What this means for you Summary
Snapshot
- This is a 2-bed/1.0-bath single-family listed at $130k.
Deal economics
- At list price, monthly cash flow is $138 ($2k/yr) — positive.
- The deal already cash-flows at list — no discount required.
- Meets the 1% rule at list price ($2k rent vs $130k).
- Recommended offer: $128k (1.5% below list) — sets the bar for market timing.
- Cap rate 11.5% vs local median 4.7% in Midland — top-decile yield for the area; either an underpriced asset or a hidden risk that comps aren't pricing in. Stress-test before assuming the spread holds.
Location & tenants
- Location reads 79/100 on livability (#57 in TX, #2,192 nationally) — a middle-class / working-renter tenant base. Strengths: employment A+, housing A+, health & safety A+; Watch: crime C-, commute D+, amenities D.
- Midland ISD (urban): math 34% / reading 36% proficiency, ranked #477 of 826 in TX (top 58%) — families likely to look elsewhere, expect single-tenant / working-renter base with shorter leases.
- Zoned schools: Milam El (math 31% / reading 25%, grade F, #2,740 of 4,322 statewide, top 64%, 442 students, 68% FRL, charter); Abell J H (math 32% / reading 43%, grade F, #736 of 1,662 statewide, top 45%, 1,095 students, 46% FRL); Legacy H S (math 37% / reading 3%, grade F, #1,397 of 1,632 statewide, top 87%, 2,504 students, 41% FRL) — zoned schools at 52% FRL track the district average.
- Market conditions: Rents rising (+2.6%/yr); 452 active listings in the ZIP; 19 comparable units currently listed for rent nearby; rentals at typical pace (median 21d on market — plan ~3-4 weeks tenant-placement turnaround); solid renter incomes; 1,504 units permitted in Midland County in 2024 (0 in 5+ unit buildings).
Forward outlook
- Local home prices are declining (-3.0%/yr); year-one equity from $899 of loan paydown is wiped out by about $4k of value loss. Plan a longer hold.
- Midland County population projected at +83% by 2050 — long-run rental-demand tailwind backs the buy-and-hold thesis.
Negotiation context
- It's been on market 19 days — a 2% lower offer ($128k) is reasonable based on typical stale-listing flexibility.
- 3 sale attempts since 24y ago with the ask held roughly flat each time — persistent listings suggest the price (not the market) is what's stuck; bring a comps-based counter.
Risks & watch-outs
- Watch-outs: flood insurance adds $427/mo; built in 1954 — expect roof / HVAC / electrical / plumbing capex.
- Climate carrying-cost: in FEMA flood zone AE (mandatory federal flood insurance); severe wildfire risk; extreme-heat days projected 7→21/yr by 2055 (HVAC capex compounding) — expect insurance premiums to compound above CPI over the hold.
Questions for the listing agent
- Built in 1954 — when were the roof, HVAC, electrical panel, plumbing, and water heater last replaced?
- What's the actual annual flood-insurance premium (NFIP or private), and is the property in a SFHA with mandatory coverage?
- Is there a deadline driving the sale (1031 exchange, divorce, estate, relocation)? That informs how much negotiation room exists.
- What's the average days-on-market for RENTAL listings here right now (not sales)? A rising rental-DOM trend means longer vacancies and softer asking-rent achievability than the comps imply.
- What's the recent tenant-quality profile in this submarket — average credit score on applications, eviction rate, late-payment / NSF rate, and stable-employment percentage? A property-management company in the area should have these aggregated.
- How much new for-sale + rental construction is in the pipeline within 1–3 miles? Heavy new supply typically softens prices + rents 12–24 months out; constrained supply supports both.
Investment metrics
- 1% rule
- 1.45% ✓
- Cap rate
- 11.50%
- Cash-on-cash
- 18.60%
- DSCR
- 1.83
- GRM
- 5.7
CMA / ARV
No comps found within radius.
Projected returns pro-forma
-3.0% appreciation · 2.56% rent growth · sell at horizon
- IRR
- -9.7%
- Equity multiple
- 0.65×
- Total profit
- $-12,829
- Equity at exit
- $19,383
- IRR
- -0.8%
- Equity multiple
- 0.94×
- Total profit
- $-2,024
- Equity at exit
- $11,240
Cash invested: $36,400 (down + closing). Projections, not guarantees.
Landlord ↔ Tenant lean methodology
- Overall (STATE)
- 87 Strongly Landlord-Friendly
- State Texas
- 87 Strongly Landlord-Friendly · R+5
- County
- — inherits STATE
- City
- — inherits STATE
ZIP-level market 79705
- Rents YoY
- 2.6%
- Active inventory
- 452
- Price-to-rent
- 5.7×
Monthly cashflow live
- Estimated rent
- $1,884 high interval (Pro) →
- Mortgage (P&I)
- −$682
- Tax from tax record
- −$188 /mo · $2,262/yr
- Insurance
- −$54
- Flood insurance flood zone
- −$427 /mo · $5,118/yr
- HOA
- −$0
- Vacancy / Maint / Mgmt
- −$396
- Net cashflow
- $138
Break-even live
UW: 25.0% down · 7.5% · 30yr · 1.5% tax · 5.0% vac · 8.0% maint · 8.0% mgmt
Financing live
Cash to close
- Down payment
- $32,500
- Closing costs
- $3,900
- Reserves months
- —
- Total cash needed
- —
Loan-product check · same deal, 3 products live
Conventional
25% down · 7.5% · 30yr
- Down + closing
- —
- Monthly P&I
- —
- Monthly cashflow
- —
- DSCR
- —
- Eligible?
- —
Personal DTI + credit; lowest rate.
DSCR
20% down · 8.5% · 30yr
- Down + closing
- —
- Monthly P&I
- —
- Monthly cashflow
- —
- DSCR
- —
- Eligible?
- —
No personal income docs; deal must DSCR.
Hard money
10% down · 12.0% · 12mo
- Down + closing
- —
- Monthly P&I
- —
- Monthly cashflow
- —
- DSCR
- —
- Eligible?
- —
Short-term bridge; refi at stabilization.
Rent comps 19 comps
| Address | Beds | Baths | Sqft | Rent | $/sqft | DOM | Units | Dist |
|---|---|---|---|---|---|---|---|---|
| 416 Maple Ave Midland, TX | 3.0 | 2.0 | 1107 | $1,750 | $1.58 | 21d | 1 | 0.53mi |
| 1710 N Weatherford St Midland, TX | 3.0 | 1.0 | 1165 | $1,950 | $1.67 | 21d | 1 | 0.71mi |
| 1320 N Fairgrounds Rd Midland, TX | 2.0 | 2.0 | 1152 | $2,800 | $2.43 | 13d | 1 | 0.77mi |
| 1320 N Fairgrounds Rd #706 Midland, TX | 3.0 | 2.0 | 1360 | $3,500 | $2.57 | 13d | 1 | 0.77mi |
| 3214 Carver St Midland, TX | 3.0 | 2.0 | 1286 | $2,300 | $1.79 | 44d | 1 | 0.83mi |
| 1212 E Wadley Ave Unit 1223 Midland, TX | 2.0 | 2.0 | 932 | $1,138 | $1.22 | 21d | 1 | 0.84mi |
| 930 Edwards St Midland, TX | 3.0 | 2.0 | 1170 | $1,750 | $1.50 | 13d | 1 | 0.97mi |
| 202 E Shandon Ave Midland, TX | 3.0 | 2.0 | 1231 | $2,400 | $1.95 | 21d | 1 | 1.02mi |
| 405 Humble Ave Midland, TX | 2.0 | 1.0 | 876 | $1,250 | $1.43 | 44d | 1 | 1.03mi |
| 407 W Spruce Ave Unit A-1 Midland, TX | 2.0 | 2.0 | 1078 | $1,600 | $1.48 | 21d | 1 | 1.15mi |
| 410 W Pine Ave Unit B Midland, TX | 2.0 | 1.0 | 1140 | $1,850 | $1.62 | 21d | 1 | 1.16mi |
| 3600 Edwards St Midland, TX | 1.0–3.0 | 1.0–2.0 | 980 | $2,164 | $2.21 | 13d | 19 | 1.20mi |
| 2301 N Pecos St Midland, TX | 2.0 | 2.0 | 1082 | $1,612 | $1.49 | 44d | 2 | 1.20mi |
| 2301 N Pecos St Midland, TX | 2.0 | 1.0–2.0 | 1053 | $1,562 | $1.48 | 21d | 3 | 1.20mi |
| 1104 N Carrizo St Midland, TX | 2.0 | 1.0 | 810 | $1,400 | $1.73 | 44d | 1 | 1.35mi |
| 3700 N Edwards St Midland, TX | 1.0–2.0 | 1.0–2.0 | 957 | $1,911 | $2.00 | 13d | 18 | 1.35mi |
| 1102 N Carrizo St Midland, TX | 2.0 | 1.0 | 810 | $1,400 | $1.73 | 44d | 1 | 1.35mi |
| 711 W Dormard Ave Midland, TX | 3.0 | 2.0 | 1427 | $2,150 | $1.51 | 44d | 1 | 1.38mi |
| 1101 N Carrizo St Unit 6 Midland, TX | 2.0 | 1.0 | 915 | $1,500 | $1.64 | 13d | 1 | 1.40mi |
Listing history 19 events
-
2026-04-07status Pending
-
2026-04-01historical Active Under Contract
-
2026-03-19$130,000 Active
-
2025-09-16price $125,000
-
2025-08-28price $130,000
-
2025-07-14price $132,000
-
2025-06-15price $135,000
-
2025-05-27price $140,000
-
2025-05-13price $149,500
-
2025-04-22price $155,000
-
2025-04-04price $160,000
-
2008-10-01soldstatus
-
2008-07-11soldstatus
-
2008-07-10soldstatus
-
2003-11-17soldstatus
-
2003-11-14soldstatus 156-char remark
Show marketing remark (156 chars)
GOOD INVESTMENT PROPERTY. MUST HAVE $1,500 ERNEST MONEY WITH CASH OFFERS AND CLOSE AT W TX ABSTR IN MIDLAND. S OF SCHARBAUER DR. AND N OF E. GOLF COURSE RD.
-
2003-10-23$19,900 156-char remark
Show marketing remark (156 chars)
GOOD INVESTMENT PROPERTY. MUST HAVE $1,500 ERNEST MONEY WITH CASH OFFERS AND CLOSE AT W TX ABSTR IN MIDLAND. S OF SCHARBAUER DR. AND N OF E. GOLF COURSE RD.
-
2002-04-26soldstatus
-
2002-02-09$27,000
ⓘ Source: listings_history table (triggers on properties + properties_extension) + one-shot
backfill from property_details.listing_events for pre-trigger history.
Tax reassessment forecast TX · Resets to sale price
- Current annual tax
- $2,262 · $188/mo
- Projected year-2 tax
- $2,379 · $198/mo
- Expected delta
- +$117/yr (+$10/mo · 5.2%)
ⓘ Screening estimate from a state-policy table — verify with the county assessor before closing.
Climate risk First Street
- Flood 6/10 Major FEMA zone AE · 70% chance over 30 yrs
- Wildfire 8/10 Severe
- Heat 6/10 Major 7 d/yr ≥102°F today · 21 d/yr by 30 yrs out
- Wind 2/10 Low 4% chance of damaging wind over 30 yrs
- Air quality 1/10 Low 0 unhealthy d/yr today · 0 by 30 yrs out
Nearby sold comps map
Loading sold comps map…
Walkable amenities ~0.75 mi
Loading nearby amenities…
Taxation est. · year 1
- Rental income
- $22,609
- − Mortgage interest
- −$7,282
- − Property taxes
- −$2,262
- − Insurance
- −$5,768
- − Repairs & maintenance
- −$1,809
- − Management
- −$1,809
- − Depreciation
- −$3,782
- Taxable loss
- −$102
- Est. tax savings @ 24.0%
- +$24
- After-tax cash flow
- $1,675/yr
For passive investors: Depreciation is non-cash, so a rental often shows a tax loss while cash-flowing — sheltering income. Rental losses are passive: they offset passive income freely, and up to $25,000/yr can offset ordinary (W-2) income if you actively participate and your MAGI is under $100k (phasing out to $0 by $150k); unused losses carry forward. On sale, claimed depreciation is recaptured at up to 25%, and gains may owe capital-gains tax (a 1031 exchange can defer both). Figures are a year-1 estimate at your 24.0% rate — not tax advice; consult a CPA.
Schools (NCES district)
- District
- Midland ISD
- NCES district ID
- 4830570
- Math proficiency
- 34% ▼ -7.00%
- Reading proficiency
- 36% ▬ 0.00%
- Median HH income
- $63,457
- Composite
- 31.63/100
- National rank
- #5938
- State rank
- #477 of 826 in TX
Livability — Midland
- Score
- 79/100
- State rank
- #57
- US rank
- #2192
Category grades
Schools grade is shown separately in the Schools card above.
Census & demographics
- Census place
- Midland, TX
- County
- Midland County · 168,494 people
- City population
- 168,494
- Metro
- Midland, TX
- Population (ZIP)
- 46,653
- Household income
- $105,310
- Rent vs Own
- Severe rent burden
- 1557.0
Population outlook (Midland County) Hauer SSP2
- Today (2025)
- 220,895 people
- By 2030
- 253,667 · +14.8%
- By 2040
- 325,498 · +47.4%
- By 2050
- 404,168 · +83.0%
- By 2075
- 609,802 · +176.1%
- By 2100
- 760,172 · +244.1%
Race, ethnicity, and origin ACS 2023
- Neighborhood character
- Diverse neighborhood (Simpson 0.60)
- Race & ethnicity
- White 46% Hispanic / Latino 43% Two or more races 20% Black 8%
- Hispanic origin (detail)
- Mexican 35%
- Common ancestry
- Slovak 1% Lithuanian 1% Serbian 1%
- Foreign-born
- 10% · Canada, Jamaica
- Languages at home
- 72% English-only · Spanish 24% Arabic 1%
Political lean MEDSL · Midland
- 2024 margin
- Solid R (+60.5) · D 19.3% · R 79.8%
- 2008→2024 swing
- -3.3pp toward R · 2008: -57.3pp · 2024: -60.5pp
- All cycles
- 2024: R+60.5 2020: R+56.6 2016: R+55.2 2012: R+61.5 2008: R+57.3
Not yet ingested
- Civics
- —
Market trends
- HPI YoY
- ▼ -300.44%
- Current HPI
- 207.2904
- Rent YoY
- ▲ 2.56%
- Metro
- Midland, TX
- State GDP YoY
- ▲ 3.95%
- F500 in state
- 110
Industry mix (Fortune 500 HQ in TX)
| Industry | F500 HQs | Revenue |
|---|---|---|
| Energy | 16 | $1,198B |
|
||
| Technology | 5 | $198B |
|
||
| Engineering / Construction | 4 | $72B |
|
||
| Energy Services | 3 | $60B |
|
||
| Utilities | 3 | $41B |
|
||
| Healthcare | 2 | $330B |
|
||
Price history
+381.5% since first listed19 events — show timeline
- 2026-04-07 Pending — PBBOR
- 2026-04-01 Contingent — PBBOR
- 2026-03-19 Listed $130,000 PBBOR
- 2025-09-16 Price Changed $125,000 PBBOR
- 2025-08-28 Price Changed $130,000 PBBOR
- 2025-07-14 Price Changed $132,000 PBBOR
- 2025-06-15 Price Changed $135,000 PBBOR
- 2025-05-27 Price Changed $140,000 PBBOR
- 2025-05-13 Price Changed $149,500 PBBOR
- 2025-04-22 Price Changed $155,000 PBBOR
- 2025-04-04 Price Changed $160,000 PBBOR
- 2008-10-01 Sold (Public Records) — Public Records
- 2008-07-11 Sold (Public Records) — Public Records
- 2008-07-10 Sold (Public Records) — Public Records
- 2003-11-17 Sold (Public Records) — Public Records
- 2003-11-14 Sold (MLS) — ODMLS
- 2003-10-23 Listed $19,900 ODMLS
- 2002-04-26 Sold (MLS) — ODMLS
- 2002-02-09 Listed $27,000 ODMLS
Property tax history
+1.5%/yrLatest (2025): $2,262 · +1.5% YoY. Source: county tax records.
Cash-flow waterfall
monthlySold comps — $/sqft
last 12 mo · ≤1 miLoading sold comps…