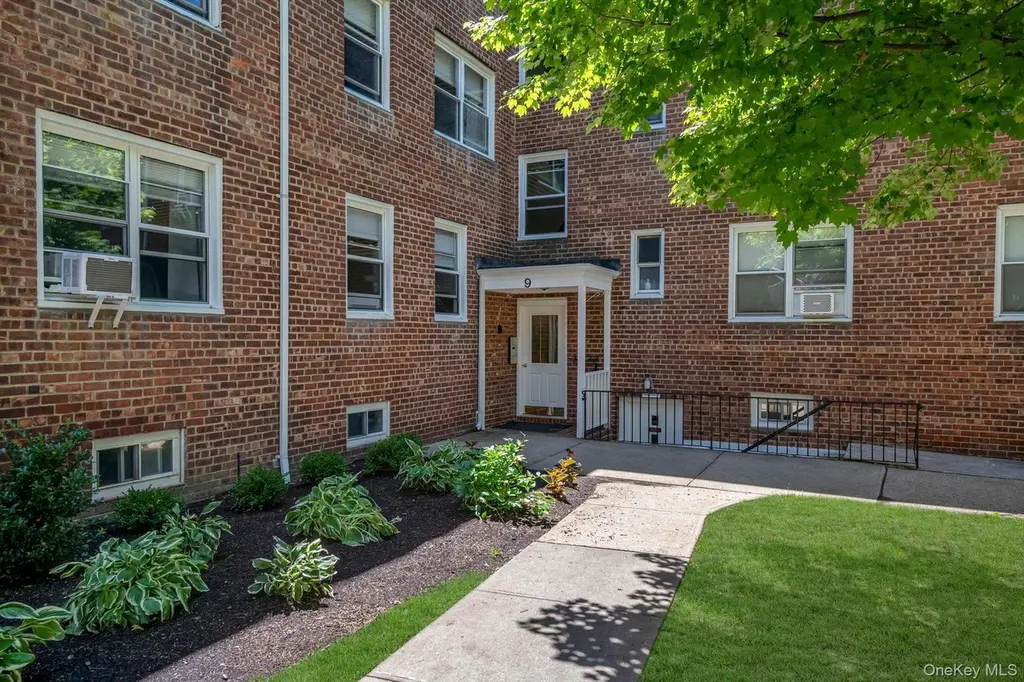
9 Edwards Unit 1-F · Roslyn, NY
Flood risk 1/10 · Minimal
- FEMA flood zone
- X (unshaded)
- Chance of flooding over 30 yrs
- 0.0%
- Est. flood insurance / yr
- $473 – $860
Fire risk 1/10 · Minimal
- Est. fire insurance / yr
- $691 – $1,283
Heat risk 6/10 · Moderate
- Hot days now (above 98°F)
- 7 days/yr
- Hot days in 30 yrs
- 16 days/yr
Wind risk 6/10 · Moderate
- Chance of severe wind over 30 yrs
- 55.0%
Air-quality risk 4/10 · Minor
- Unhealthy air days now
- 4 days/yr
- Unhealthy air days in 30 yrs
- 5 days/yr
Risk factors via First Street. Map © Google.
Why this score? — see what drove the D grade
The composite is a weighted blend of 9 inputs, each scored 0–100. Each bar is that input's sub-score; the figure is the points it added to the 100-point composite (weight × sub-score).
- Cash flow +11.3/30.0
- Schools +7.7/10.0
- ARV discount +7.5/15.0
- Livability +4.2/5.0
- 1% rule +3.3/10.0
- DSCR +3.3/10.0
- Rent growth +2.5/5.0
- Condition / age +2.5/5.0
- Appreciation +0.0/10.0
$315,000
🖨 Deal sheet (PDF) 📄 Offer letter ✓ Due diligence
Listing remarks MLS
Large F Line Updated 1 Bedroom Unit In Roslyn Gardens Granite Kitchen Open Floor Plan Hardwood Floors Convenient To Lirr Shopping And All Major Highways Roslyn Schools
Key facts
- New refrigerator
- First floor
- Updated kitchen
Tags
Property features AI
Exterior
- Parking: Assigned parking; On-street parking available
- Utilities: Public sewer; Cable available; Electricity connected; Natural gas connected; Sewer connected; Private trash collection; Water connected
- Home design: Stock cooperative
- Construction: Brick exterior
- Exterior features: Brick construction; Not waterfront
Interior
- Kitchen: Dishwasher; Oven; Refrigerator
- Bedrooms: 3 total rooms (includes living spaces and bedroom count as reported)
- Bathrooms: 1 full bathroom
- Heating & cooling: Natural gas heating; Wall/window air conditioning units
- Interior features: First-floor bedroom; First-floor full bathroom; Entry level is on the first floor; Cats allowed
Neighborhood map
What this means for you Summary
Snapshot
- This is a 1-bed/1.0-bath condo listed at $315k.
Deal economics
- At list price, monthly cash flow is $-113 ($-1k/yr) — negative.
- To cash-flow at today's rent, offer at most $299k (5.2% below list).
- To meet the 1% rule (rent ≥ 1% of price), the offer needs to be $261k (17.1% below list).
- Recommended offer: $261k (17.1% below list) — sets the bar for 1% rule.
- Cap rate 5.9% vs local median 4.6% in Roslyn — meaningfully above typical; check what's discounted (condition, days-on-market, listing class) to confirm the premium yield is real.
Location & tenants
- Location reads 83/100 on livability (#63 in NY, #910 nationally) — a professional / high-income tenant draw. Strengths: crime A+, commute A+, employment A+; Watch: cost of living F.
- Roslyn Union Free School District (suburban): math 83% / reading 82% proficiency, ranked #28 of 590 in NY (top 5%) — strong family-tenant draw, lease renewals of 3-5y typical; only 8% free/reduced lunch — higher-income household profile.
- Zoned schools: Roslyn Heights Elementary School (345 students, 20% FRL); Roslyn Middle School (math 78% / reading 82%, grade A+, #28 of 729 statewide, top 4%, 766 students, 16% FRL); Roslyn High School (math 97% / reading 87%, grade A+, #171 of 1,100 statewide, top 18%, 1,035 students, 15% FRL).
- Market conditions: 71 active listings in the ZIP; 824 units permitted in Nassau County in 2024 (153 in 5+ unit buildings).
Forward outlook
- Local home prices are declining (-3.0%/yr); year-one equity from $2k of loan paydown is wiped out by about $9k of value loss. Plan a longer hold.
- Nassau County population projected at +7% by 2050 — modest demand growth; plan on rents tracking national, not racing it.
Negotiation context
- Only 4 days on market — expect competitive offers; lowballing is unlikely to land.
- 6 sale attempts since 14y ago with the ask held roughly flat each time — persistent listings suggest the price (not the market) is what's stuck; bring a comps-based counter.
- Current owner paid $141k; list at $315k implies a 123% gain — meaningful room to come down on a strong offer.
Risks & watch-outs
- Watch-outs: built in 1955 — expect roof / HVAC / electrical / plumbing capex.
- Climate carrying-cost: major wind risk, 55% chance of damaging wind over 30y; extreme-heat days projected 7→16/yr by 2055 (HVAC capex compounding) — expect insurance premiums to compound above CPI over the hold.
Questions for the listing agent
- What do current leases actually rent for vs. the listed asking? Can we see a recent rent roll and the last 12 months of T-12 income?
- Built in 1955 — when were the roof, HVAC, electrical panel, plumbing, and water heater last replaced?
- Any open or pending special assessments — roof, HVAC, plumbing, elevator, façade? What's the per-unit balance and payoff schedule, and is the seller paying it off at close or rolling it to the buyer?
- Is there a deadline driving the sale (1031 exchange, divorce, estate, relocation)? That informs how much negotiation room exists.
- The area grade is low — what's the realistic commute time and amenity access for the typical tenant pool here? Any planned neighborhood developments (good or bad) we should know about?
- What's the average days-on-market for RENTAL listings here right now (not sales)? A rising rental-DOM trend means longer vacancies and softer asking-rent achievability than the comps imply.
- What's the recent tenant-quality profile in this submarket — average credit score on applications, eviction rate, late-payment / NSF rate, and stable-employment percentage? A property-management company in the area should have these aggregated.
- How much new apartment / multifamily construction is in the pipeline within 1–3 miles? Heavy new supply (>2% of stock underway) typically softens rents 12–24 months out; light construction supports rent growth.
Investment metrics
- 1% rule
- 0.83% ✗
- Cap rate
- 5.86%
- Cash-on-cash
- -1.53%
- DSCR
- 0.93
- GRM
- 10.0
CMA / ARV
No comps found within radius.
Projected returns pro-forma
-3.0% appreciation · 3.0% rent growth · sell at horizon
- IRR
- -18.8%
- Equity multiple
- 0.34×
- Total profit
- $-58,184
- Equity at exit
- $46,968
- IRR
- -11.3%
- Equity multiple
- 0.32×
- Total profit
- $-59,750
- Equity at exit
- $27,235
Cash invested: $88,200 (down + closing). Projections, not guarantees.
Landlord ↔ Tenant lean methodology
- Overall (STATE)
- 15 Strongly Tenant-Friendly
- State New York
- 15 Strongly Tenant-Friendly · D+10
- County
- — inherits STATE
- City
- — inherits STATE
ZIP-level market 11577
- Home prices YoY
- -28.9%
- Active inventory
- 71
- Price-to-rent
- 10.0×
Monthly cashflow live
- Estimated rent
- $2,613 medium interval (Pro) →
- Mortgage (P&I)
- −$1,652
- Tax est. 1.5%
- −$394 /mo · $4,725/yr
- Insurance
- −$131
- HOA
- −$0
- Vacancy / Maint / Mgmt
- −$549
- Net cashflow
- $-113
Break-even live
Sensitivity live
| Price | -10% $105 | -5% $-4 | +0% $-113 | +5% $-222 | +10% $-330 |
|---|---|---|---|---|---|
| Rent | -10% $-319 | -5% $-216 | +0% $-113 | +5% $-10 | +10% $94 |
| Rate | -1.0pp $46 | -0.5pp $-33 | base $-113 | +0.5pp $-194 | +1.0pp $-277 |
UW: 25.0% down · 7.5% · 30yr · 1.5% tax · 5.0% vac · 8.0% maint · 8.0% mgmt
Financing live
Cash to close
- Down payment
- $78,750
- Closing costs
- $9,450
- Reserves months
- —
- Total cash needed
- —
Loan-product check · same deal, 3 products live
Conventional
25% down · 7.5% · 30yr
- Down + closing
- —
- Monthly P&I
- —
- Monthly cashflow
- —
- DSCR
- —
- Eligible?
- —
Personal DTI + credit; lowest rate.
DSCR
20% down · 8.5% · 30yr
- Down + closing
- —
- Monthly P&I
- —
- Monthly cashflow
- —
- DSCR
- —
- Eligible?
- —
No personal income docs; deal must DSCR.
Hard money
10% down · 12.0% · 12mo
- Down + closing
- —
- Monthly P&I
- —
- Monthly cashflow
- —
- DSCR
- —
- Eligible?
- —
Short-term bridge; refi at stabilization.
HOA detail condo
- Monthly dues
- $0 · $0/yr
- Assessments
- None detected in remarks — confirm with the listing agent.
Listing history 3 events
-
2026-06-21days on market $315,000 Active 4 DOM
-
2026-06-17remarks 677-char remark
-
2026-06-17$315,000 Active 1 DOM
ⓘ Source: listings_history table (triggers on properties + properties_extension) + one-shot
backfill from property_details.listing_events for pre-trigger history.
Climate risk First Street
- Flood 1/10 Low FEMA zone X (unshaded) · 0% chance over 30 yrs
- Wildfire 1/10 Low
- Heat 6/10 Major 7 d/yr ≥98°F today · 16 d/yr by 30 yrs out
- Wind 6/10 Major 55% chance of damaging wind over 30 yrs
- Air quality 4/10 Moderate 4 unhealthy d/yr today · 5 by 30 yrs out
Nearby sold comps map
Loading sold comps map…
Walkable amenities ~0.75 mi
Loading nearby amenities…
Taxation est. · year 1
- Rental income
- $31,354
- − Mortgage interest
- −$17,645
- − Property taxes
- −$4,725
- − Insurance
- −$1,575
- − Repairs & maintenance
- −$2,508
- − Management
- −$2,508
- − Depreciation
- −$9,164
- Taxable loss
- −$6,771
- Est. tax savings @ 24.0%
- +$1,625
- After-tax cash flow
- $272/yr
For passive investors: Depreciation is non-cash, so a rental often shows a tax loss while cash-flowing — sheltering income. Rental losses are passive: they offset passive income freely, and up to $25,000/yr can offset ordinary (W-2) income if you actively participate and your MAGI is under $100k (phasing out to $0 by $150k); unused losses carry forward. On sale, claimed depreciation is recaptured at up to 25%, and gains may owe capital-gains tax (a 1031 exchange can defer both). Figures are a year-1 estimate at your 24.0% rate — not tax advice; consult a CPA.
Schools (NCES district)
- District
- Roslyn Union Free School District
- NCES district ID
- 3625050
- Math proficiency
- 83% ▼ -2.00%
- Reading proficiency
- 82% ▲ 3.00%
- Median HH income
- $128,640
- Composite
- 77.26/100
- National rank
- #101
- State rank
- #28 of 590 in NY
Livability — Roslyn
- Score
- 83/100
- State rank
- #63
- US rank
- #910
Category grades
Schools grade is shown separately in the Schools card above.
Census & demographics
- Census place
- Roslyn, NY
- City population
- 12,796
- Population (ZIP)
- 12,771
Population outlook (Nassau County) Hauer SSP2
- Today (2025)
- 1,409,302 people
- By 2030
- 1,431,482 · +1.6%
- By 2040
- 1,471,607 · +4.4%
- By 2050
- 1,502,845 · +6.6%
- By 2075
- 1,575,403 · +11.8%
- By 2100
- 1,554,356 · +10.3%
Race, ethnicity, and origin ACS 2023
- Neighborhood character
- Majority White (64%)
- Race & ethnicity
- White 64% Asian 22% Hispanic / Latino 10% Two or more races 8% Black 2%
- Hispanic origin (detail)
- Mexican 2% Puerto Rican 1% Cuban 2%
- Common ancestry
- Scotch-Irish 6% Romanian 4% Danish 2%
- Foreign-born
- 25% · China, Canada, South Korea
- Languages at home
- 67% English-only · Other Indo-European 11% Chinese 9% Spanish 8%
Political lean MEDSL · Nassau
- 2024 margin
- Toss-up / Even · D 47.9% · R 52.1%
- 2008→2024 swing
- -12.6pp toward R · 2008: 8.4pp · 2024: -4.2pp
- All cycles
- 2024: R+4.2 2020: D+9.5 2016: D+5.3 2012: D+6.7 2008: D+8.4
Not yet ingested
- Civics
- —
Market trends
- HPI YoY
- ▼ -125.67%
- Current HPI
- 308.3566
- Rent YoY
- —
- Metro
- —
- State GDP YoY
- ▲ 2.60%
- F500 in state
- 92
Industry mix (Fortune 500 HQ in NY)
| Industry | F500 HQs | Revenue |
|---|---|---|
| Financial Services | 10 | $950B |
|
||
| Consumer Goods | 9 | $162B |
|
||
| Insurance | 4 | $225B |
|
||
| Telecommunications | 2 | $144B |
|
||
| Pharmaceuticals | 2 | $112B |
|
||
| Media / Entertainment | 2 | $69B |
|
||
Price history
+98.7% since first listed13 events — show timeline
- 2026-06-17 Listed $315,000 OneKey® MLS as Distributed by MLS Grid
- 2013-08-09 Sold (MLS) $141,000 OneKey® MLS as Distributed by MLS Grid
- 2013-08-09 Sold (MLS) $141,000 MLSLI
- 2013-04-18 Pending — MLSLI
- 2013-03-06 Price Changed $149,000 MLSLI
- 2013-02-05 Listed $155,900 MLSLI
- 2013-02-05 Listed $149,000 OneKey® MLS as Distributed by MLS Grid
- 2012-07-19 Listing Removed — OneKey® MLS as Distributed by MLS Grid
- 2012-06-19 Listed $150,000 OneKey® MLS as Distributed by MLS Grid
- 2012-06-12 Listing Removed — OneKey® MLS as Distributed by MLS Grid
- 2012-04-22 Listed $155,000 OneKey® MLS as Distributed by MLS Grid
- 2012-04-21 Listing Removed — OneKey® MLS as Distributed by MLS Grid
- 2012-01-22 Listed $158,500 OneKey® MLS as Distributed by MLS Grid
Cash-flow waterfall
monthlySold comps — $/sqft
last 12 mo · ≤1 miLoading sold comps…