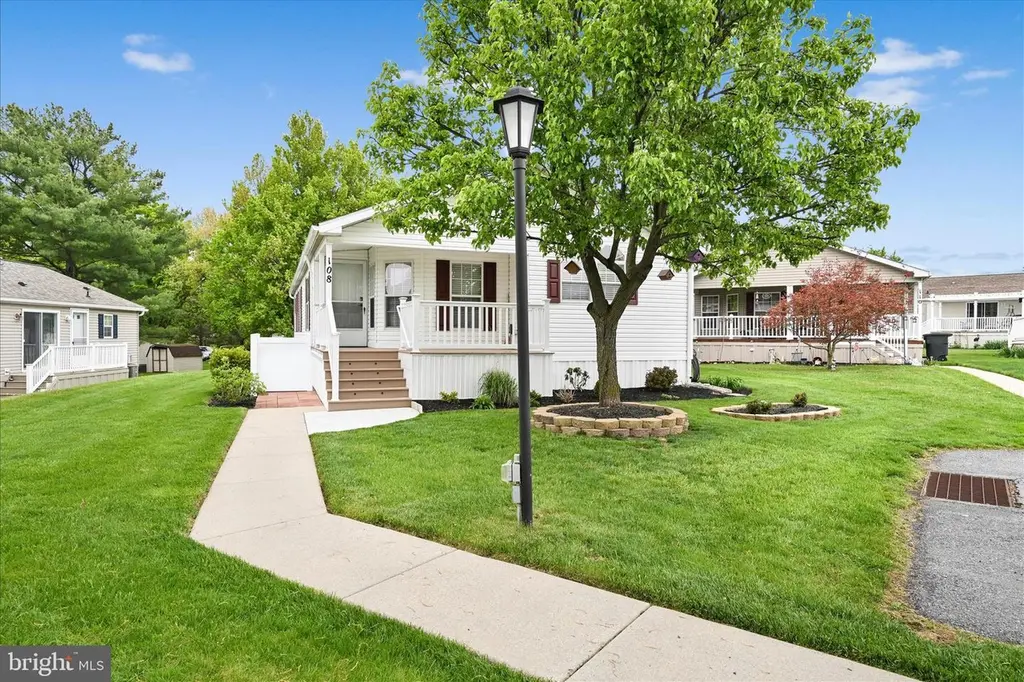
108 Summers Dr · Lancaster, PA
Flood risk 1/10 · Minimal
- FEMA flood zone
- X (unshaded)
- Chance of flooding over 30 yrs
- 0.0%
- Est. flood insurance / yr
- $507 – $1,088
Fire risk 1/10 · Minimal
- Est. fire insurance / yr
- $511 – $949
Heat risk 6/10 · Moderate
- Hot days now (above 101°F)
- 7 days/yr
- Hot days in 30 yrs
- 15 days/yr
Wind risk 4/10 · Minor
- Chance of severe wind over 30 yrs
- 17.0%
Air-quality risk 4/10 · Minor
- Unhealthy air days now
- 5 days/yr
- Unhealthy air days in 30 yrs
- 7 days/yr
Risk factors via First Street. Map © Google.
Why this score? — see what drove the C- grade
The composite is a weighted blend of 9 inputs, each scored 0–100. Each bar is that input's sub-score; the figure is the points it added to the 100-point composite (weight × sub-score).
- Cash flow +24.7/30.0
- DSCR +8.0/10.0
- 1% rule +5.4/10.0
- Schools +4.4/10.0
- Livability +4.2/5.0
- Rent growth +3.5/5.0
- Condition / age +2.5/5.0
- ARV discount +0.0/15.0
- Appreciation +0.0/10.0
$209,900
🖨 Deal sheet (PDF) 📄 Offer letter ✓ Due diligence
Listing remarks
Welcome to 108 Summers Drive! One of the largest models in the community, this beautifully updated 3-bedroom, 2-bath home offers spacious one-floor living with an impressive list of upgrades throughout. From the moment you step inside, the updated LVP flooring and open, functional layout create a warm and inviting feel that makes this home stand out. The fully renovated kitchen is truly the heart of the home, featuring Corian countertops, tile backsplash, a butcher block island, newer appliances, and the perfect setup for both everyday living and entertaining. The spacious primary suite offers a private retreat with a walk-in shower, soaking tub, and excellent storage, creating a comfortabl
Key facts
- Corian countertops
- Soaking tub
- Updated lvp flooring
Tags
Property features AI
Finance
- Other: Property manager present; Not in a federal flood zone; Pets allowed (dogs and cats; number limit applies)
- Financial info: Ground rent: $600 monthly; Ownership interest: Ground rent
- HOA & community: Association fee covers common area maintenance; Community pool
Exterior
- Parking: Assigned parking in a parking lot; 2 total parking/garage spaces (2 assigned, 2 parking lot spaces)
- Utilities: Public water; Public sewer
- Home design: Manufactured/modular home; Vinyl siding; Shingle roof; Located on a cul-de-sac; Property in excellent condition; Ground rent tenancy (monthly ground rent exists)
- Construction: Manufactured structure; Vinyl siding construction; Shingle roof; Year of major remodel/renovation: 2024 (year built estimated)
- Exterior features: Exterior lighting; Extensive hardscape; Outbuilding(s); Deck(s); Screened porch
Interior
- Kitchen: Built-in microwave; Built-in range; Dishwasher; Refrigerator
- Bedrooms: 3 bedrooms on the main level
- Flooring: Luxury vinyl plank
- Bathrooms: 2 full bathrooms on the main level
- Heating & cooling: 90% efficient forced-air heating (natural gas); Central air conditioning (electric); 200+ amp electrical service
- Interior features: Soaking tub; Walk-in shower in bathroom; Ceiling fans; Dining area; Kitchen island; Master bath; Pantry; Upgraded countertops; Drywall walls and ceilings; Not furnished
- Laundry & utility: Washer and dryer on the main floor; Electric hot water
Neighborhood map
What this means for you Summary
Snapshot
- This is a 3-bed/2.0-bath manufactured listed at $210k.
Deal economics
- At list price, monthly cash flow is $438 ($5k/yr) — positive.
- The deal already cash-flows at list — no discount required.
- Meets the 1% rule at list price ($2k rent vs $210k).
- Cap rate 8.8% vs local median 4.2% in Lancaster — top-decile yield for the area; either an underpriced asset or a hidden risk that comps aren't pricing in. Stress-test before assuming the spread holds.
Location & tenants
- Location reads 85/100 on livability (#71 in PA, #498 nationally) — a professional / high-income tenant draw. Strengths: amenities A+, commute A+, cost of living A+; Watch: crime C-, employment C-.
- Conestoga Valley SD (suburban): math 43% / reading 59% proficiency, ranked #156 of 539 in PA (top 29%) — acceptable for families but not a draw, mixed tenant base, ~2y average lease.
- Market conditions: Rents rising (+4.0%/yr); 321 active listings in the ZIP; 5 comparable units currently listed for rent nearby; rentals lingering (median 45d on market — plan ~5-8 weeks vacancy on turnover, expect pricing pressure); 80% of comp listings sitting > 30 days — soft ceiling on asking rent; solid renter incomes; 1,093 units permitted in Lancaster County in 2024 (201 in 5+ unit buildings).
Forward outlook
- Local home prices are declining (-3.0%/yr); year-one equity from $1k of loan paydown is wiped out by about $6k of value loss. Plan a longer hold.
- Lancaster County population projected at +5% by 2050 — modest demand growth; plan on rents tracking national, not racing it.
Negotiation context
- Only 5 days on market — expect competitive offers; lowballing is unlikely to land.
Risks & watch-outs
- Climate carrying-cost: extreme-heat days projected 7→15/yr by 2055 (HVAC capex compounding) — expect insurance premiums to compound above CPI over the hold.
Questions for the listing agent
- Is there a deadline driving the sale (1031 exchange, divorce, estate, relocation)? That informs how much negotiation room exists.
- What's the average days-on-market for RENTAL listings here right now (not sales)? A rising rental-DOM trend means longer vacancies and softer asking-rent achievability than the comps imply.
- What's the recent tenant-quality profile in this submarket — average credit score on applications, eviction rate, late-payment / NSF rate, and stable-employment percentage? A property-management company in the area should have these aggregated.
- How much new for-sale + rental construction is in the pipeline within 1–3 miles? Heavy new supply typically softens prices + rents 12–24 months out; constrained supply supports both.
Investment metrics
- 1% rule
- 1.04% ✓
- Cap rate
- 8.80%
- Cash-on-cash
- 8.94%
- DSCR
- 1.40
- GRM
- 8.0
CMA / ARV
- ARV (median comp)
- $165,425
- List price
- $209,900
- Delta
- 26.88%
- Verdict
- OVERPRICED
- Comps
- 20 within 1.0 mi
Projected returns pro-forma
-3.0% appreciation · 3.99% rent growth · sell at horizon
- IRR
- -1.8%
- Equity multiple
- 0.93×
- Total profit
- $-3,977
- Equity at exit
- $31,297
- IRR
- 8.8%
- Equity multiple
- 1.70×
- Total profit
- $41,424
- Equity at exit
- $18,148
Cash invested: $58,772 (down + closing). Projections, not guarantees.
Landlord ↔ Tenant lean methodology
- Overall (STATE)
- 62 Landlord-Friendly
- State Pennsylvania
- 62 Landlord-Friendly · EVEN
- County
- — inherits STATE
- City
- — inherits STATE
ZIP-level market 17601
- Rents YoY
- 4.0%
- Active inventory
- 321
- Price-to-rent
- 8.0×
Monthly cashflow live
- Estimated rent
- $2,191 high interval (Pro) →
- Mortgage (P&I)
- −$1,101
- Tax from tax record
- −$104 /mo · $1,254/yr
- Insurance
- −$87
- HOA
- −$0
- Vacancy / Maint / Mgmt
- −$460
- Net cashflow
- $438
Break-even live
Sensitivity live
| Price | -10% $557 | -5% $497 | +0% $438 | +5% $379 | +10% $319 |
|---|---|---|---|---|---|
| Rent | -10% $265 | -5% $351 | +0% $438 | +5% $525 | +10% $611 |
| Rate | -1.0pp $544 | -0.5pp $491 | base $438 | +0.5pp $384 | +1.0pp $328 |
UW: 25.0% down · 7.5% · 30yr · 1.5% tax · 5.0% vac · 8.0% maint · 8.0% mgmt
Financing live
Cash to close
- Down payment
- $52,475
- Closing costs
- $6,297
- Reserves months
- —
- Total cash needed
- —
Loan-product check · same deal, 3 products live
Conventional
25% down · 7.5% · 30yr
- Down + closing
- —
- Monthly P&I
- —
- Monthly cashflow
- —
- DSCR
- —
- Eligible?
- —
Personal DTI + credit; lowest rate.
DSCR
20% down · 8.5% · 30yr
- Down + closing
- —
- Monthly P&I
- —
- Monthly cashflow
- —
- DSCR
- —
- Eligible?
- —
No personal income docs; deal must DSCR.
Hard money
10% down · 12.0% · 12mo
- Down + closing
- —
- Monthly P&I
- —
- Monthly cashflow
- —
- DSCR
- —
- Eligible?
- —
Short-term bridge; refi at stabilization.
Rent comps 5 comps
| Address | Beds | Baths | Sqft | Rent | $/sqft | DOM | Units | Dist |
|---|---|---|---|---|---|---|---|---|
| 1522 Princess Anne Dr Lancaster, PA | 4.0 | 2.0 | 1352 | $2,400 | $1.78 | 44d | 1 | 1.33mi |
| 2165 Old Philadelphia Pike Lancaster, PA | 2.0 | 1.5 | 1120 | $1,795 | $1.60 | 44d | 1 | 1.39mi |
| 131 Highview Dr Lancaster, PA | 2.0 | 1.5 | 1120 | $1,795 | $1.60 | 44d | 1 | 1.40mi |
| 2165 Old Philadelphia Pike Unit 30 Lancaster, PA | 2.0 | 1.5 | 1120 | $1,795 | $1.60 | 14d | 1 | 1.41mi |
| 316 Laurel Oak Ln Lancaster, PA | 4.0 | 2.0 | 2234 | $2,750 | $1.23 | 44d | 1 | 1.43mi |
Listing history 2 events
-
2026-05-04status Pending 1654-char remark
-
2026-04-29$209,900 Active 1654-char remark
ⓘ Source: listings_history table (triggers on properties + properties_extension) + one-shot
backfill from property_details.listing_events for pre-trigger history.
Tax reassessment forecast PA · Partial reset (capped growth)
- Current annual tax
- $1,254 · $104/mo
- Projected year-2 tax
- $2,285 · $190/mo
- Expected delta
- +$1,031/yr (+$86/mo · 82.2%)
ⓘ Screening estimate from a state-policy table — verify with the county assessor before closing.
Climate risk First Street
- Flood 1/10 Low FEMA zone X (unshaded) · 0% chance over 30 yrs
- Wildfire 1/10 Low
- Heat 6/10 Major 7 d/yr ≥101°F today · 15 d/yr by 30 yrs out
- Wind 4/10 Moderate 17% chance of damaging wind over 30 yrs
- Air quality 4/10 Moderate 5 unhealthy d/yr today · 7 by 30 yrs out
Nearby sold comps map
Loading sold comps map…
Walkable amenities ~0.75 mi
Loading nearby amenities…
Taxation est. · year 1
- Rental income
- $26,289
- − Mortgage interest
- −$11,758
- − Property taxes
- −$1,254
- − Insurance
- −$1,050
- − Repairs & maintenance
- −$2,103
- − Management
- −$2,103
- − Depreciation
- −$6,106
- Taxable income
- $1,915
- Est. tax owed @ 24.0%
- −$460
- After-tax cash flow
- $4,796/yr
For passive investors: Depreciation is non-cash, so a rental often shows a tax loss while cash-flowing — sheltering income. Rental losses are passive: they offset passive income freely, and up to $25,000/yr can offset ordinary (W-2) income if you actively participate and your MAGI is under $100k (phasing out to $0 by $150k); unused losses carry forward. On sale, claimed depreciation is recaptured at up to 25%, and gains may owe capital-gains tax (a 1031 exchange can defer both). Figures are a year-1 estimate at your 24.0% rate — not tax advice; consult a CPA.
Schools (NCES district)
- District
- Conestoga Valley SD
- NCES district ID
- 4206480
- Math proficiency
- 43% ▼ -8.00%
- Reading proficiency
- 59% ▼ -11.00%
- Median HH income
- $56,234
- Composite
- 44.15/100
- National rank
- #2861
- State rank
- #156 of 539 in PA
Livability — Lancaster
- Score
- 85/100
- State rank
- #71
- US rank
- #498
Category grades
Schools grade is shown separately in the Schools card above.
Census & demographics
- County
- Lancaster County · 390,309 people
- City population
- 176,170
- Metro
- Lancaster, PA
- Population (ZIP)
- 56,382
- Household income
- $102,435
- Rent vs Own
- Severe rent burden
- 1296.0
Population outlook (Lancaster County) Hauer SSP2
- Today (2025)
- 561,011 people
- By 2030
- 570,969 · +1.8%
- By 2040
- 585,929 · +4.4%
- By 2050
- 591,056 · +5.4%
- By 2075
- 594,747 · +6.0%
- By 2100
- 558,850 · -0.4%
Race, ethnicity, and origin ACS 2023
- Neighborhood character
- Predominantly White (78%)
- Race & ethnicity
- White 78% Hispanic / Latino 10% Two or more races 7% Asian 6% Black 4%
- Hispanic origin (detail)
- Puerto Rican 5%
- Common ancestry
- Romanian 5% Slovak 2% Lithuanian 2%
- Foreign-born
- 9% · Canada, Vietnam, China
- Languages at home
- 86% English-only · Spanish 5% Other Indo-European 2% French/Haitian/Cajun 1%
Political lean MEDSL · Lancaster
- 2024 margin
- R (+15.9) · D 41.5% · R 57.5%
- 2008→2024 swing
- -4.1pp toward R · 2008: -11.8pp · 2024: -15.9pp
- All cycles
- 2024: R+15.9 2020: R+15.8 2016: R+19.7 2012: R+19.2 2008: R+11.8
Not yet ingested
- Civics
- —
Market trends
- HPI YoY
- ▼ -383.04%
- Current HPI
- 257.0336
- Rent YoY
- ▲ 3.99%
- Metro
- Lancaster, PA
- State GDP YoY
- ▲ 1.68%
- F500 in state
- 34
Industry mix (Fortune 500 HQ in PA)
| Industry | F500 HQs | Revenue |
|---|---|---|
| Healthcare | 2 | $309B |
|
||
| Insurance | 2 | $27B |
|
||
| Telecommunications / Media | 1 | $124B |
|
||
| Industrial Distribution | 1 | $22B |
|
||
| Financial Services | 1 | $20B |
|
||
| Chemicals / Materials | 1 | $18B |
|
||
Price history
2 events — show timeline
- 2026-05-04 Pending — BRIGHT MLS
- 2026-04-29 Listed $209,900 BRIGHT MLS
Property tax history
-0.7%/yrLatest (2026): $1,254 · +4.5% YoY. Source: county tax records.
Cash-flow waterfall
monthlySold comps — $/sqft
last 12 mo · ≤1 miLoading sold comps…