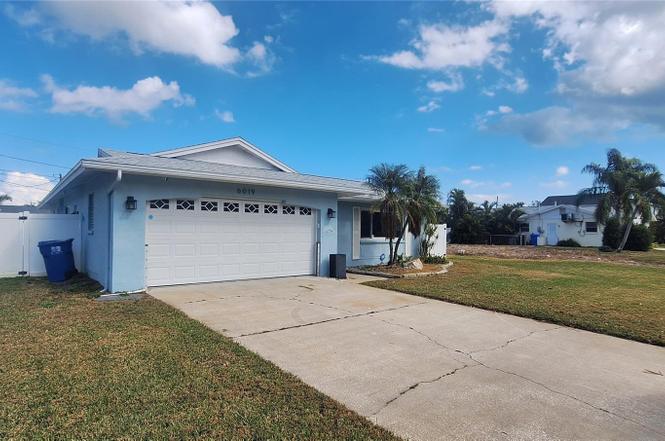
6019 Venetian Blvd NE · St. Petersburg, FL
Flood risk 10/10 · Severe
- FEMA flood zone
- AE
- Chance of flooding over 30 yrs
- 0.99%
- Est. flood insurance / yr
- $1,737 – $8,500
Fire risk 3/10 · Minor
- Est. fire insurance / yr
- $947 – $1,759
Heat risk 10/10 · Severe
- Hot days now (above 106°F)
- 7 days/yr
- Hot days in 30 yrs
- 28 days/yr
Wind risk 10/10 · Severe
- Chance of severe wind over 30 yrs
- 99.0%
Air-quality risk 3/10 · Minor
- Unhealthy air days now
- 2 days/yr
- Unhealthy air days in 30 yrs
- 3 days/yr
Risk factors via First Street. Map © Google.
Why this score? — see what drove the B+ grade
The composite is a weighted blend of 9 inputs, each scored 0–100. Each bar is that input's sub-score; the figure is the points it added to the 100-point composite (weight × sub-score).
- Cash flow +30.0/30.0
- ARV discount +15.0/15.0
- DSCR +10.0/10.0
- 1% rule +9.6/10.0
- Schools +4.3/10.0
- Rent growth +3.1/5.0
- Livability +2.5/5.0
- Condition / age +2.5/5.0
- Appreciation +0.0/10.0
$250,000
🖨 Deal sheet 📄 Offer letter ✓ Due diligence
Listing remarks
Auction Property. Short Sale. Short sale - Auction Property. This property is scheduled for an upcoming auction event. Please see the auction site for current auction dates. Bids MUST be submitted via Auction.com. The house has water damage from Hurricane Helene and has been remediated. Super priced for land value only. Solid Block Construction with a Pool, 3 Bedroom, 2 Bath home with a 2 Car Garage. This home is perfect for rehabbing or tear down and rebuild! Located on a beautiful street in the popular Shore Acres Neighborhood. So close to downtown happenings, shopping, and restaurants. * * * The sale will be subject to a 5% buyer’s premium pursuant to the Auction Terms and Condit
Key facts
- Pool
- 7,292 sq ft lot
- 2 garage spots
Tags
Neighborhood map
What this means for you Summary
Snapshot
- This is a 3-bed/2.0-bath single-family listed at $250k.
Deal economics
- At list price, monthly cash flow is $663 ($8k/yr) — positive.
- The deal already cash-flows at list — no discount required.
- Meets the 1% rule at list price ($4k rent vs $250k).
- Recommended offer: $246k (1.5% below list) — sets the bar for market timing.
- Cap rate 11.5% vs local median 2.6% in St. Petersburg — top-decile yield for the area; either an underpriced asset or a hidden risk that comps aren't pricing in. Stress-test before assuming the spread holds.
Location & tenants
- Location reads: area grade B — affects rentability + tenant quality, not the cash-flow math above.
- Pinellas (suburban): math 51% / reading 51% proficiency, ranked #31 of 73 in FL (top 42%) — acceptable for families but not a draw, mixed tenant base, ~2y average lease.
- Market conditions: Rents rising (+2.2%/yr); 451 active listings in the ZIP; 30 comparable units currently listed for rent nearby; rentals at typical pace (median 14d on market — plan ~3-4 weeks tenant-placement turnaround); solid renter incomes; 2,676 units permitted in Pinellas County in 2024 (1,422 in 5+ unit buildings).
- At $3,662/mo this rent would consume 46% of the median local household income ($95k/yr) (locally 509% of renters already pay >50% of income on rent) — very limited rent-growth headroom before tenants either downsize or default.
Forward outlook
- Local home prices are declining (-3.0%/yr); year-one equity from $2k of loan paydown is wiped out by about $8k of value loss. Plan a longer hold.
- Pinellas County population projected at +14% by 2050 — modest demand growth; plan on rents tracking national, not racing it.
Negotiation context
- It's been on market 17 days — a 2% lower offer ($246k) is reasonable based on typical stale-listing flexibility.
- 8 sale attempts since 20y ago with the ask held roughly flat each time — persistent listings suggest the price (not the market) is what's stuck; bring a comps-based counter.
Risks & watch-outs
- Watch-outs: flood insurance adds $427/mo.
- Climate carrying-cost: in FEMA flood zone AE (mandatory federal flood insurance); severe wind risk, 99% chance of damaging wind over 30y; extreme-heat days projected 7→28/yr by 2055 (HVAC capex compounding) — expect insurance premiums to compound above CPI over the hold.
Questions for the listing agent
- Built in 1968 — when were the roof, HVAC, electrical panel, plumbing, and water heater last replaced?
- What's the actual annual flood-insurance premium (NFIP or private), and is the property in a SFHA with mandatory coverage?
- Is there a deadline driving the sale (1031 exchange, divorce, estate, relocation)? That informs how much negotiation room exists.
- What's the average days-on-market for RENTAL listings here right now (not sales)? A rising rental-DOM trend means longer vacancies and softer asking-rent achievability than the comps imply.
- What's the recent tenant-quality profile in this submarket — average credit score on applications, eviction rate, late-payment / NSF rate, and stable-employment percentage? A property-management company in the area should have these aggregated.
- How much new for-sale + rental construction is in the pipeline within 1–3 miles? Heavy new supply typically softens prices + rents 12–24 months out; constrained supply supports both.
Investment metrics
- 1% rule
- 1.46% ✓
- Cap rate
- 11.52%
- Cash-on-cash
- 18.67%
- DSCR
- 1.83
- GRM
- 5.7
CMA / ARV
- ARV (on-the-fly)
- $306,179
- Comps found
- 12
Show comp detail 12 sales within ~0.75 mi
| Address | Dist | Beds/Ba | Sqft | Sold | Price | $/sf | Match |
|---|---|---|---|---|---|---|---|
| 6001 19th St NE | 0.12mi | 3/2.0 | 1,432 (+4%) | 4mo | $529,000 | $369 | 84 |
| 5523 18th St NE | 0.30mi | 3/2.0 | 1,384 (+1%) | 9mo | $527,000 | $381 | 77 |
| 5428 Denver St NE | 0.32mi | 2/2.0 (-1) | 1,372 (-0%) | 6mo | $261,000 | $190 | 74 |
| 6000 19th St NE | 0.15mi | 3/2.0 | 1,556 (+13%) | 2mo | $525,000 | $337 | 69 |
| 1850 Oregon Ave NE | 0.41mi | 3/2.0 | 1,276 (-7%) | 9mo | $190,000 | $149 | 62 |
| 5730 16th Ln NE | 0.34mi | 3/2.0 | 1,190 (-13%) | 2mo | $462,000 | $388 | 60 |
| 6034 Bayou Grande Blvd NE | 0.04mi | 2/1.0 (-1) | 1,209 (-12%) | 11mo | $270,000 | $223 | 60 |
| 1798 New Hampshire Ave NE | 0.60mi | 4/2.0 (+1) | 1,296 (-6%) | 3mo | $187,000 | $144 | 55 |
| 1834 New Hampshire Ave NE | 0.62mi | 3/2.0 | 1,195 (-13%) | 2mo | $205,000 | $172 | 48 |
| 1875 Mississippi Ave NE | 0.75mi | 3/2.0 | 1,264 (-8%) | 6mo | $162,500 | $129 | 47 |
| 1899 Shore Acres Blvd NE | 0.66mi | 3/2.0 | 1,560 (+14%) | 0mo | $575,000 | $369 | 46 |
| 1878 New Hampshire Ave NE | 0.63mi | 3/1.5 | 1,168 (-15%) | 10mo | $185,000 | $158 | 35 |
Match score weights: distance 35% · size 25% · config 20% · recency 20%. Top-matched comps best support the ARV.
Projected returns pro-forma
-3.0% appreciation · 2.21% rent growth · sell at horizon
- IRR
- -0.3%
- Equity multiple
- 0.99×
- Total profit
- $-828
- Equity at exit
- $37,276
- IRR
- 8.5%
- Equity multiple
- 1.62×
- Total profit
- $43,441
- Equity at exit
- $21,615
Cash invested: $70,000 (down + closing). Projections, not guarantees.
Landlord ↔ Tenant lean methodology
- Overall (STATE)
- 87 Strongly Landlord-Friendly
- State Florida
- 87 Strongly Landlord-Friendly · R+3
- County
- — inherits STATE
- City
- — inherits STATE
ZIP-level market 33703
- Rents YoY
- 2.2%
- Active inventory
- 451
- Price-to-rent
- 5.7×
Monthly cashflow live
- Estimated rent
- $3,662 high interval (Pro) →
- Mortgage (P&I)
- −$1,311
- Tax from tax record
- −$389 /mo · $4,666/yr
- Insurance
- −$104
- Flood insurance flood zone
- −$427 /mo · $5,118/yr
- HOA
- −$0
- Vacancy / Maint / Mgmt
- −$769
- Net cashflow
- $663
Break-even live
UW: 25.0% down · 7.5% · 30yr · 1.5% tax · 5.0% vac · 8.0% maint · 8.0% mgmt
Financing live
Cash to close
- Down payment
- $62,500
- Closing costs
- $7,500
- Reserves months
- —
- Total cash needed
- —
Loan-product check · same deal, 3 products live
Conventional
25% down · 7.5% · 30yr
- Down + closing
- —
- Monthly P&I
- —
- Monthly cashflow
- —
- DSCR
- —
- Eligible?
- —
Personal DTI + credit; lowest rate.
DSCR
20% down · 8.5% · 30yr
- Down + closing
- —
- Monthly P&I
- —
- Monthly cashflow
- —
- DSCR
- —
- Eligible?
- —
No personal income docs; deal must DSCR.
Hard money
10% down · 12.0% · 12mo
- Down + closing
- —
- Monthly P&I
- —
- Monthly cashflow
- —
- DSCR
- —
- Eligible?
- —
Short-term bridge; refi at stabilization.
Rent comps 30 comps
| Address | Beds | Baths | Sqft | Rent | $/sqft | DOM | Units | Dist |
|---|---|---|---|---|---|---|---|---|
| 6060 Denver St NE Saint Petersburg, FL | 3.0 | 2.0 | 1523 | $3,950 | $2.59 | 4d | 1 | 0.06mi |
| 5923 19th St NE Saint Petersburg, FL | 3.0 | 2.0 | 1336 | $3,500 | $2.62 | 4d | 1 | 0.14mi |
| 5840 Tanglewood Dr NE Saint Petersburg, FL | 4.0 | 3.0 | 1680 | $3,150 | $1.88 | 4d | 1 | 0.15mi |
| 6016 18th St NE Saint Petersburg, FL | 4.0 | 2.0 | 1692 | $3,900 | $2.30 | 4d | 1 | 0.20mi |
| 1733 Bayou Grande Blvd NE Saint Petersburg, FL | 2.0 | 1.0 | 1735 | $4,750 | $2.74 | 24d | 1 | 0.24mi |
| 1739 Bayou Grande Blvd NE St Petersburg, FL | 3.0 | 2.0 | 1658 | $5,500 | $3.32 | 4d | 1 | 0.25mi |
| 5510 Bayou Grande Blvd NE Saint Petersburg, FL | 3.0 | 2.0 | 1232 | $2,750 | $2.23 | 16d | 1 | 0.26mi |
| 5541 Bayou Grande Blvd NE Saint Petersburg, FL | 3.0 | 2.0 | 1532 | $5,000 | $3.26 | 4d | 1 | 0.28mi |
| 5541 Bayou Grande Blvd NE Saint Petersburg, FL | 3.0 | 2.0 | 1532 | $5,000 | $3.26 | 2d | 1 | 0.28mi |
| 1640 Cape Hope Ave NE #4 Saint Petersburg, FL | 4.0 | 3.0 | 1610 | $3,400 | $2.11 | 24d | 1 | 0.48mi |
| 1885 Shore Acres Blvd NE Saint Petersburg, FL | 3.0 | 2.0 | 1040 | $2,498 | $2.40 | 14d | 1 | 0.65mi |
| 1867 Michigan Ave NE Saint Petersburg, FL | 2.0 | 1.0 | 1044 | $2,349 | $2.25 | 4d | 1 | 0.79mi |
| 4560 Overlook Dr NE #167 Saint Petersburg, FL | 2.0 | 1.5 | 1015 | $2,050 | $2.02 | 24d | 1 | 1.01mi |
| 4480 Overlook Dr NE #17 Saint Petersburg, FL | 2.0 | 2.0 | 1145 | $2,250 | $1.97 | 20d | 1 | 1.05mi |
| 4227 Helena St NE Saint Petersburg, FL | 2.0 | 1.0 | 1134 | $3,200 | $2.82 | 4d | 1 | 1.13mi |
| 4165 13th Ln NE Saint Petersburg, FL | 2.0 | 2.0 | 1438 | $4,700 | $3.27 | 4d | 1 | 1.18mi |
| 4095 14th St NE Saint Petersburg, FL | 2.0 | 2.0 | 1791 | $3,795 | $2.12 | 4d | 1 | 1.20mi |
| 517 Hampton Ave NE St Petersburg, FL | 3.0 | 2.0 | 896 | $2,950 | $3.29 | 24d | 1 | 1.21mi |
| 5516 Pine Cir NE Saint Petersburg, FL | 3.0 | 1.0 | 1205 | $2,500 | $2.07 | 4d | 1 | 1.27mi |
| 4026 Indianapolis St NE Saint Petersburg, FL | 3.0 | 2.0 | 1364 | $3,200 | $2.35 | 4d | 1 | 1.28mi |
| 525 Moreno Cir NE Saint Petersburg, FL | 3.0 | 2.0 | 1587 | $3,500 | $2.21 | 14d | 1 | 1.28mi |
| 4036 Overlook Dr NE Saint Petersburg, FL | 3.0 | 2.0 | 1412 | $2,645 | $1.87 | 14d | 1 | 1.29mi |
| 4011 Helena St NE St Petersburg, FL | 3.0 | 1.5 | 1005 | $2,500 | $2.49 | 24d | 1 | 1.30mi |
| 617 Segovia Ct NE Saint Petersburg, FL | 2.0 | 2.5 | 1420 | $2,950 | $2.08 | 24d | 1 | 1.32mi |
| 1070 Sanabel Ct NE Saint Petersburg, FL | 3.0 | 3.0 | 1804 | $4,500 | $2.49 | 24d | 1 | 1.35mi |
| 3901 Helena St NE Saint Petersburg, FL | 3.0 | 2.0 | 1195 | $2,590 | $2.17 | 14d | 1 | 1.38mi |
| 4843 Napoli Ct NE Saint Petersburg, FL | 2.0 | 2.5 | 1210 | $3,200 | $2.64 | 4d | 1 | 1.39mi |
| 1524 Arizona Ave NE Saint Petersburg, FL | 3.0 | 2.0 | 1092 | $2,800 | $2.56 | 4d | 1 | 1.42mi |
| 3727 Overlook Dr NE Saint Petersburg, FL | 3.0 | 2.0 | 1124 | $2,750 | $2.45 | 24d | 1 | 1.48mi |
| 4920 Locust St NE St. Petersburg, FL | 2.0 | 2.0 | 1035 | $1,825 | $1.76 | 24d | 1 | 1.48mi |
Listing history 23 events
-
2026-03-06status Pending
-
2026-02-18status Active
-
2026-02-17$250,000 Active
-
2024-07-15soldstatus $550,000
-
2024-06-11historical
-
2024-04-13price $535,000
-
2024-04-03price $550,000
-
2023-12-11$600,000 Active
-
2023-11-29$600,000 Active
-
2015-10-19soldstatus $302,000
-
2015-10-16soldstatus $302,000 Sold
-
2015-08-31historical Contingent - Inspections
-
2015-08-20$299,000 Active
-
2012-04-12soldstatus $135,500
-
2012-04-04soldstatus $135,500
-
2011-09-10$129,900
-
2009-10-10$155,000
-
2006-07-06soldstatus $275,000
-
2006-06-15soldstatus $275,000
-
2006-04-01$274,500
-
1999-04-05soldstatus $113,900
-
1985-05-01soldstatus $79,900
-
1983-04-01soldstatus $64,000
ⓘ Source: listings_history table (triggers on properties + properties_extension) + one-shot
backfill from property_details.listing_events for pre-trigger history.
Tax reassessment forecast FL · Resets to sale price
- Current annual tax
- $4,666 · $389/mo
- Projected year-2 tax
- $4,666 · $389/mo
- Expected delta
- $0/yr ($0/mo · 0.0%)
ⓘ Screening estimate from a state-policy table — verify with the county assessor before closing.
Climate risk First Street
- Flood 10/10 Extreme FEMA zone AE · 99% chance over 30 yrs
- Wildfire 3/10 Moderate
- Heat 10/10 Extreme 7 d/yr ≥106°F today · 28 d/yr by 30 yrs out
- Wind 10/10 Extreme 99% chance of damaging wind over 30 yrs
- Air quality 3/10 Moderate 2 unhealthy d/yr today · 3 by 30 yrs out
Nearby sold comps map
Loading sold comps map…
Walkable amenities ~0.75 mi
Loading nearby amenities…
Taxation est. · year 1
- Rental income
- $43,948
- − Mortgage interest
- −$14,004
- − Property taxes
- −$4,666
- − Insurance
- −$6,368
- − Repairs & maintenance
- −$3,516
- − Management
- −$3,516
- − Depreciation
- −$7,273
- Taxable income
- $4,605
- Est. tax owed @ 24.0%
- −$1,105
- After-tax cash flow
- $6,847/yr
For passive investors: Depreciation is non-cash, so a rental often shows a tax loss while cash-flowing — sheltering income. Rental losses are passive: they offset passive income freely, and up to $25,000/yr can offset ordinary (W-2) income if you actively participate and your MAGI is under $100k (phasing out to $0 by $150k); unused losses carry forward. On sale, claimed depreciation is recaptured at up to 25%, and gains may owe capital-gains tax (a 1031 exchange can defer both). Figures are a year-1 estimate at your 24.0% rate — not tax advice; consult a CPA.
Schools (NCES district)
- District
- Pinellas
- NCES district ID
- 1201560
- Math proficiency
- 51% ▼ -5.00%
- Reading proficiency
- 51% ▼ -3.00%
- Median HH income
- $46,270
- Composite
- 43.27/100
- National rank
- #3046
- State rank
- #31 of 73 in FL
Livability — St. Petersburg
No livability data for this city. (Only ~50 U.S. cities are tracked.)
Census & demographics
- Census place
- St. Petersburg, FL
- County
- Pinellas County · 939,478 people
- City population
- 249,151
- Metro
- Tampa-St. Petersburg-Clearwater, FL
- Population (ZIP)
- 25,264
- Household income
- $95,224
- Rent vs Own
- Severe rent burden
- 509.0
Population outlook (Pinellas County) Hauer SSP2
- Today (2025)
- 1,027,532 people
- By 2030
- 1,063,586 · +3.5%
- By 2040
- 1,125,020 · +9.5%
- By 2050
- 1,168,637 · +13.7%
- By 2075
- 1,265,188 · +23.1%
- By 2100
- 1,260,357 · +22.7%
Race, ethnicity, and origin ACS 2023
- Neighborhood character
- Predominantly White (76%)
- Race & ethnicity
- White 76% Hispanic / Latino 10% Two or more races 10% Black 5% Asian 4%
- Hispanic origin (detail)
- Mexican 1% Puerto Rican 2% Cuban 2%
- Common ancestry
- Lithuanian 4% Romanian 3% Italian 2%
- Foreign-born
- 9% · Canada, Vietnam
- Languages at home
- 87% English-only · Spanish 6% Russian/Polish/Slavic 2% Other Indo-European 1%
Political lean MEDSL · Pinellas
- 2024 margin
- Lean R (+5.2) · D 46.9% · R 52.1%
- 2008→2024 swing
- -13.5pp toward R · 2008: 8.3pp · 2024: -5.2pp
- All cycles
- 2024: R+5.2 2020: D+0.2 2016: R+1.1 2012: D+5.6 2008: D+8.3
Not yet ingested
- Civics
- —
Market trends
- HPI YoY
- ▼ -617.95%
- Current HPI
- 352.2886
- Rent YoY
- ▲ 2.21%
- Metro
- Tampa-St. Petersburg-Clearwater, FL
- State GDP YoY
- ▲ 3.28%
- F500 in state
- 36
Industry mix (Fortune 500 HQ in FL)
| Industry | F500 HQs | Revenue |
|---|---|---|
| Industrial Technology | 2 | $29B |
|
||
| Insurance | 2 | $17B |
|
||
| Retail | 1 | $60B |
|
||
| Technology Distribution | 1 | $58B |
|
||
| Homebuilding | 1 | $35B |
|
||
| Technology Manufacturing | 1 | $35B |
|
||
Price history
+290.6% since first listed23 events — show timeline
- 2026-03-06 Pending — Stellar MLS as Distributed by MLS Grid
- 2026-02-18 Relisted — Stellar MLS as Distributed by MLS Grid
- 2026-02-17 Listed $250,000 Stellar MLS as Distributed by MLS Grid
- 2024-07-15 Sold (Public Records) $550,000 Public Records
- 2024-06-11 Listing Removed — Stellar MLS as Distributed by MLS Grid
- 2024-04-13 Price Changed $535,000 Stellar MLS as Distributed by MLS Grid
- 2024-04-03 Price Changed $550,000 Stellar MLS as Distributed by MLS Grid
- 2023-12-11 Listed $600,000 Stellar MLS as Distributed by MLS Grid
- 2023-11-29 Listed $600,000 Stellar MLS as Distributed by MLS Grid
- 2015-10-19 Sold (Public Records) $302,000 Public Records
- 2015-10-16 Sold (MLS) $302,000 Stellar MLS as Distributed by MLS Grid
- 2015-08-31 Contingent — Stellar MLS as Distributed by MLS Grid
- 2015-08-20 Listed $299,000 Stellar MLS as Distributed by MLS Grid
- 2012-04-12 Sold (Public Records) $135,500 Public Records
- 2012-04-04 Sold (MLS) $135,500 Stellar MLS as Distributed by MLS Grid
- 2011-09-10 Listed $129,900 Stellar MLS as Distributed by MLS Grid
- 2009-10-10 Listed $155,000 Stellar MLS as Distributed by MLS Grid
- 2006-07-06 Sold (Public Records) $275,000 Public Records
- 2006-06-15 Sold (MLS) $275,000 Stellar MLS as Distributed by MLS Grid
- 2006-04-01 Listed $274,500 Stellar MLS as Distributed by MLS Grid
- 1999-04-05 Sold (Public Records) $113,900 Public Records
- 1985-05-01 Sold (Public Records) $79,900 Public Records
- 1983-04-01 Sold (Public Records) $64,000 Public Records
Property tax history
+3.9%/yrLatest (2025): $4,666 · +7.2% YoY. Source: county tax records.
Cash-flow waterfall
monthlySold comps — $/sqft
last 12 mo · ≤1 miLoading sold comps…