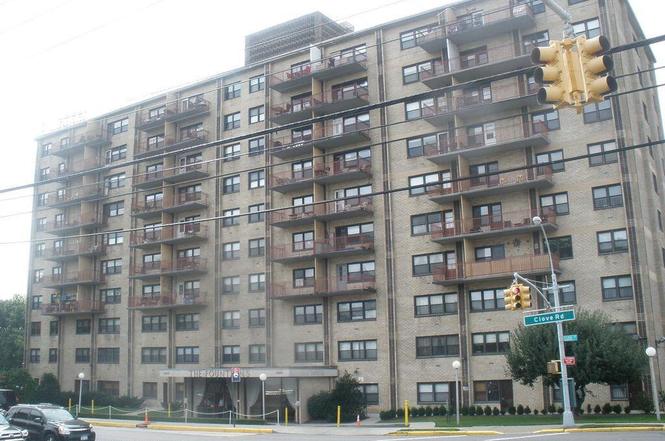
1000 Clove Rd Unit Ld · New York, NY
Flood risk 1/10 · Minimal
- FEMA flood zone
- X (unshaded)
- Chance of flooding over 30 yrs
- 0.0%
- Est. flood insurance / yr
- $507 – $1,088
Fire risk 2/10 · Minimal
- Est. fire insurance / yr
- $691 – $1,283
Heat risk 7/10 · Major
- Hot days now (above 97°F)
- 7 days/yr
- Hot days in 30 yrs
- 15 days/yr
Wind risk 6/10 · Moderate
- Chance of severe wind over 30 yrs
- 62.0%
Air-quality risk 4/10 · Minor
- Unhealthy air days now
- 5 days/yr
- Unhealthy air days in 30 yrs
- 7 days/yr
Risk factors via First Street. Map © Google.
Why this score? — see what drove the F grade
The composite is a weighted blend of 9 inputs, each scored 0–100. Each bar is that input's sub-score; the figure is the points it added to the 100-point composite (weight × sub-score).
- 1% rule +10.0/10.0
- ARV discount +7.5/15.0
- Schools +5.0/10.0
- Rent growth +4.0/5.0
- Livability +3.8/5.0
- Condition / age +2.5/5.0
- Cash flow +1.9/30.0
- DSCR +0.0/10.0
- Appreciation +0.0/10.0
$155,000
🖨 Deal sheet 📄 Offer letter ✓ Due diligence
Listing remarks MLS
14397H-HI-RISE MANHATTAN STYLE LIVING W/CLOVE LAKE AS YOUR BACKYARD AND SILVER LAKE GOLF COURSE AS YOUR FRONT YARD. BROOKLYN & MANHATTAN EXPRESS BUSES RIGHT IN FRONT,24 HOUR DOOR MAN. BEAUTIFUL POOL FOR SUMMER DAYS. ONE MAINTENANCE BILL INCLUDES ALL W/TAX WRITE OFF. Level 1: ENTRY FOYER - SPACIOUS LR/DR COMBO GALLEY KITCHEN Level 2: LARGE BR W/LOTS OF CLOSET SPACE - FULL BATH Basement: HIGH CEILINGS
Key facts
- 24 hour doorperson
- Galley kitchen
- Clove lake park
Tags
Neighborhood map
What this means for you Summary
Snapshot
- This is a 1-bed/1.0-bath condo listed at $155k.
Deal economics
- At list price, monthly cash flow is $-578 ($-7k/yr) — negative.
- The deal already cash-flows at list — no discount required.
- Meets the 1% rule at list price ($2k rent vs $155k).
- Recommended offer: $150k (3.0% below list) — sets the bar for market timing.
- Cap rate 1.8% vs local median 2.6% in New York — below-typical yield; the buyer is paying a premium for something (appreciation thesis, condition, location) that the cap rate doesn't capture.
Location & tenants
- Location reads 75/100 on livability (#268 in NY, #4,188 nationally) — a middle-class / working-renter tenant base. Strengths: amenities A+, commute A+, health & safety A; Watch: crime F, cost of living F.
- Market conditions: Rents rising fast (+6.1%/yr); 263 active listings in the ZIP; 1 comparable units currently listed for rent nearby; solid renter incomes; 480 units permitted in Richmond County in 2024 (22 in 5+ unit buildings).
- This rent runs 33% of the median local income ($86k/yr) — at the standard rent-burdened threshold; future hikes will face affordability resistance.
Forward outlook
- Local home prices are declining (-3.0%/yr); year-one equity from $1k of loan paydown is wiped out by about $5k of value loss. Plan a longer hold.
- Richmond County population projected to shrink 5% by 2050 — rents likely to lag national; underwrite the cash flow, not the appreciation.
Negotiation context
- It's been on market 38 days — a 3% lower offer ($150k) is reasonable based on typical stale-listing flexibility.
- 9 sale attempts since 20y ago with the ask held roughly flat each time — persistent listings suggest the price (not the market) is what's stuck; bring a comps-based counter.
- Current owner paid $101k; list at $155k implies a 53% gain — meaningful room to come down on a strong offer.
Risks & watch-outs
- Watch-outs: HOA is 58% of rent.
- Climate carrying-cost: major wind risk, 62% chance of damaging wind over 30y; extreme-heat days projected 7→15/yr by 2055 (HVAC capex compounding) — expect insurance premiums to compound above CPI over the hold.
Questions for the listing agent
- What do current leases actually rent for vs. the listed asking? Can we see a recent rent roll and the last 12 months of T-12 income?
- It's been on market 38 days. Have you received any prior offers? Is the seller open to a 3% concession, seller financing, or rate buy-down credit?
- Built in 1968 — when were the roof, HVAC, electrical panel, plumbing, and water heater last replaced?
- What does the HOA fee cover, when was the last increase, and are there any pending special assessments or reserve-fund shortfalls?
- Any open or pending special assessments — roof, HVAC, plumbing, elevator, façade? What's the per-unit balance and payoff schedule, and is the seller paying it off at close or rolling it to the buyer?
- Is there a deadline driving the sale (1031 exchange, divorce, estate, relocation)? That informs how much negotiation room exists.
- Schools are B-rated — typically a magnet for longer-tenancy family renters. What's the average tenant stay here, and is there a school-zone premium baked into asking?
- Crime grade is F in this area — have there been break-ins, vandalism, or insurance claims at this property in the last 3 years? What carrier currently insures it and at what premium?
- The area grade is low — what's the realistic commute time and amenity access for the typical tenant pool here? Any planned neighborhood developments (good or bad) we should know about?
- What's the average days-on-market for RENTAL listings here right now (not sales)? A rising rental-DOM trend means longer vacancies and softer asking-rent achievability than the comps imply.
- What's the recent tenant-quality profile in this submarket — average credit score on applications, eviction rate, late-payment / NSF rate, and stable-employment percentage? A property-management company in the area should have these aggregated.
- How much new apartment / multifamily construction is in the pipeline within 1–3 miles? Heavy new supply (>2% of stock underway) typically softens rents 12–24 months out; light construction supports rent growth.
Investment metrics
- 1% rule
- 1.52% ✓
- Cap rate
- 1.82%
- Cash-on-cash
- -15.99%
- DSCR
- 0.29
- GRM
- 5.5
CMA / ARV
No comps found within radius.
Projected returns pro-forma
-3.0% appreciation · 6.07% rent growth · sell at horizon
- IRR
- -36.1%
- Equity multiple
- -0.23×
- Total profit
- $-53,575
- Equity at exit
- $23,111
- IRR
- -18.4%
- Equity multiple
- -0.33×
- Total profit
- $-57,744
- Equity at exit
- $13,402
Cash invested: $43,400 (down + closing). Projections, not guarantees.
Landlord ↔ Tenant lean methodology
- Overall (CITY)
- 0 Strongly Tenant-Friendly
- State New York
- 15 Strongly Tenant-Friendly · D+10
- County
- — inherits STATE
- City New York
- 0 Strongly Tenant-Friendly · D+34
ZIP-level market 10301
- Rents YoY
- 6.1%
- Active inventory
- 263
- Price-to-rent
- 5.5×
Monthly cashflow live
- Estimated rent
- $2,356 medium interval (Pro) →
- Mortgage (P&I)
- −$813
- Tax est. 1.5%
- −$194 /mo · $2,325/yr
- Insurance
- −$65
- HOA est. from 3 same-building comps
- −$1,368
- Vacancy / Maint / Mgmt
- −$495
- Net cashflow
- $-578
Break-even live
UW: 25.0% down · 7.5% · 30yr · 1.5% tax · 5.0% vac · 8.0% maint · 8.0% mgmt
Financing live
Cash to close
- Down payment
- $38,750
- Closing costs
- $4,650
- Reserves months
- —
- Total cash needed
- —
Loan-product check · same deal, 3 products live
Conventional
25% down · 7.5% · 30yr
- Down + closing
- —
- Monthly P&I
- —
- Monthly cashflow
- —
- DSCR
- —
- Eligible?
- —
Personal DTI + credit; lowest rate.
DSCR
20% down · 8.5% · 30yr
- Down + closing
- —
- Monthly P&I
- —
- Monthly cashflow
- —
- DSCR
- —
- Eligible?
- —
No personal income docs; deal must DSCR.
Hard money
10% down · 12.0% · 12mo
- Down + closing
- —
- Monthly P&I
- —
- Monthly cashflow
- —
- DSCR
- —
- Eligible?
- —
Short-term bridge; refi at stabilization.
Rent comps 1 comps
| Address | Beds | Baths | Sqft | Rent | $/sqft | DOM | Units | Dist |
|---|---|---|---|---|---|---|---|---|
| 1288 Forest Ave Unit 1 Staten Island, NY | 1.0 | 1.0 | 600 | $1,950 | $3.25 | 17d | 1 | 1.28mi |
HOA detail condo
- Monthly dues
- $0 · $0/yr
- Likely covers
- pool
- Assessments
- None detected in remarks — confirm with the listing agent.
Listing history 18 events
-
2026-03-27status Pending
-
2026-02-19status Active
-
2026-02-02historical
-
2026-01-31$155,000 Active
-
2016-02-17historical
-
2014-12-17soldstatus $101,000 406-char remark
Show marketing remark (406 chars)
14397H-HI-RISE MANHATTAN STYLE LIVING W/CLOVE LAKE AS YOUR BACKYARD AND SILVER LAKE GOLF COURSE AS YOUR FRONT YARD. BROOKLYN & MANHATTAN EXPRESS BUSES RIGHT IN FRONT,24 HOUR DOOR MAN. BEAUTIFUL POOL FOR SUMMER DAYS. ONE MAINTENANCE BILL INCLUDES ALL W/TAX WRITE OFF. Level 1: ENTRY FOYER - SPACIOUS LR/DR COMBO GALLEY KITCHEN Level 2: LARGE BR W/LOTS OF CLOSET SPACE - FULL BATH Basement: HIGH CEILINGS
-
2014-12-01historical
-
2014-12-01historical
-
2014-11-29historical
-
2014-11-28historical
-
2014-06-03$114,500 406-char remark
Show marketing remark (406 chars)
14397H-HI-RISE MANHATTAN STYLE LIVING W/CLOVE LAKE AS YOUR BACKYARD AND SILVER LAKE GOLF COURSE AS YOUR FRONT YARD. BROOKLYN & MANHATTAN EXPRESS BUSES RIGHT IN FRONT,24 HOUR DOOR MAN. BEAUTIFUL POOL FOR SUMMER DAYS. ONE MAINTENANCE BILL INCLUDES ALL W/TAX WRITE OFF. Level 1: ENTRY FOYER - SPACIOUS LR/DR COMBO GALLEY KITCHEN Level 2: LARGE BR W/LOTS OF CLOSET SPACE - FULL BATH Basement: HIGH CEILINGS
-
2013-05-01$114,900
-
2012-03-12$114,900
-
2011-09-09$134,900
-
2009-01-19$159,900
-
2009-01-16historical
-
2006-11-22$189,900
-
2006-02-25$235,000
ⓘ Source: listings_history table (triggers on properties + properties_extension) + one-shot
backfill from property_details.listing_events for pre-trigger history.
Climate risk First Street
- Flood 1/10 Low FEMA zone X (unshaded) · 0% chance over 30 yrs
- Wildfire 2/10 Low
- Heat 7/10 Severe 7 d/yr ≥97°F today · 15 d/yr by 30 yrs out
- Wind 6/10 Major 62% chance of damaging wind over 30 yrs
- Air quality 4/10 Moderate 5 unhealthy d/yr today · 7 by 30 yrs out
Nearby sold comps map
Loading sold comps map…
Walkable amenities ~0.75 mi
Loading nearby amenities…
Taxation est. · year 1
- Rental income
- $28,266
- − Mortgage interest
- −$8,682
- − Property taxes
- −$2,325
- − Insurance
- −$775
- − Repairs & maintenance
- −$2,261
- − Management
- −$2,261
- − HOA
- −$16,416
- − Depreciation
- −$4,509
- Taxable loss
- −$8,964
- Est. tax savings @ 24.0%
- +$2,151
- After-tax cash flow
- $-4,789/yr
For passive investors: Depreciation is non-cash, so a rental often shows a tax loss while cash-flowing — sheltering income. Rental losses are passive: they offset passive income freely, and up to $25,000/yr can offset ordinary (W-2) income if you actively participate and your MAGI is under $100k (phasing out to $0 by $150k); unused losses carry forward. On sale, claimed depreciation is recaptured at up to 25%, and gains may owe capital-gains tax (a 1031 exchange can defer both). Figures are a year-1 estimate at your 24.0% rate — not tax advice; consult a CPA.
Schools (NCES district)
No district data.
Livability — New York
- Score
- 75/100
- State rank
- #268
- US rank
- #4188
Category grades
Schools grade is shown separately in the Schools card above.
Census & demographics
- Census place
- New York, NY
- County
- Richmond County · 404,174 people
- City population
- 7,731,280
- Metro
- New York-Newark-Jersey City, NY-NJ-PA
- Population (ZIP)
- 41,052
- Household income
- $85,609
- Rent vs Own
- Severe rent burden
- 2008.0
Population outlook (Richmond County) Hauer SSP2
- Today (2025)
- 482,784 people
- By 2030
- 481,831 · -0.2%
- By 2040
- 473,159 · -2.0%
- By 2050
- 457,242 · -5.3%
- By 2075
- 408,029 · -15.5%
- By 2100
- 341,459 · -29.3%
Race, ethnicity, and origin ACS 2023
- Neighborhood character
- Highly diverse neighborhood (Simpson 0.72)
- Race & ethnicity
- White 37% Hispanic / Latino 29% Black 23% Two or more races 16% Asian 7%
- Hispanic origin (detail)
- Mexican 5% Puerto Rican 10% Cuban 2% Dominican 6%
- Common ancestry
- Romanian 3% Scotch-Irish 2% Italian 1%
- Foreign-born
- 22% · Canada, China, Jamaica
- Languages at home
- 68% English-only · Spanish 16% Other Indo-European 5% Russian/Polish/Slavic 3%
Political lean MEDSL · Richmond
- 2024 margin
- Strong R (+29.8) · D 35.1% · R 64.9%
- 2008→2024 swing
- -25.7pp toward R · 2008: -4.0pp · 2024: -29.8pp
- All cycles
- 2024: R+29.8 2020: R+14.9 2016: R+16.8 2012: D+0.8 2008: R+4.0
Not yet ingested
- Civics
- —
Market trends
- HPI YoY
- ▼ -407.37%
- Current HPI
- 319.0616
- Rent YoY
- ▲ 6.07%
- Metro
- New York-Newark-Jersey City, NY-NJ-PA
- State GDP YoY
- ▲ 2.60%
- F500 in state
- 92
Industry mix (Fortune 500 HQ in NY)
| Industry | F500 HQs | Revenue |
|---|---|---|
| Financial Services | 10 | $950B |
|
||
| Consumer Goods | 9 | $162B |
|
||
| Insurance | 4 | $225B |
|
||
| Telecommunications | 2 | $144B |
|
||
| Pharmaceuticals | 2 | $112B |
|
||
| Media / Entertainment | 2 | $69B |
|
||
Price history
-34.0% since first listed18 events — show timeline
- 2026-03-27 Pending — SIBORMLS
- 2026-02-19 Relisted — SIBORMLS
- 2026-02-02 Listing Removed — SIBORMLS
- 2026-01-31 Listed $155,000 SIBORMLS
- 2016-02-17 Listing Removed — SIBORMLS
- 2014-12-17 Sold (MLS) $101,000 SIBORMLS
- 2014-12-01 Listing Removed — SIBORMLS
- 2014-12-01 Listing Removed — SIBORMLS
- 2014-11-29 Listing Removed — SIBORMLS
- 2014-11-28 Listing Removed — SIBORMLS
- 2014-06-03 Listed $114,500 SIBORMLS
- 2013-05-01 Listed $114,900 SIBORMLS
- 2012-03-12 Listed $114,900 SIBORMLS
- 2011-09-09 Listed $134,900 SIBORMLS
- 2009-01-19 Listed $159,900 SIBORMLS
- 2009-01-16 Listing Removed — SIBORMLS
- 2006-11-22 Listed $189,900 SIBORMLS
- 2006-02-25 Listed $235,000 SIBORMLS
Cash-flow waterfall
monthlySold comps — $/sqft
last 12 mo · ≤1 miLoading sold comps…