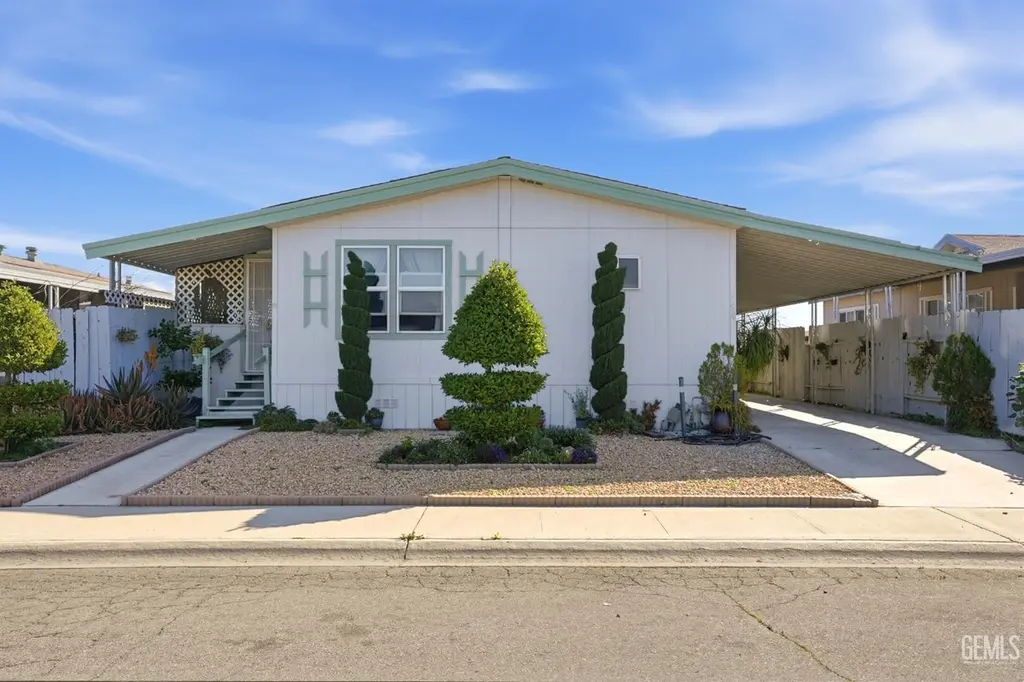
1301 Taft Hwy #154 · Bakersfield, CA
Flood risk 1/10 · Minimal
- FEMA flood zone
- X (unshaded)
- Chance of flooding over 30 yrs
- 0.0%
- Est. flood insurance / yr
- $507 – $1,088
Fire risk 1/10 · Minimal
- Est. fire insurance / yr
- $659 – $1,223
Heat risk 8/10 · Major
- Hot days now (above 104°F)
- 7 days/yr
- Hot days in 30 yrs
- 18 days/yr
Wind risk 1/10 · Minimal
- Chance of severe wind over 30 yrs
- —
Air-quality risk 10/10 · Severe
- Unhealthy air days now
- 33 days/yr
- Unhealthy air days in 30 yrs
- 37 days/yr
Risk factors via First Street. Map © Google.
Why this score? — see what drove the C+ grade
The composite is a weighted blend of 9 inputs, each scored 0–100. Each bar is that input's sub-score; the figure is the points it added to the 100-point composite (weight × sub-score).
- Cash flow +30.0/30.0
- 1% rule +10.0/10.0
- DSCR +10.0/10.0
- Rent growth +3.9/5.0
- Schools +3.4/10.0
- Livability +2.9/5.0
- Condition / age +2.5/5.0
- ARV discount +0.0/15.0
- Appreciation +0.0/10.0
$115,000
🖨 Deal sheet 📄 Offer letter ✓ Due diligence
Listing remarks MLS
Nicely remodeled 3 bed 2 bath split wing manufacture home located in Southland Mobile park a Family community. This home features a new roof, updated kitchen with wood cabinets, stainless steel stove, wood look vinyl flooring, upgraded paint, raised panel doors, remodeled bathrooms and much more. The outside includes a closed in patio decking, New storage shed and a newer roof.
Key facts
- Remodeled
- Vinyl flooring
- Upgraded paint
Tags
Neighborhood map
What this means for you Summary
Snapshot
- This is a 3-bed/2.0-bath manufactured listed at $115k.
Deal economics
- At list price, monthly cash flow is $853 ($10k/yr) — positive.
- The deal already cash-flows at list — no discount required.
- Meets the 1% rule at list price ($2k rent vs $115k).
- Recommended offer: $112k (3.0% below list) — sets the bar for market timing.
- Cap rate 15.2% vs local median 3.6% in Bakersfield — top-decile yield for the area; either an underpriced asset or a hidden risk that comps aren't pricing in. Stress-test before assuming the spread holds.
Location & tenants
- Location reads 58/100 on livability (#716 in CA) — a working-class tenant base; expect higher turnover. Strengths: housing A+; Watch: health & safety D, schools D-, crime F.
- Kern High (urban): math 21% / reading 51% proficiency, ranked #860 of 1,400 in CA (top 61%) — families likely to look elsewhere, expect single-tenant / working-renter base with shorter leases.
- Market conditions: Rents rising fast (+5.7%/yr); 311 active listings in the ZIP; 11 comparable units currently listed for rent nearby; rentals leasing fast (median 11d on market — plan ~1-2 weeks tenant-placement turnaround); 3,244 units permitted in Kern County in 2024 (73 in 5+ unit buildings).
- This rent runs 41% of the median local income ($56k/yr) — at the standard rent-burdened threshold; future hikes will face affordability resistance.
Forward outlook
- Local home prices are declining (-3.0%/yr); year-one equity from $795 of loan paydown is wiped out by about $3k of value loss. Plan a longer hold.
- Kern County population projected at +17% by 2050 — long-run rental-demand tailwind backs the buy-and-hold thesis.
- At projected returns (-3.0% appreciation + 5.7% rent growth), your $32k cash investment doubles in ~4 years — after that, you're playing with house money.
Negotiation context
- It's been on market 31 days — a 3% lower offer ($112k) is reasonable based on typical stale-listing flexibility.
- 4 sale attempts since 12y ago with the ask held roughly flat each time — persistent listings suggest the price (not the market) is what's stuck; bring a comps-based counter.
- Current owner paid $25k; list at $115k implies a 360% gain — meaningful room to come down on a strong offer.
Risks & watch-outs
- Climate carrying-cost: extreme-heat days projected 7→18/yr by 2055 (HVAC capex compounding) — expect insurance premiums to compound above CPI over the hold.
Questions for the listing agent
- It's been on market 31 days. Have you received any prior offers? Is the seller open to a 3% concession, seller financing, or rate buy-down credit?
- Is there a deadline driving the sale (1031 exchange, divorce, estate, relocation)? That informs how much negotiation room exists.
- Schools are D-rated, which usually means shorter tenancies and higher turnover. Who's the typical renter profile here, and what's been the actual vacancy rate?
- Crime grade is F in this area — have there been break-ins, vandalism, or insurance claims at this property in the last 3 years? What carrier currently insures it and at what premium?
- What's the average days-on-market for RENTAL listings here right now (not sales)? A rising rental-DOM trend means longer vacancies and softer asking-rent achievability than the comps imply.
- What's the recent tenant-quality profile in this submarket — average credit score on applications, eviction rate, late-payment / NSF rate, and stable-employment percentage? A property-management company in the area should have these aggregated.
- How much new for-sale + rental construction is in the pipeline within 1–3 miles? Heavy new supply typically softens prices + rents 12–24 months out; constrained supply supports both.
Investment metrics
- 1% rule
- 1.69% ✓
- Cap rate
- 15.20%
- Cash-on-cash
- 31.79%
- DSCR
- 2.41
- GRM
- 4.9
CMA / ARV
- ARV (median comp)
- $91,008
- List price
- $115,000
- Delta
- 26.36%
- Verdict
- OVERPRICED
- Comps
- 20 within 1.0 mi
Show comp detail 8 sales within ~0.75 mi
| Address | Dist | Beds/Ba | Sqft | Sold | Price | $/sf | Match |
|---|---|---|---|---|---|---|---|
| 1301 Taft Hwy #58 | 0.00mi | 3/2.0 | 1,152 (0%) | 9mo | $100,000 | $87 | 93 |
| 1301 Taft Hwy #163 | 0.00mi | 3/1.8 | 1,152 (0%) | 15mo | $60,000 | $52 | 86 |
| 1301 Taft Hwy #31 | 0.00mi | 3/2.0 | 1,120 (-3%) | 14mo | $130,000 | $116 | 84 |
| 1301 Taft #91 | 0.00mi | 3/2.0 | 1,243 (+8%) | 6mo | $75,000 | $60 | 82 |
| 1301 Taft Hwy #50 | 0.00mi | 3/2.0 | 1,056 (-8%) | 7mo | $109,900 | $104 | 80 |
| 1301 Taft Hwy #99 | 0.00mi | 3/2.0 | 1,034 (-10%) | 22mo | $95,900 | $93 | 65 |
| 1301 Taft Hwy #96 | 0.11mi | 3/2.0 | 1,316 (+14%) | 9mo | $99,900 | $76 | 64 |
| 1225 Taft Hwy #19 | 0.20mi | 2/2.0 (-1) | 1,058 (-8%) | 23mo | $65,000 | $61 | 53 |
Match score weights: distance 35% · size 25% · config 20% · recency 20%. Top-matched comps best support the ARV.
Projected returns pro-forma
-3.0% appreciation · 5.71% rent growth · sell at horizon
- IRR
- 29.5%
- Equity multiple
- 2.28×
- Total profit
- $41,096
- Equity at exit
- $17,147
- IRR
- 38.3%
- Equity multiple
- 5.01×
- Total profit
- $129,167
- Equity at exit
- $9,943
Cash invested: $32,200 (down + closing). Projections, not guarantees.
Landlord ↔ Tenant lean methodology
- Overall (STATE)
- 18 Strongly Tenant-Friendly
- State California
- 18 Strongly Tenant-Friendly · D+13
- County
- — inherits STATE
- City
- — inherits STATE
ZIP-level market 93307
- Rents YoY
- 5.7%
- Active inventory
- 311
- Price-to-rent
- 4.9×
Monthly cashflow live
- Estimated rent
- $1,941 high interval (Pro) →
- Mortgage (P&I)
- −$603
- Tax from tax record
- −$29 /mo · $351/yr
- Insurance
- −$48
- HOA
- −$0
- Vacancy / Maint / Mgmt
- −$408
- Net cashflow
- $853
Break-even live
UW: 25.0% down · 7.5% · 30yr · 1.5% tax · 5.0% vac · 8.0% maint · 8.0% mgmt
Financing live
Cash to close
- Down payment
- $28,750
- Closing costs
- $3,450
- Reserves months
- —
- Total cash needed
- —
Loan-product check · same deal, 3 products live
Conventional
25% down · 7.5% · 30yr
- Down + closing
- —
- Monthly P&I
- —
- Monthly cashflow
- —
- DSCR
- —
- Eligible?
- —
Personal DTI + credit; lowest rate.
DSCR
20% down · 8.5% · 30yr
- Down + closing
- —
- Monthly P&I
- —
- Monthly cashflow
- —
- DSCR
- —
- Eligible?
- —
No personal income docs; deal must DSCR.
Hard money
10% down · 12.0% · 12mo
- Down + closing
- —
- Monthly P&I
- —
- Monthly cashflow
- —
- DSCR
- —
- Eligible?
- —
Short-term bridge; refi at stabilization.
Rent comps 11 comps
| Address | Beds | Baths | Sqft | Rent | $/sqft | DOM | Units | Dist |
|---|---|---|---|---|---|---|---|---|
| 1408 Interlaken Dr Bakersfield, CA | 3.0 | 2.0 | 1159 | $2,250 | $1.94 | 21d | 1 | 1.00mi |
| 8914 S Union Ave Bakersfield, CA | 3.0 | 2.0 | 1500 | $1,950 | $1.30 | 2d | 1 | 1.10mi |
| 600 Hosking Ave Unit 75B Bakersfield, CA | 2.0 | 1.5 | 1008 | $1,650 | $1.64 | 21d | 1 | 1.38mi |
| 600 Hosking Ave Unit 47B Bakersfield, CA | 2.0 | 1.5 | 1008 | $1,650 | $1.64 | 10d | 1 | 1.38mi |
| 600 Hosking Ave Unit 56A Bakersfield, CA | 3.0 | 2.0 | 1200 | $1,750 | $1.46 | 2d | 1 | 1.38mi |
| 600 Hosking Ave Unit 51D Bakersfield, CA | 3.0 | 2.0 | 1200 | $1,800 | $1.50 | 3d | 1 | 1.38mi |
| 600 Hosking Ave Unit 73D Bakersfield, CA | 3.0 | 2.0 | 1230 | $1,850 | $1.50 | 43d | 1 | 1.38mi |
| 600 Hosking Ave Unit 43B Bakersfield, CA | 2.0 | 1.5 | 1050 | $1,650 | $1.57 | 43d | 1 | 1.38mi |
| 600 Hosking Ave Apt 69A Bakersfield, CA | 3.0 | 2.0 | 1208 | $1,850 | $1.53 | 19d | 1 | 1.38mi |
| 600 Hosking Ave Unit 47C Bakersfield, CA | 2.0 | 1.5 | 1008 | $1,650 | $1.64 | 2d | 1 | 1.38mi |
| 1305 Quartz Hill Rd Bakersfield, CA | 3.0 | 2.0 | 1351 | $2,250 | $1.67 | 2d | 1 | 1.45mi |
Listing history 23 events
-
2026-06-18days on market $115,000 Active 31 DOM
-
2026-06-17days on market $115,000 Active 30 DOM
-
2026-06-16days on market $115,000 Active 29 DOM
-
2026-06-15days on market $115,000 Active 28 DOM
-
2026-06-14days on market $115,000 Active 26 DOM
-
2026-06-13days on market $115,000 Active 25 DOM
-
2026-06-10days on market $115,000 Active 23 DOM
-
2026-06-09days on market $115,000 Active 22 DOM
-
2026-06-08days on market $115,000 Active 21 DOM
-
2026-06-07days on market $115,000 Active 20 DOM
-
2026-06-05days on market $115,000 Active 17 DOM
-
2026-06-03days on market $115,000 Active 16 DOM
-
2026-06-03days on market $115,000 Active 15 DOM
-
2026-06-01days on market $115,000 Active 14 DOM
-
2026-05-31days on market $115,000 Active 13 DOM
-
2026-05-18$115,000 Active 380-char remark
Show marketing remark (380 chars)
Nicely remodeled 3 bed 2 bath split wing manufacture home located in Southland Mobile park a Family community. This home features a new roof, updated kitchen with wood cabinets, stainless steel stove, wood look vinyl flooring, upgraded paint, raised panel doors, remodeled bathrooms and much more. The outside includes a closed in patio decking, New storage shed and a newer roof.
-
2026-03-14$115,000 Active 413-char remark
Show marketing remark (413 chars)
Nicely remodeled 3 bed 2 bath split wing manufacture home located in Southland Mobile park a Family community. This home features a new roof, updated kitchen with wood cabinets, stainless steel stove, wood look vinyl flooring, upgraded paint, raised panel doors, remodeled bathrooms and much more. The outside includes a closed in patio decking, New storage shed and a newer roof. Space rent is $830.00 per month.
-
2026-03-09historical
-
2026-01-05$115,000 Active
-
2014-05-30soldstatus $25,000
-
2014-05-20price $26,900
-
2014-05-20historical
-
2014-04-29$25,000
ⓘ Source: listings_history table (triggers on properties + properties_extension) + one-shot
backfill from property_details.listing_events for pre-trigger history.
Tax reassessment forecast CA · Resets to sale price
- Current annual tax
- $351 · $29/mo
- Projected year-2 tax
- $874 · $73/mo
- Expected delta
- +$523/yr (+$44/mo · 149.2%)
ⓘ Screening estimate from a state-policy table — verify with the county assessor before closing.
Climate risk First Street
- Flood 1/10 Low FEMA zone X (unshaded) · 0% chance over 30 yrs
- Wildfire 1/10 Low
- Heat 8/10 Severe 7 d/yr ≥104°F today · 18 d/yr by 30 yrs out
- Wind 1/10 Low
- Air quality 10/10 Extreme 33 unhealthy d/yr today · 37 by 30 yrs out
Nearby sold comps map
Loading sold comps map…
Walkable amenities ~0.75 mi
Loading nearby amenities…
Taxation est. · year 1
- Rental income
- $23,291
- − Mortgage interest
- −$6,442
- − Property taxes
- −$351
- − Insurance
- −$575
- − Repairs & maintenance
- −$1,863
- − Management
- −$1,863
- − Depreciation
- −$3,345
- Taxable income
- $8,852
- Est. tax owed @ 24.0%
- −$2,124
- After-tax cash flow
- $8,113/yr
For passive investors: Depreciation is non-cash, so a rental often shows a tax loss while cash-flowing — sheltering income. Rental losses are passive: they offset passive income freely, and up to $25,000/yr can offset ordinary (W-2) income if you actively participate and your MAGI is under $100k (phasing out to $0 by $150k); unused losses carry forward. On sale, claimed depreciation is recaptured at up to 25%, and gains may owe capital-gains tax (a 1031 exchange can defer both). Figures are a year-1 estimate at your 24.0% rate — not tax advice; consult a CPA.
Schools (NCES district)
- District
- Kern High
- NCES district ID
- 0619540
- Math proficiency
- 21% ▬ 0.00%
- Reading proficiency
- 51% ▲ 2.00%
- Median HH income
- $49,686
- Composite
- 33.68/100
- National rank
- #10443
- State rank
- #860 of 1400 in CA
Livability — Bakersfield
- Score
- 58/100
- State rank
- #716
- US rank
- #21355
Category grades
Schools grade is shown separately in the Schools card above.
Census & demographics
- Census place
- Bakersfield, CA
- County
- Kern County · 710,371 people
- City population
- 499,124
- Metro
- Bakersfield, CA
- Population (ZIP)
- 85,945
- Household income
- $56,446
- Rent vs Own
- Severe rent burden
- 3246.0
Population outlook (Kern County) Hauer SSP2
- Today (2025)
- 947,286 people
- By 2030
- 978,984 · +3.3%
- By 2040
- 1,045,018 · +10.3%
- By 2050
- 1,105,232 · +16.7%
- By 2075
- 1,229,538 · +29.8%
- By 2100
- 1,238,059 · +30.7%
Race, ethnicity, and origin ACS 2023
- Neighborhood character
- Predominantly Hispanic (80%)
- Race & ethnicity
- Hispanic / Latino 80% Two or more races 12% White 10% Black 6% Asian 3% Native American 1%
- Hispanic origin (detail)
- Mexican 73%
- Common ancestry
- Lithuanian 0%
- Foreign-born
- 31% · Canada
- Languages at home
- 28% English-only · Spanish 69% Other Indo-European 1% Arabic 1%
Political lean MEDSL · Kern
- 2024 margin
- Strong R (+21.1) · D 38.2% · R 59.3% · Other 2.5%
- 2008→2024 swing
- -3.3pp toward R · 2008: -17.8pp · 2024: -21.1pp
- All cycles
- 2024: R+21.1 2020: R+10.2 2016: R+15.0 2012: R+20.9 2008: R+17.8
Not yet ingested
- Civics
- —
Market trends
- HPI YoY
- ▼ -263.59%
- Current HPI
- 447.1746
- Rent YoY
- ▲ 5.71%
- Metro
- Bakersfield, CA
- State GDP YoY
- ▲ 3.21%
- F500 in state
- 116
Industry mix (Fortune 500 HQ in CA)
| Industry | F500 HQs | Revenue |
|---|---|---|
| Technology | 27 | $1,492B |
|
||
| Financial Services | 3 | $174B |
|
||
| Retail | 3 | $44B |
|
||
| Insurance | 3 | $26B |
|
||
| Media / Entertainment | 2 | $115B |
|
||
| Pharmaceuticals / Biotech | 2 | $62B |
|
||
Price history
+360.0% since first listed8 events — show timeline
- 2026-05-18 Listed $115,000 CRMLS
- 2026-03-14 Listed $115,000 GEMLS
- 2026-03-09 Listing Removed — CRMLS
- 2026-01-05 Listed $115,000 CRMLS
- 2014-05-30 Sold (MLS) $25,000 GEMLS
- 2014-05-20 Delisted — GEMLS
- 2014-05-20 Price Changed $26,900 GEMLS
- 2014-04-29 Listed $25,000 GEMLS
Property tax history
+11.1%/yrLatest (2025): $351 · +4.9% YoY. Source: county tax records.
Cash-flow waterfall
monthlySold comps — $/sqft
last 12 mo · ≤1 miLoading sold comps…