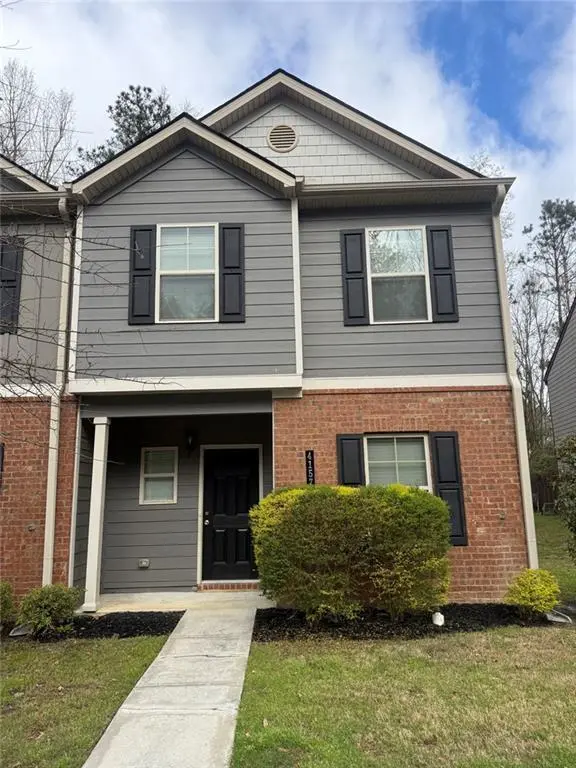
4157 Shoals Ln · South Fulton, GA
Flood risk 1/10 · Minimal
- FEMA flood zone
- X (unshaded)
- Chance of flooding over 30 yrs
- 0.0%
- Est. flood insurance / yr
- $507 – $1,088
Fire risk 3/10 · Minor
- Est. fire insurance / yr
- $963 – $1,789
Heat risk 6/10 · Moderate
- Hot days now (above 104°F)
- 7 days/yr
- Hot days in 30 yrs
- 18 days/yr
Wind risk 6/10 · Moderate
- Chance of severe wind over 30 yrs
- 27.0%
Air-quality risk 4/10 · Minor
- Unhealthy air days now
- 4 days/yr
- Unhealthy air days in 30 yrs
- 6 days/yr
Risk factors via First Street. Map © Google.
Why this score? — see what drove the C- grade
The composite is a weighted blend of 9 inputs, each scored 0–100. Each bar is that input's sub-score; the figure is the points it added to the 100-point composite (weight × sub-score).
- Cash flow +12.6/30.0
- Appreciation +10.0/10.0
- ARV discount +8.1/15.0
- Schools +4.5/10.0
- DSCR +3.8/10.0
- Rent growth +3.1/5.0
- 1% rule +3.0/10.0
- Livability +2.5/5.0
- Condition / age +2.5/5.0
$254,999
🖨 Deal sheet 📄 Offer letter ✓ Due diligence
Listing remarks MLS
Imagine living in this GATED community of Heritage Walk. This End Unit Two-Story Townhome features 4 bdrms and 3 full baths with one of the bedrooms and baths being on the main level. Entertain your heart out with this open concept floor plan featuring wide open foyer, open kitchen with center island facing family area and separate breakfast area. Kitchen features beau tiful espresso cabinets, granite countertops, subway ti le back splash, recessed can lights, stainless microwave, stove, and dishwasher. Luxury Vinyl flooring on en tire first floor. Blinds throughout. Upstairs owners suite with double vanity sinks, separate garden tub and shower with walk in closet. Conveniently located to major interstates, Hartsfield Jackson airport and down town Atlanta.
Key facts
- Gated community
- End unit
- Espresso cabinets
Tags
Neighborhood map
What this means for you Summary
Snapshot
- This is a 3-bed/2.0-bath townhouse listed at $255k.
Deal economics
- At list price, monthly cash flow is $-31 ($-374/yr) — negative.
- To cash-flow at today's rent, offer at most $249k (2.2% below list).
- To meet the 1% rule (rent ≥ 1% of price), the offer needs to be $203k (20.4% below list).
- Recommended offer: $203k (20.4% below list) — sets the bar for 1% rule.
- Cap rate 6.1% vs local median 4.6% in South Fulton — top-decile yield for the area; either an underpriced asset or a hidden risk that comps aren't pricing in. Stress-test before assuming the spread holds.
Location & tenants
- Location reads: area grade C — affects rentability + tenant quality, not the cash-flow math above.
- Fulton County (suburban): math 49% / reading 53% proficiency, ranked #12 of 174 in GA (top 7%) — acceptable for families but not a draw, mixed tenant base, ~2y average lease.
- Market conditions: Rents rising (+2.2%/yr); 167 active listings in the ZIP; 40 comparable units currently listed for rent nearby; rentals at typical pace (median 22d on market — plan ~3-4 weeks tenant-placement turnaround); 11,565 units permitted in Fulton County in 2024 (8,159 in 5+ unit buildings).
- At $2,030/mo this rent would consume 51% of the median local household income ($48k/yr) (locally 1778% of renters already pay >50% of income on rent) — very limited rent-growth headroom before tenants either downsize or default.
Forward outlook
- In year one you build about $27k of equity ($2k loan paydown + $26k appreciation (10.0% local appreciation)).
- Fulton County population projected at +38% by 2050 — long-run rental-demand tailwind backs the buy-and-hold thesis.
- At projected returns (10.0% appreciation + 2.2% rent growth), your $71k cash investment doubles in ~3 years — after that, you're playing with house money.
- By year 2, paydown + projected appreciation supports a ~$44k cash-out refi (75% LTV) — recoverable capital for the next deal without selling this one.
Negotiation context
- It's been on market 96 days — a 9% lower offer ($232k) is reasonable based on typical stale-listing flexibility.
- 2 sale attempts with the ask held roughly flat each time — persistent listings suggest the price (not the market) is what's stuck; bring a comps-based counter.
- Current owner paid $90k; list at $255k implies a 183% gain — meaningful room to come down on a strong offer.
Risks & watch-outs
- Climate carrying-cost: major wind risk, 27% chance of damaging wind over 30y; extreme-heat days projected 7→18/yr by 2055 (HVAC capex compounding) — expect insurance premiums to compound above CPI over the hold.
Questions for the listing agent
- What do current leases actually rent for vs. the listed asking? Can we see a recent rent roll and the last 12 months of T-12 income?
- It's been on market 96 days. Have you received any prior offers? Is the seller open to a 20% concession, seller financing, or rate buy-down credit?
- What does the HOA fee cover, when was the last increase, and are there any pending special assessments or reserve-fund shortfalls?
- Why hasn't it sold? Are there any deal-killer items the seller is aware of (foundation, flood, title, zoning, code violations)?
- Is there a deadline driving the sale (1031 exchange, divorce, estate, relocation)? That informs how much negotiation room exists.
- What's the average days-on-market for RENTAL listings here right now (not sales)? A rising rental-DOM trend means longer vacancies and softer asking-rent achievability than the comps imply.
- What's the recent tenant-quality profile in this submarket — average credit score on applications, eviction rate, late-payment / NSF rate, and stable-employment percentage? A property-management company in the area should have these aggregated.
- How much new for-sale + rental construction is in the pipeline within 1–3 miles? Heavy new supply typically softens prices + rents 12–24 months out; constrained supply supports both.
Investment metrics
- 1% rule
- 0.80% ✗
- Cap rate
- 6.15%
- Cash-on-cash
- -0.52%
- DSCR
- 0.98
- GRM
- 10.5
CMA / ARV
- ARV (median comp)
- $258,432
- List price
- $254,999
- Delta
- -1.33%
- Verdict
- FAIR
- Comps
- 20 within 1.0 mi
Show comp detail 9 sales within ~0.75 mi
| Address | Dist | Beds/Ba | Sqft | Sold | Price | $/sf | Match |
|---|---|---|---|---|---|---|---|
| 4133 Shoals Ln | 0.03mi | 4/3.0 (+1) | 1,821 (0%) | 13mo | $255,000 | $140 | 79 |
| 4193 Shoals Ln | 0.03mi | 4/3.0 (+1) | 1,812 (-0%) | 15mo | $255,000 | $141 | 76 |
| 4169 Shoals Ln | 0.01mi | 4/3.0 (+1) | 1,812 (-0%) | 20mo | $264,433 | $146 | 73 |
| 4143 Shoals Pt | 0.08mi | 3/3.0 | 1,565 (-14%) | 21mo | $260,000 | $166 | 51 |
| 6148 Oakley Rd #23 | 0.55mi | 3/2.5 | 1,600 (-12%) | 4mo | $220,000 | $138 | 49 |
| 6302 Mallory Rdg #2 | 0.47mi | 3/2.5 | 1,580 (-13%) | 8mo | $206,000 | $130 | 47 |
| 6302 Mallory Rdg | 0.47mi | 3/2.5 | 1,580 (-13%) | 8mo | $206,000 | $130 | 47 |
| 5095 Oakley Commons Blvd | 0.55mi | 3/2.5 | 1,550 (-15%) | 16mo | $214,900 | $139 | 34 |
| 6076 Oakley Rd | 0.56mi | 3/2.5 | 1,570 (-14%) | 24mo | $247,000 | $157 | 29 |
Match score weights: distance 35% · size 25% · config 20% · recency 20%. Top-matched comps best support the ARV.
Projected returns pro-forma
10.0% appreciation · 2.2% rent growth · sell at horizon
- IRR
- 23.7%
- Equity multiple
- 2.89×
- Total profit
- $135,227
- Equity at exit
- $229,723
- IRR
- 20.8%
- Equity multiple
- 6.55×
- Total profit
- $396,503
- Equity at exit
- $495,407
Cash invested: $71,400 (down + closing). Projections, not guarantees.
Landlord ↔ Tenant lean methodology
- Overall (STATE)
- 90 Strongly Landlord-Friendly
- State Georgia
- 90 Strongly Landlord-Friendly · R+3
- County
- — inherits STATE
- City
- — inherits STATE
ZIP-level market 30291
- Home prices YoY
- 11.1%
- Rents YoY
- 2.2%
- Active inventory
- 167
- Price-to-rent
- 10.5×
Monthly cashflow live
- Estimated rent
- $2,030 high interval (Pro) →
- Mortgage (P&I)
- −$1,337
- Tax from tax record
- −$177 /mo · $2,128/yr
- Insurance
- −$106
- HOA
- −$14
- Vacancy / Maint / Mgmt
- −$426
- Net cashflow
- $-31
Break-even live
UW: 25.0% down · 7.5% · 30yr · 1.5% tax · 5.0% vac · 8.0% maint · 8.0% mgmt
Financing live
Cash to close
- Down payment
- $63,750
- Closing costs
- $7,650
- Reserves months
- —
- Total cash needed
- —
Loan-product check · same deal, 3 products live
Conventional
25% down · 7.5% · 30yr
- Down + closing
- —
- Monthly P&I
- —
- Monthly cashflow
- —
- DSCR
- —
- Eligible?
- —
Personal DTI + credit; lowest rate.
DSCR
20% down · 8.5% · 30yr
- Down + closing
- —
- Monthly P&I
- —
- Monthly cashflow
- —
- DSCR
- —
- Eligible?
- —
No personal income docs; deal must DSCR.
Hard money
10% down · 12.0% · 12mo
- Down + closing
- —
- Monthly P&I
- —
- Monthly cashflow
- —
- DSCR
- —
- Eligible?
- —
Short-term bridge; refi at stabilization.
Rent comps 40 comps
| Address | Beds | Baths | Sqft | Rent | $/sqft | DOM | Units | Dist |
|---|---|---|---|---|---|---|---|---|
| 4128 Flat Trl Union City, GA | 3.0 | 2.5 | 1450 | $1,700 | $1.17 | 43d | 1 | 0.08mi |
| 3855 Shenfield Dr Union City, GA | 3.0 | 2.5 | 1626 | $1,895 | $1.17 | 43d | 1 | 0.14mi |
| 3859 Shenfield Dr Union City, GA | 4.0 | 2.5 | 1850 | $2,000 | $1.08 | 5d | 1 | 0.15mi |
| 4014 Carisbrook Dr Union City, GA | 4.0 | 2.5 | 1795 | $2,295 | $1.28 | 24d | 1 | 0.19mi |
| 4014 Carisbrook Dr Union City, GA | 4.0 | 2.5 | 1795 | $2,195 | $1.22 | 5d | 1 | 0.19mi |
| 4014 Carisbrook Dr Union City, GA | 4.0 | 2.5 | 1795 | $2,295 | $1.28 | 21d | 1 | 0.19mi |
| 6225 Shenfield Ln Union City, GA | 3.0 | 2.5 | 1821 | $2,000 | $1.10 | 43d | 1 | 0.20mi |
| 3791 Shenfield Dr Union City, GA | 3.0 | 2.5 | 1784 | $2,086 | $1.17 | 10d | 1 | 0.23mi |
| 6150 Mallory Rd Atlanta, GA | 3.0 | 2.0 | 1681 | $1,695 | $1.01 | 11d | 1 | 0.26mi |
| 6596 Woodwell Dr Union City, GA | 3.0 | 2.5 | 1804 | $2,215 | $1.23 | 12d | 1 | 0.28mi |
| 4312 Smithgall Ct Union City, GA | 3.0 | 2.5 | 1433 | $2,000 | $1.40 | 18d | 1 | 0.42mi |
| 6085 Mallory Rdg #32 Union City, GA | 3.0 | 3.5 | 1540 | $2,300 | $1.49 | 43d | 1 | 0.48mi |
| 3285 Oakley Pl Union City, GA | 3.0 | 2.5 | 1350 | $1,500 | $1.11 | 43d | 1 | 0.49mi |
| 6350 Oakley Rd Union City, GA | 3.0 | 2.0–2.5 | 1472 | $1,796 | $1.22 | 1d | 4 | 0.52mi |
| 5150 Oakley Commons Blvd Union City, GA | 3.0 | 2.5 | 1375 | $1,675 | $1.22 | 24d | 1 | 0.54mi |
| 6425 Oakley Rd Union City, GA | 1.0–3.0 | 1.0–2.0 | 1037 | $1,502 | $1.45 | 4d | 18 | 0.57mi |
| 5400 Oakley Commons Blvd Union City, GA | 2.0 | 2.0 | 1258 | $1,257 | $1.00 | 43d | 1 | 0.73mi |
| 4500 Shannon Blvd Unit 7A Union City, GA | 3.0 | 2.5 | 2205 | $1,750 | $0.79 | 24d | 1 | 0.78mi |
| 4500 Shannon Blvd Unit 7 Union City, GA | 3.0 | 2.5 | 1503 | $1,750 | $1.16 | 4d | 1 | 0.78mi |
| 4500 Shannon Blvd Unit 7A Union City, GA | 3.0 | 2.5 | 2205 | $2,000 | $0.91 | 43d | 1 | 0.78mi |
| 4659 Shannon Ct Union City, GA | 3.0 | 2.5 | 2030 | $1,945 | $0.96 | 43d | 1 | 0.92mi |
| 4701 Flat Shoals Rd Union City, GA | 3.0 | 2.5–3.0 | 1600 | $1,775 | $1.11 | 2d | 1 | 1.01mi |
| 4050 Morgan Rd Union City, GA | 1.0–3.0 | 1.0–2.0 | 988 | $1,750 | $1.77 | 5d | 21 | 1.05mi |
| 3550 Morning Creek Dr Atlanta, GA | 4.0 | 2.0 | 1400 | $1,730 | $1.24 | 12d | 1 | 1.12mi |
| 3457 Sumersbe Ct Atlanta, GA | 3.0 | 2.5 | 1800 | $2,300 | $1.28 | 5d | 1 | 1.16mi |
| 5825 Vernier Dr Atlanta, GA | 3.0 | 2.0 | 1346 | $1,615 | $1.20 | 24d | 1 | 1.18mi |
| 5825 Vernier Dr Atlanta, GA | 3.0 | 2.0 | 1346 | $1,615 | $1.20 | 20d | 1 | 1.18mi |
| 5825 Vernier Dr Atlanta, GA | 3.0 | 2.0 | 1346 | $1,615 | $1.20 | 43d | 1 | 1.18mi |
| 5825 Vernier Dr Atlanta, GA | 3.0 | 2.0 | 1346 | $1,615 | $1.20 | 5d | 1 | 1.18mi |
| 5645 Morning Creek Cir Atlanta, GA | 3.0 | 2.0 | 1636 | $1,565 | $0.96 | 43d | 1 | 1.23mi |
| 3695 Morning Creek Dr Atlanta, GA | 3.0 | 2.0 | 1491 | $2,100 | $1.41 | 43d | 1 | 1.25mi |
| 6770 Buffington Rd Union City, GA | 1.0–3.0 | 1.0–2.0 | 950 | $1,699 | $1.79 | 1d | 24 | 1.27mi |
| 5885 Sable Chase Ln Atlanta, GA | 3.0 | 3.5 | 2160 | $2,100 | $0.97 | 20d | 1 | 1.29mi |
| 5612 Feldwood Rd Atlanta, GA | 3.0 | 2.5 | 2100 | $1,895 | $0.90 | 5d | 1 | 1.30mi |
| 420 Buffington Dr Union City, GA | 3.0 | 2.0 | 2118 | $2,050 | $0.97 | 20d | 1 | 1.37mi |
| 3477 Carriage Chase Rd Atlanta, GA | 4.0 | 3.0 | 1545 | $2,000 | $1.29 | 24d | 1 | 1.38mi |
| 3550 Devon Chase Rd Atlanta, GA | 4.0 | 3.0 | 2274 | $2,200 | $0.97 | 24d | 1 | 1.44mi |
| 3650 Creekview Cir Atlanta, GA | 3.0 | 3.5 | 1225 | $1,689 | $1.38 | 12d | 1 | 1.44mi |
| 3524 Devon Chase Rd Atlanta, GA | 3.0 | 2.5 | 1974 | $1,840 | $0.93 | 24d | 1 | 1.46mi |
| 5205 Alexander St Union City, GA | 3.0 | 2.0 | 1326 | $1,681 | $1.27 | 43d | 1 | 1.46mi |
HOA detail
- Monthly dues
- $14 · $168/yr
- Likely covers
- security
Listing history 17 events
-
2026-06-18days on market $254,999 Active 96 DOM
-
2026-06-17days on market $254,999 Active 95 DOM
-
2026-06-16days on market $254,999 Active 94 DOM
-
2026-06-15days on market $254,999 Active 93 DOM
-
2026-06-13days on market $254,999 Active 91 DOM
-
2026-06-09days on market $254,999 Active 87 DOM
-
2026-06-08days on market $254,999 Active 86 DOM
-
2026-06-07days on market $254,999 Active 85 DOM
-
2026-06-04days on market $254,999 Active 82 DOM
-
2026-06-03days on market $254,999 Active 81 DOM
-
2026-06-01days on market $254,999 Active 79 DOM
-
2026-05-31days on market $254,999 Active 78 DOM
-
2026-03-14$254,999 New 766-char remark
Show marketing remark (763 chars)
Imagine living in this GATED community of Heritage Walk. This End Unit Two-Story Townhome features 4 bdrms and 3 full baths with one of the bedrooms and baths being on the main level. Entertain your heart out with this open concept floor plan featuring wide open foyer, open kitchen with center island facing family area and separate breakfast area. Kitchen features beautiful espresso cabinets, granite countertops, subway tile back splash, recessed can lights, stainless microwave, stove, and dishwasher. Luxury Vinyl flooring on entire first floor. Blinds throughout. Upstairs owners suite with double vanity sinks, separate garden tub and shower with walk in closet. Conveniently located to major interstates, Hartsfield Jackson airport and down town Atlanta.
-
2026-03-14$254,999 Active 763-char remark
Show marketing remark (763 chars)
Imagine living in this GATED community of Heritage Walk. This End Unit Two-Story Townhome features 4 bdrms and 3 full baths with one of the bedrooms and baths being on the main level. Entertain your heart out with this open concept floor plan featuring wide open foyer, open kitchen with center island facing family area and separate breakfast area. Kitchen features beautiful espresso cabinets, granite countertops, subway tile back splash, recessed can lights, stainless microwave, stove, and dishwasher. Luxury Vinyl flooring on entire first floor. Blinds throughout. Upstairs owners suite with double vanity sinks, separate garden tub and shower with walk in closet. Conveniently located to major interstates, Hartsfield Jackson airport and down town Atlanta.
-
2019-03-22soldstatus $90,000
-
2011-01-04soldstatus $25,000
-
2010-09-14soldstatus $958,000
ⓘ Source: listings_history table (triggers on properties + properties_extension) + one-shot
backfill from property_details.listing_events for pre-trigger history.
Tax reassessment forecast GA · Resets to sale price
- Current annual tax
- $2,128 · $177/mo
- Projected year-2 tax
- $2,346 · $195/mo
- Expected delta
- +$218/yr (+$18/mo · 10.2%)
ⓘ Screening estimate from a state-policy table — verify with the county assessor before closing.
Climate risk First Street
- Flood 1/10 Low FEMA zone X (unshaded) · 0% chance over 30 yrs
- Wildfire 3/10 Moderate
- Heat 6/10 Major 7 d/yr ≥104°F today · 18 d/yr by 30 yrs out
- Wind 6/10 Major 27% chance of damaging wind over 30 yrs
- Air quality 4/10 Moderate 4 unhealthy d/yr today · 6 by 30 yrs out
Nearby sold comps map
Loading sold comps map…
Walkable amenities ~0.75 mi
Loading nearby amenities…
Taxation est. · year 1
- Rental income
- $24,360
- − Mortgage interest
- −$14,284
- − Property taxes
- −$2,128
- − Insurance
- −$1,275
- − Repairs & maintenance
- −$1,949
- − Management
- −$1,949
- − HOA
- −$168
- − Depreciation
- −$7,418
- Taxable loss
- −$4,811
- Est. tax savings @ 24.0%
- +$1,155
- After-tax cash flow
- $781/yr
For passive investors: Depreciation is non-cash, so a rental often shows a tax loss while cash-flowing — sheltering income. Rental losses are passive: they offset passive income freely, and up to $25,000/yr can offset ordinary (W-2) income if you actively participate and your MAGI is under $100k (phasing out to $0 by $150k); unused losses carry forward. On sale, claimed depreciation is recaptured at up to 25%, and gains may owe capital-gains tax (a 1031 exchange can defer both). Figures are a year-1 estimate at your 24.0% rate — not tax advice; consult a CPA.
Schools (NCES district)
- District
- Fulton County
- NCES district ID
- 1302280
- Math proficiency
- 49% ▼ -2.00%
- Reading proficiency
- 53% ▬ 0.00%
- Median HH income
- $68,035
- Composite
- 45.33/100
- National rank
- #2640
- State rank
- #12 of 174 in GA
Livability — South Fulton
No livability data for this city. (Only ~50 U.S. cities are tracked.)
Census & demographics
- Census place
- South Fulton, GA
- County
- Fulton County · 1,094,430 people
- City population
- 127,674
- Metro
- Atlanta-Sandy Springs-Alpharetta, GA
- Population (ZIP)
- 25,130
- Household income
- $48,184
- Rent vs Own
- Severe rent burden
- 1778.0
Population outlook (Fulton County) Hauer SSP2
- Today (2025)
- 1,203,707 people
- By 2030
- 1,299,706 · +8.0%
- By 2040
- 1,488,256 · +23.6%
- By 2050
- 1,664,580 · +38.3%
- By 2075
- 2,036,072 · +69.2%
- By 2100
- 2,222,402 · +84.6%
Race, ethnicity, and origin ACS 2023
- Neighborhood character
- Predominantly Black (86%)
- Race & ethnicity
- Black 86% Hispanic / Latino 7% Two or more races 6% White 3%
- Hispanic origin (detail)
- Mexican 4%
- Common ancestry
- Italian 1%
- Foreign-born
- 5% · Canada
- Languages at home
- 92% English-only · Spanish 6%
Political lean MEDSL · Fulton
- 2024 margin
- Solid D (+44.9) · D 71.9% · R 27.0% · Other 1.1%
- 2008→2024 swing
- +9.8pp toward D · 2008: 35.0pp · 2024: 44.9pp
- All cycles
- 2024: D+44.9 2020: D+46.4 2016: D+42.1 2012: D+29.6 2008: D+35.0
Not yet ingested
- Civics
- —
Market trends
- HPI YoY
- ▲ 23.98%
- Current HPI
- 239.3471
- Rent YoY
- ▲ 2.20%
- Metro
- Atlanta-Sandy Springs-Alpharetta, GA
- State GDP YoY
- ▲ 2.66%
- F500 in state
- 28
Industry mix (Fortune 500 HQ in GA)
| Industry | F500 HQs | Revenue |
|---|---|---|
| Paper / Packaging | 2 | $29B |
|
||
| Retail | 1 | $160B |
|
||
| Transportation / Logistics | 1 | $91B |
|
||
| Airlines | 1 | $62B |
|
||
| Consumer Goods | 1 | $47B |
|
||
| Utilities | 1 | $25B |
|
||
Price history
-73.4% since first listed5 events — show timeline
- 2026-03-14 Listed $254,999 FMLS
- 2026-03-14 Listed $254,999 GAMLS
- 2019-03-22 Sold (Public Records) $90,000 Public Records
- 2011-01-04 Sold (Public Records) $25,000 Public Records
- 2010-09-14 Sold (Public Records) $958,000 Public Records
Property tax history
+11.9%/yrLatest (2025): $2,128 · +4.1% YoY. Source: county tax records.
Cash-flow waterfall
monthlySold comps — $/sqft
last 12 mo · ≤1 miLoading sold comps…