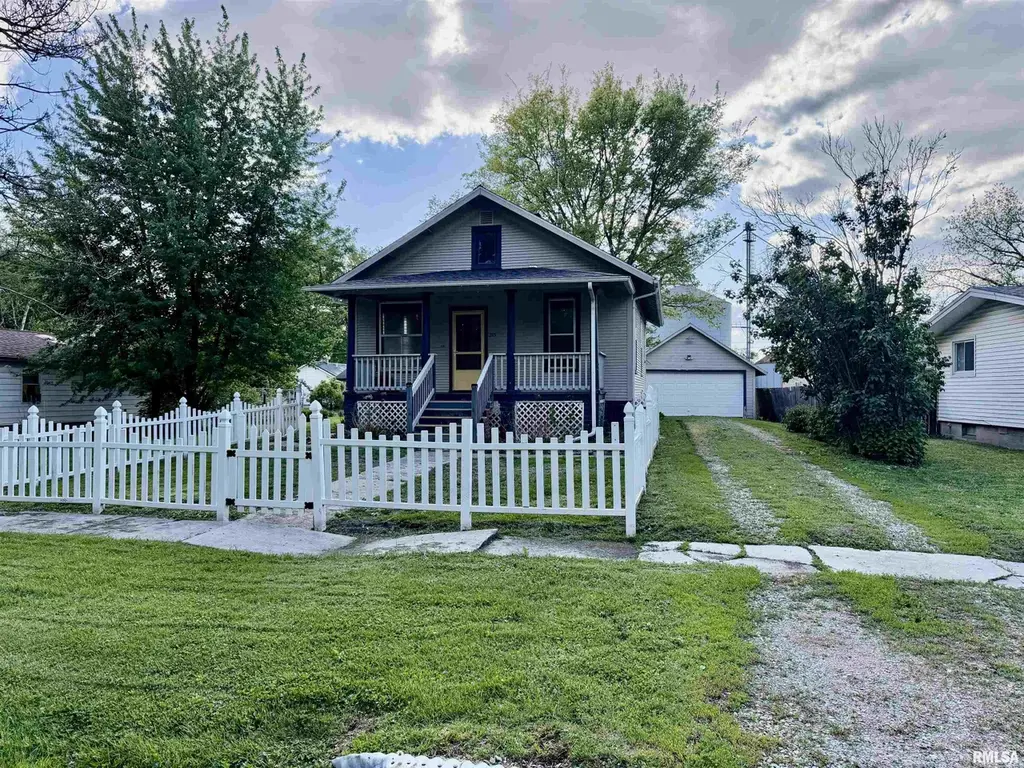
215 S Fulton St · Avon, IL
Flood risk 1/10 · Minimal
- FEMA flood zone
- X (unshaded)
- Chance of flooding over 30 yrs
- 0.0%
- Est. flood insurance / yr
- $473 – $860
Fire risk 1/10 · Minimal
- Est. fire insurance / yr
- $804 – $1,492
Heat risk 3/10 · Minor
- Hot days now (above 105°F)
- 7 days/yr
- Hot days in 30 yrs
- 18 days/yr
Wind risk 2/10 · Minimal
- Chance of severe wind over 30 yrs
- —
Air-quality risk 2/10 · Minimal
- Unhealthy air days now
- 1 days/yr
- Unhealthy air days in 30 yrs
- 1 days/yr
Risk factors via First Street. Map © Google.
Why this score? — see what drove the B grade
The composite is a weighted blend of 9 inputs, each scored 0–100. Each bar is that input's sub-score; the figure is the points it added to the 100-point composite (weight × sub-score).
- Cash flow +27.6/30.0
- DSCR +9.7/10.0
- 1% rule +7.8/10.0
- ARV discount +7.5/15.0
- Appreciation +6.3/10.0
- Schools +5.0/10.0
- Livability +2.8/5.0
- Rent growth +2.5/5.0
- Condition / age +2.5/5.0
$65,000
🖨 Deal sheet 📄 Offer letter ✓ Due diligence
Listing remarks
Charming, adorable, and full of curb appeal, this delightful home is sure to capture your heart! From the inviting large front porch to the classic white picket fence, the exterior offers a warm and welcoming first impression. Step inside to find beautiful new hardwood floors flowing through the dining room, bedroom, and living room, creating a fresh and stylish feel throughout. The spacious bathroom provides plenty of room to unwind, while the fully applianced kitchen is ready for everyday living or entertaining. A full basement offers abundant storage space and added functionality. Whether you're searching for your first home, downsizing, or looking for an investment opportunity, this cha
Key facts
- 0.28 acre lot
- 2 garage spots
- Built 1920
Property features AI
Exterior
- Parking: Detached 2-car garage
- Utilities: Public water; Public sewer
- Home design: Single-family residence; Built in 1920
- Construction: Shingle roof; Full basement
- Exterior features: Level lot; Paved road access
Interior
- Kitchen: Microwave; Refrigerator
- Bedrooms: 1 bedroom (main level) — bedroom measures approximately 11.7' x 10.3' with an egress window
- Flooring: Hardwood flooring in living, dining, and bedroom; Vinyl flooring in kitchen
- Bathrooms: 1 full bathroom
- Heating & cooling: Forced air heat; Central air conditioning
- Interior features: Cable available; Ceiling fan(s); High-speed internet
Neighborhood map
What this means for you Summary
Snapshot
- This is a 1-bed/1.0-bath other listed at $65k.
Deal economics
- At list price, monthly cash flow is $195 ($2k/yr) — positive.
- The deal already cash-flows at list — no discount required.
- Meets the 1% rule at list price ($831 rent vs $65k).
- Recommended offer: $64k (1.5% below list) — sets the bar for market timing.
Location & tenants
- Location reads 56/100 on livability (#1,220 in IL) — a working-class tenant base; expect higher turnover. Strengths: cost of living A+, housing A; Watch: crime F, amenities F, commute F.
- Zoned schools: Abingdon-Avon High Sch (math 8% / reading 22%, grade F, #473 of 693 statewide, top 69%, 285 students, 0% FRL).
- Market conditions: 9 active listings in the ZIP; 14 units permitted in Fulton County in 2024 (0 in 5+ unit buildings).
Forward outlook
- In year one you build about $2k of equity ($449 loan paydown + $2k appreciation (2.6% local appreciation)).
- Fulton County population projected at -20% by 2050 — secular population decline; favor cash flow + early exit over multi-decade hold.
- At projected returns (2.6% appreciation + 3.0% rent growth), your $18k cash investment doubles in ~4 years — after that, you're playing with house money.
Negotiation context
- It's been on market 23 days — a 2% lower offer ($64k) is reasonable based on typical stale-listing flexibility.
- 2 sale attempts with the ask held roughly flat each time — persistent listings suggest the price (not the market) is what's stuck; bring a comps-based counter.
Risks & watch-outs
- Watch-outs: built in 1920 — expect roof / HVAC / electrical / plumbing capex.
Questions for the listing agent
- Built in 1920 — when were the roof, HVAC, electrical panel, plumbing, and water heater last replaced?
- Is there a deadline driving the sale (1031 exchange, divorce, estate, relocation)? That informs how much negotiation room exists.
- Schools are F-rated, which usually means shorter tenancies and higher turnover. Who's the typical renter profile here, and what's been the actual vacancy rate?
- Crime grade is F in this area — have there been break-ins, vandalism, or insurance claims at this property in the last 3 years? What carrier currently insures it and at what premium?
- What's the average days-on-market for RENTAL listings here right now (not sales)? A rising rental-DOM trend means longer vacancies and softer asking-rent achievability than the comps imply.
- What's the recent tenant-quality profile in this submarket — average credit score on applications, eviction rate, late-payment / NSF rate, and stable-employment percentage? A property-management company in the area should have these aggregated.
- How much new for-sale + rental construction is in the pipeline within 1–3 miles? Heavy new supply typically softens prices + rents 12–24 months out; constrained supply supports both.
Investment metrics
- 1% rule
- 1.28% ✓
- Cap rate
- 9.89%
- Cash-on-cash
- 12.84%
- DSCR
- 1.57
- GRM
- 6.5
CMA / ARV
No comps found within radius.
Projected returns pro-forma
2.61% appreciation · 3.0% rent growth · sell at horizon
- IRR
- 18.6%
- Equity multiple
- 2.04×
- Total profit
- $18,904
- Equity at exit
- $27,795
- IRR
- 20.3%
- Equity multiple
- 3.84×
- Total profit
- $51,657
- Equity at exit
- $41,753
Cash invested: $18,200 (down + closing). Projections, not guarantees.
Landlord ↔ Tenant lean methodology
- Overall (STATE)
- 43 Moderately Tenant-Leaning
- State Illinois
- 43 Moderately Tenant-Leaning · D+7
- County
- — inherits STATE
- City
- — inherits STATE
ZIP-level market 61415
- Home prices YoY
- 1.7%
- Active inventory
- 9
- Price-to-rent
- 6.5×
Monthly cashflow live
- Estimated rent
- $831 medium interval (Pro) →
- Mortgage (P&I)
- −$341
- Tax from tax record
- −$94 /mo · $1,127/yr
- Insurance
- −$27
- HOA
- −$0
- Vacancy / Maint / Mgmt
- −$175
- Net cashflow
- $195
Break-even live
UW: 25.0% down · 7.5% · 30yr · 1.5% tax · 5.0% vac · 8.0% maint · 8.0% mgmt
Financing live
Cash to close
- Down payment
- $16,250
- Closing costs
- $1,950
- Reserves months
- —
- Total cash needed
- —
Loan-product check · same deal, 3 products live
Conventional
25% down · 7.5% · 30yr
- Down + closing
- —
- Monthly P&I
- —
- Monthly cashflow
- —
- DSCR
- —
- Eligible?
- —
Personal DTI + credit; lowest rate.
DSCR
20% down · 8.5% · 30yr
- Down + closing
- —
- Monthly P&I
- —
- Monthly cashflow
- —
- DSCR
- —
- Eligible?
- —
No personal income docs; deal must DSCR.
Hard money
10% down · 12.0% · 12mo
- Down + closing
- —
- Monthly P&I
- —
- Monthly cashflow
- —
- DSCR
- —
- Eligible?
- —
Short-term bridge; refi at stabilization.
Listing history 8 events
-
2026-06-18days on market $65,000 Active 23 DOM
-
2026-06-17days on market $65,000 Active 22 DOM
-
2026-06-16days on market $65,000 Active 21 DOM
-
2026-06-15days on market $65,000 Active 20 DOM
-
2026-06-13days on market $65,000 Active 18 DOM
-
2026-06-12statusdays on market $65,000 Active 17 DOM
-
2026-05-16status Pending 745-char remark
-
2026-04-30$65,000 Active 745-char remark
ⓘ Source: listings_history table (triggers on properties + properties_extension) + one-shot
backfill from property_details.listing_events for pre-trigger history.
Tax reassessment forecast IL · Partial reset (capped growth)
- Current annual tax
- $1,127 · $94/mo
- Projected year-2 tax
- $1,301 · $108/mo
- Expected delta
- +$174/yr (+$15/mo · 15.5%)
ⓘ Screening estimate from a state-policy table — verify with the county assessor before closing.
Climate risk First Street
- Flood 1/10 Low FEMA zone X (unshaded) · 0% chance over 30 yrs
- Wildfire 1/10 Low
- Heat 3/10 Moderate 7 d/yr ≥105°F today · 18 d/yr by 30 yrs out
- Wind 2/10 Low
- Air quality 2/10 Low 1 unhealthy d/yr today · 1 by 30 yrs out
Nearby sold comps map
Loading sold comps map…
Walkable amenities ~0.75 mi
Loading nearby amenities…
Taxation est. · year 1
- Rental income
- $9,972
- − Mortgage interest
- −$3,641
- − Property taxes
- −$1,127
- − Insurance
- −$325
- − Repairs & maintenance
- −$798
- − Management
- −$798
- − Depreciation
- −$1,891
- Taxable income
- $1,393
- Est. tax owed @ 24.0%
- −$334
- After-tax cash flow
- $2,002/yr
For passive investors: Depreciation is non-cash, so a rental often shows a tax loss while cash-flowing — sheltering income. Rental losses are passive: they offset passive income freely, and up to $25,000/yr can offset ordinary (W-2) income if you actively participate and your MAGI is under $100k (phasing out to $0 by $150k); unused losses carry forward. On sale, claimed depreciation is recaptured at up to 25%, and gains may owe capital-gains tax (a 1031 exchange can defer both). Figures are a year-1 estimate at your 24.0% rate — not tax advice; consult a CPA.
Schools (NCES district)
No district data.
Livability — Avon
- Score
- 56/100
- State rank
- #1220
- US rank
- #22942
Category grades
Schools grade is shown separately in the Schools card above.
Census & demographics
- Census place
- Avon, IL
- Population (ZIP)
- 1,646
Population outlook (Fulton County) Hauer SSP2
- Today (2025)
- 33,356 people
- By 2030
- 32,144 · -3.6%
- By 2040
- 29,518 · -11.5%
- By 2050
- 26,775 · -19.7%
- By 2075
- 19,972 · -40.1%
- By 2100
- 13,580 · -59.3%
Race, ethnicity, and origin ACS 2023
- Neighborhood character
- Predominantly White (97%)
- Race & ethnicity
- White 97% Two or more races 2% Hispanic / Latino 2%
- Common ancestry
- Slovak 2% Italian 1% Iranian 1%
- Foreign-born
- 0% · Canada
- Languages at home
- 92% English-only · German/W. Germanic 6% Spanish 2%
Political lean MEDSL · Fulton
- 2024 margin
- Strong R (+23.8) · D 37.1% · R 60.9% · Other 2.0%
- 2008→2024 swing
- -45.2pp toward R · 2008: 21.3pp · 2024: -23.8pp
- All cycles
- 2024: R+23.8 2020: R+20.1 2016: R+15.1 2012: D+11.1 2008: D+21.3
Not yet ingested
- Civics
- —
Market trends
- HPI YoY
- ▲ 2.61%
- Current HPI
- 157.7923
- Rent YoY
- —
- Metro
- —
- State GDP YoY
- ▲ 1.59%
- F500 in state
- 60
Industry mix (Fortune 500 HQ in IL)
| Industry | F500 HQs | Revenue |
|---|---|---|
| Insurance | 4 | $201B |
|
||
| Consumer Goods | 4 | $87B |
|
||
| Industrial Machinery | 3 | $64B |
|
||
| Healthcare | 2 | $55B |
|
||
| Retail / Pharmacy | 1 | $148B |
|
||
| Agriculture / Food | 1 | $86B |
|
||
Price history
3 events — show timeline
- 2026-06-10 Relisted — RMLSA as Distributed by MLS Grid
- 2026-05-16 Pending — RMLSA as Distributed by MLS Grid
- 2026-04-30 Listed $65,000 RMLSA as Distributed by MLS Grid
Property tax history
+7.7%/yrLatest (2024): $1,127 · +3.0% YoY. Source: county tax records.
Cash-flow waterfall
monthlySold comps — $/sqft
last 12 mo · ≤1 miLoading sold comps…