1084 Dry Creek RD · Magee, MS
Flood risk No data
- FEMA flood zone
- —
- Chance of flooding over 30 yrs
- —
- Est. flood insurance / yr
- —
Fire risk No data
- Est. fire insurance / yr
- —
Heat risk No data
- Hot days now (above threshold)
- —
- Hot days in 30 yrs
- —
Wind risk No data
- Chance of severe wind over 30 yrs
- —
Air-quality risk No data
- Unhealthy air days now
- —
- Unhealthy air days in 30 yrs
- —
Risk factors via First Street. Map © Google.
Why this score? — see what drove the C grade
The composite is a weighted blend of 9 inputs, each scored 0–100. Each bar is that input's sub-score; the figure is the points it added to the 100-point composite (weight × sub-score).
- Cash flow +20.8/30.0
- ARV discount +7.5/15.0
- DSCR +6.6/10.0
- Appreciation +6.5/10.0
- 1% rule +5.5/10.0
- Condition / age +3.8/5.0
- Livability +3.2/5.0
- Rent growth +2.5/5.0
- Schools +1.7/10.0
$79,999
🖨 Deal sheet 📄 Offer letter ✓ Due diligence
Listing remarks
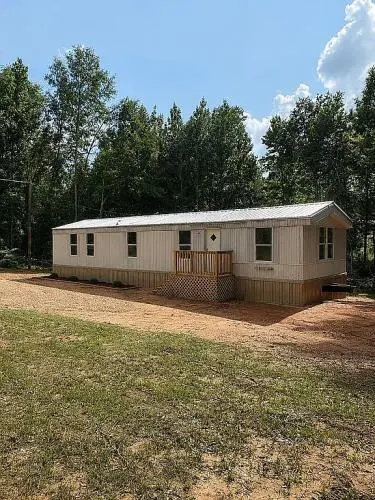
Updated 1999 single-wide mobile home situated on roughly 1 acre of land. This 16x56 home offers 900 square feet of living space with 2 beds and 2 full baths. It offers a quiet country living with plenty of yard space and room to enjoy outdoor living, while also having the convenience of being less than 10 minutes from the Heart of Magee. This is a great opportunity for affordable homeownership or an investment property. To schedule a tour please contact 601-572-1167 or 601-317-1214
Key facts
- Plenty of yard space
- 1 acre of land
- Outdoor living
Tags
Neighborhood map
What this means for you Summary
Snapshot
- This is a 2-bed/2.0-bath manufactured listed at $80k. Condition is rated good.
Deal economics
- At list price, monthly cash flow is $110 ($1k/yr) — positive.
- The deal already cash-flows at list — no discount required.
- Meets the 1% rule at list price ($839 rent vs $80k).
- Recommended offer: $79k (1.5% below list) — sets the bar for market timing.
- Cap rate 7.9% vs local median 3.6% in Magee — top-decile yield for the area; either an underpriced asset or a hidden risk that comps aren't pricing in. Stress-test before assuming the spread holds.
Location & tenants
- Location reads 63/100 on livability (#158 in MS) — a middle-class / working-renter tenant base. Strengths: cost of living A+; Watch: schools F, crime F, amenities F.
- Simpson County School District (rural): math 18% / reading 24% proficiency, ranked #90 of 130 in MS (top 69%) — low school quality limits family demand, transient renter base, plan for 1-2y turnover; 76% free/reduced lunch — lower-income household profile, screen leases tightly.
- Market conditions: 75 active listings in the ZIP; 3 units permitted in Simpson County in 2024 (0 in 5+ unit buildings).
Forward outlook
- In year one you build about $3k of equity ($553 loan paydown + $2k appreciation (2.9% local appreciation)).
- Simpson County population projected at -16% by 2050 — secular population decline; favor cash flow + early exit over multi-decade hold.
- At projected returns (2.9% appreciation + 3.0% rent growth), your $22k cash investment doubles in ~5 years — after that, you're playing with house money.
Negotiation context
- It's been on market 16 days — a 2% lower offer ($79k) is reasonable based on typical stale-listing flexibility.
Questions for the listing agent
- Is there a deadline driving the sale (1031 exchange, divorce, estate, relocation)? That informs how much negotiation room exists.
- Schools are F-rated, which usually means shorter tenancies and higher turnover. Who's the typical renter profile here, and what's been the actual vacancy rate?
- Crime grade is F in this area — have there been break-ins, vandalism, or insurance claims at this property in the last 3 years? What carrier currently insures it and at what premium?
- What's the average days-on-market for RENTAL listings here right now (not sales)? A rising rental-DOM trend means longer vacancies and softer asking-rent achievability than the comps imply.
- What's the recent tenant-quality profile in this submarket — average credit score on applications, eviction rate, late-payment / NSF rate, and stable-employment percentage? A property-management company in the area should have these aggregated.
- How much new for-sale + rental construction is in the pipeline within 1–3 miles? Heavy new supply typically softens prices + rents 12–24 months out; constrained supply supports both.
Investment metrics
- 1% rule
- 1.05% ✓
- Cap rate
- 7.94%
- Cash-on-cash
- 5.90%
- DSCR
- 1.26
- GRM
- 7.9
CMA / ARV
No comps found within radius.
Projected returns pro-forma
2.9% appreciation · 3.0% rent growth · sell at horizon
- IRR
- 12.8%
- Equity multiple
- 1.73×
- Total profit
- $16,242
- Equity at exit
- $35,525
- IRR
- 14.8%
- Equity multiple
- 3.17×
- Total profit
- $48,547
- Equity at exit
- $54,405
Cash invested: $22,400 (down + closing). Projections, not guarantees.
Landlord ↔ Tenant lean methodology
- Overall (STATE)
- 90 Strongly Landlord-Friendly
- State Mississippi
- 90 Strongly Landlord-Friendly · R+11
- County
- — inherits STATE
- City
- — inherits STATE
ZIP-level market 39111
- Home prices YoY
- 1.8%
- Active inventory
- 75
- Price-to-rent
- 7.9×
Monthly cashflow live
- Estimated rent
- $839 medium interval (Pro) →
- Mortgage (P&I)
- −$420
- Tax est. 1.5%
- −$100 /mo · $1,200/yr
- Insurance
- −$33
- HOA
- −$0
- Vacancy / Maint / Mgmt
- −$176
- Net cashflow
- $110
Break-even live
UW: 25.0% down · 7.5% · 30yr · 1.5% tax · 5.0% vac · 8.0% maint · 8.0% mgmt
Financing live
Cash to close
- Down payment
- $20,000
- Closing costs
- $2,400
- Reserves months
- —
- Total cash needed
- —
Loan-product check · same deal, 3 products live
Conventional
25% down · 7.5% · 30yr
- Down + closing
- —
- Monthly P&I
- —
- Monthly cashflow
- —
- DSCR
- —
- Eligible?
- —
Personal DTI + credit; lowest rate.
DSCR
20% down · 8.5% · 30yr
- Down + closing
- —
- Monthly P&I
- —
- Monthly cashflow
- —
- DSCR
- —
- Eligible?
- —
No personal income docs; deal must DSCR.
Hard money
10% down · 12.0% · 12mo
- Down + closing
- —
- Monthly P&I
- —
- Monthly cashflow
- —
- DSCR
- —
- Eligible?
- —
Short-term bridge; refi at stabilization.
Listing history 12 events
-
2026-06-18days on market $79,999 Active 16 DOM
-
2026-06-17days on market $79,999 Active 15 DOM
-
2026-06-16days on market $79,999 Active 14 DOM
-
2026-06-15days on market $79,999 Active 13 DOM
-
2026-06-13days on market $79,999 Active 11 DOM
-
2026-06-12days on market $79,999 Active 10 DOM
-
2026-06-09days on market $79,999 Active 7 DOM
-
2026-06-08days on market $79,999 Active 6 DOM
-
2026-06-07days on market $79,999 Active 5 DOM
-
2026-06-07days on market $79,999 Active 4 DOM
-
2026-06-02remarks 487-char remark
-
2026-06-02$79,999 Active 1 DOM
ⓘ Source: listings_history table (triggers on properties + properties_extension) + one-shot
backfill from property_details.listing_events for pre-trigger history.
Nearby sold comps map
Loading sold comps map…
Walkable amenities ~0.75 mi
Loading nearby amenities…
Taxation est. · year 1
- Rental income
- $10,070
- − Mortgage interest
- −$4,481
- − Property taxes
- −$1,200
- − Insurance
- −$400
- − Repairs & maintenance
- −$806
- − Management
- −$806
- − Depreciation
- −$2,327
- Taxable income
- $50
- Est. tax owed @ 24.0%
- −$12
- After-tax cash flow
- $1,309/yr
For passive investors: Depreciation is non-cash, so a rental often shows a tax loss while cash-flowing — sheltering income. Rental losses are passive: they offset passive income freely, and up to $25,000/yr can offset ordinary (W-2) income if you actively participate and your MAGI is under $100k (phasing out to $0 by $150k); unused losses carry forward. On sale, claimed depreciation is recaptured at up to 25%, and gains may owe capital-gains tax (a 1031 exchange can defer both). Figures are a year-1 estimate at your 24.0% rate — not tax advice; consult a CPA.
Condition & rehab AI · 13 photos
This single-wide mobile home is in good condition with recent updates, making it a great investment property.
Value-add opportunities
- Both Landscaping — Enhances curb appeal and adds value
- Both New flooring — Improves aesthetics and functionality
- Both New kitchen appliances — Modernizes the space and adds value
Renovation cost estimate screening
Value-add ROI direction
- Both Landscaping — Enhances curb appeal and adds value ↑
- Both New flooring — Improves aesthetics and functionality ↑
- Both New kitchen appliances — Modernizes the space and adds value ↑
ⓘ Cost ranges are severity-bucket heuristics (US national rule-of-thumb). Get contractor quotes + a written scope before underwriting a rehab budget.
Schools (NCES district)
- District
- Simpson County School District
- NCES district ID
- 2803990
- Math proficiency
- 18% ▼ -14.00%
- Reading proficiency
- 24% ▼ -9.00%
- Median HH income
- $36,826
- Composite
- 17.46/100
- National rank
- #9063
- State rank
- #90 of 130 in MS
Livability — Magee
- Score
- 63/100
- State rank
- #158
- US rank
- #15438
Category grades
Schools grade is shown separately in the Schools card above.
Census & demographics
- Census place
- Magee, MS
- Population (ZIP)
- 8,927
Population outlook (Simpson County) Hauer SSP2
- Today (2025)
- 26,197 people
- By 2030
- 25,474 · -2.8%
- By 2040
- 23,811 · -9.1%
- By 2050
- 22,024 · -15.9%
- By 2075
- 17,701 · -32.4%
- By 2100
- 13,732 · -47.6%
Race, ethnicity, and origin ACS 2023
- Neighborhood character
- Predominantly White (67%)
- Race & ethnicity
- White 67% Black 28% Hispanic / Latino 4% Two or more races 2%
- Common ancestry
- Serbian 5% Slovak 1% Italian 1%
- Foreign-born
- 2% · Canada
- Languages at home
- 97% English-only · Spanish 3%
Political lean MEDSL · Simpson
- 2024 margin
- Solid R (+36.7) · D 31.4% · R 68.1%
- 2008→2024 swing
- -14.3pp toward R · 2008: -22.4pp · 2024: -36.7pp
- All cycles
- 2024: R+36.7 2020: R+30.4 2016: R+30.9 2012: R+22.1 2008: R+22.4
Not yet ingested
- Civics
- —
Market trends
- HPI YoY
- ▲ 2.90%
- Current HPI
- 161.8264
- Rent YoY
- —
- Metro
- —
- State GDP YoY
- —
- F500 in state
- 0
Price history
1 event — show timeline
- 2026-05-29 Listed $79,999 Fizber.com
Cash-flow waterfall
monthlySold comps — $/sqft
last 12 mo · ≤1 miLoading sold comps…