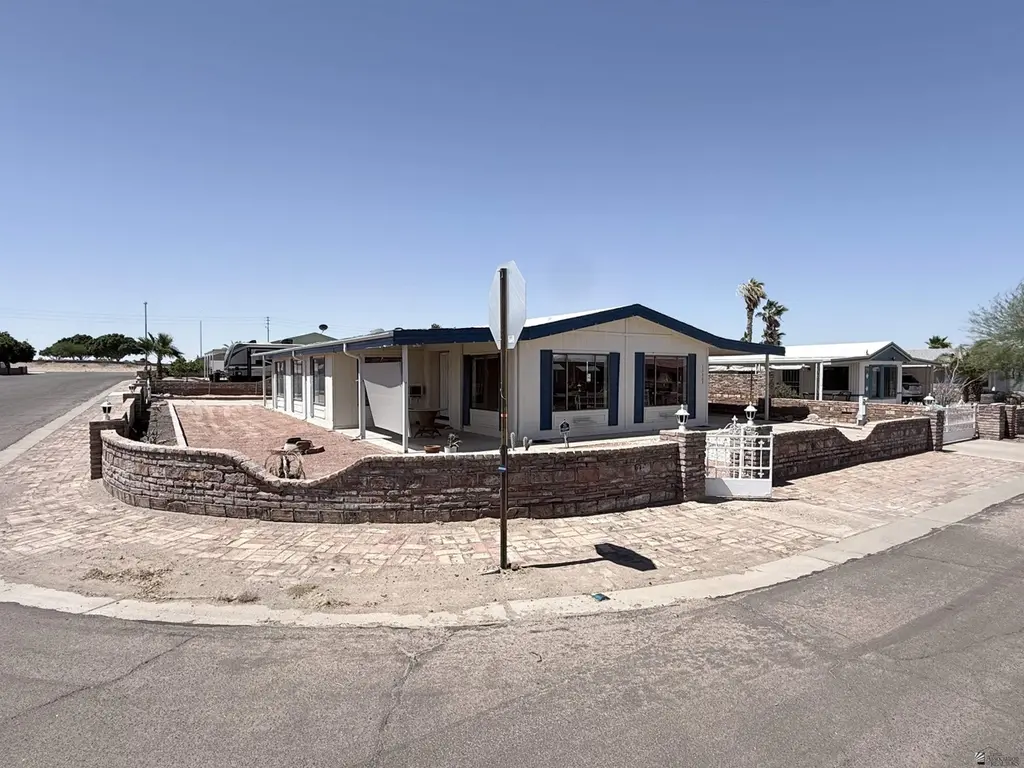
11323 E 39 Pl · Fortuna Foothills, AZ
Flood risk 1/10 · Minimal
- FEMA flood zone
- X (shaded)
- Chance of flooding over 30 yrs
- 0.0%
- Est. flood insurance / yr
- $507 – $1,088
Fire risk 4/10 · Minor
- Est. fire insurance / yr
- $610 – $1,132
Heat risk 9/10 · Severe
- Hot days now (above 114°F)
- 5 days/yr
- Hot days in 30 yrs
- 14 days/yr
Wind risk 1/10 · Minimal
- Chance of severe wind over 30 yrs
- —
Air-quality risk 1/10 · Minimal
- Unhealthy air days now
- 0 days/yr
- Unhealthy air days in 30 yrs
- 0 days/yr
Risk factors via First Street. Map © Google.
Why this score? — see what drove the B- grade
The composite is a weighted blend of 9 inputs, each scored 0–100. Each bar is that input's sub-score; the figure is the points it added to the 100-point composite (weight × sub-score).
- Cash flow +27.5/30.0
- ARV discount +15.0/15.0
- DSCR +9.6/10.0
- 1% rule +6.6/10.0
- Rent growth +3.6/5.0
- Livability +3.0/5.0
- Condition / age +2.5/5.0
- Schools +1.3/10.0
- Appreciation +0.0/10.0
$148,000
🖨 Deal sheet 📄 Offer letter ✓ Due diligence
Listing remarks MLS
Come see this spacious 2 bedroom, , 2 bath Manufactured home on corner lot. Vaulted ceilings, ceiling fans, laminate flooring in kitchen & formal dinning room. Carpet in Living room & bedrooms. Double gates & RV parking, Storage shed. Some Furniture will convey.
Key facts
- Roomy kitchen
- Big corner lot
- Covered patio
Tags
Property features AI
Finance
- HOA & community: Curbs and sidewalks in the community
Exterior
- Parking: 2 parking spaces (2 covered); Attached garage; Attached carport with 2 carport spaces; RV access/parking; Open parking
- Utilities: Septic tank
- Home design: Mobile home (residential); Located in a senior community (55+)
- Exterior features: Covered patio; Sliding doors; Workshop; Paved road
Interior
- Kitchen: Cooktop; Oven
- Flooring: Carpet; Other
- Bathrooms: 2 full bathrooms
- Heating & cooling: Has heating; Has cooling
- Interior features: Blinds; No fireplace
Neighborhood map
What this means for you Summary
Snapshot
- This is a 2-bed/2.0-bath manufactured listed at $148k.
Deal economics
- At list price, monthly cash flow is $435 ($5k/yr) — positive.
- The deal already cash-flows at list — no discount required.
- Meets the 1% rule at list price ($2k rent vs $148k).
- Cap rate 9.8% vs local median 4.2% in Fortuna Foothills — top-decile yield for the area; either an underpriced asset or a hidden risk that comps aren't pricing in. Stress-test before assuming the spread holds.
Location & tenants
- Location reads 60/100 on livability (#174 in AZ) — a middle-class / working-renter tenant base. Strengths: cost of living A+, housing A+; Watch: employment C-, schools F, crime F.
- Yuma Union High School District (4507) (urban): math 14% / reading 16% proficiency, ranked #212 of 249 in AZ (top 85%) — low school quality limits family demand, transient renter base, plan for 1-2y turnover.
- Market conditions: Rents rising fast (+4.5%/yr); 413 active listings in the ZIP; 17 comparable units currently listed for rent nearby; rentals leasing fast (median 13d on market — plan ~1-2 weeks tenant-placement turnaround); 1,399 units permitted in Yuma County in 2024 (180 in 5+ unit buildings).
- This rent runs 35% of the median local income ($58k/yr) — at the standard rent-burdened threshold; future hikes will face affordability resistance.
Forward outlook
- Local home prices are declining (-3.0%/yr); year-one equity from $1k of loan paydown is wiped out by about $4k of value loss. Plan a longer hold.
- Yuma County population projected at +4% by 2050 — modest demand growth; plan on rents tracking national, not racing it.
- At projected returns (-3.0% appreciation + 4.5% rent growth), your $41k cash investment doubles in ~8 years — after that, you're playing with house money.
Negotiation context
- Only 10 days on market — expect competitive offers; lowballing is unlikely to land.
- 3 sale attempts since 3y ago with the ask held roughly flat each time — persistent listings suggest the price (not the market) is what's stuck; bring a comps-based counter.
Risks & watch-outs
- Climate carrying-cost: extreme-heat days projected 5→14/yr by 2055 (HVAC capex compounding) — expect insurance premiums to compound above CPI over the hold.
Questions for the listing agent
- Is there a deadline driving the sale (1031 exchange, divorce, estate, relocation)? That informs how much negotiation room exists.
- Schools are F-rated, which usually means shorter tenancies and higher turnover. Who's the typical renter profile here, and what's been the actual vacancy rate?
- Crime grade is F in this area — have there been break-ins, vandalism, or insurance claims at this property in the last 3 years? What carrier currently insures it and at what premium?
- What's the average days-on-market for RENTAL listings here right now (not sales)? A rising rental-DOM trend means longer vacancies and softer asking-rent achievability than the comps imply.
- What's the recent tenant-quality profile in this submarket — average credit score on applications, eviction rate, late-payment / NSF rate, and stable-employment percentage? A property-management company in the area should have these aggregated.
- How much new for-sale + rental construction is in the pipeline within 1–3 miles? Heavy new supply typically softens prices + rents 12–24 months out; constrained supply supports both.
Investment metrics
- 1% rule
- 1.16% ✓
- Cap rate
- 9.82%
- Cash-on-cash
- 12.60%
- DSCR
- 1.56
- GRM
- 7.2
CMA / ARV
- ARV (on-the-fly)
- $216,000
- Comps found
- 12
Show comp detail 12 sales within ~0.75 mi
| Address | Dist | Beds/Ba | Sqft | Sold | Price | $/sf | Match |
|---|---|---|---|---|---|---|---|
| 11326 E 38 St | 0.22mi | 2/2.0 | 1,438 (-0%) | 1mo | $216,000 | $150 | 89 |
| 11324 E 39 Pl | 0.03mi | 2/2.0 | 1,303 (-10%) | 3mo | $260,000 | $200 | 81 |
| 11433 E 38 Ln | 0.17mi | 3/3.0 (+1) | 1,440 (0%) | 5mo | $325,000 | $226 | 79 |
| 11337 E 37 St | 0.36mi | 2/2.0 | 1,408 (-2%) | 5mo | $242,500 | $172 | 75 |
| 11386 S Scottsdale Dr | 0.47mi | 2/2.0 | 1,419 (-2%) | 4mo | $185,000 | $130 | 72 |
| 11279 S Phoenix Dr | 0.61mi | 2/2.0 | 1,429 (-1%) | 1mo | $199,900 | $140 | 70 |
| 11423 E 38 Ln | 0.16mi | 2/2.0 | 1,248 (-13%) | 2mo | $175,000 | $140 | 68 |
| 11425 E 34 Pl | 0.61mi | 3/2.0 (+1) | 1,411 (-2%) | 1mo | $210,000 | $149 | 62 |
| 11367 S Mesa Dr | 0.45mi | 2/2.0 | 1,248 (-13%) | 4mo | $205,000 | $164 | 54 |
| 11337 E 34 St | 0.64mi | 2/2.0 | 1,561 (+8%) | 4mo | $215,000 | $138 | 52 |
| 11466 E 35 Pl | 0.55mi | 2/2.0 | 1,248 (-13%) | 1mo | $190,000 | $152 | 51 |
| 11465 E 34 Pl | 0.62mi | 2/2.0 | 1,235 (-14%) | 3mo | $173,000 | $140 | 45 |
Match score weights: distance 35% · size 25% · config 20% · recency 20%. Top-matched comps best support the ARV.
Projected returns pro-forma
-3.0% appreciation · 4.46% rent growth · sell at horizon
- IRR
- 3.9%
- Equity multiple
- 1.15×
- Total profit
- $6,259
- Equity at exit
- $22,067
- IRR
- 14.6%
- Equity multiple
- 2.25×
- Total profit
- $51,806
- Equity at exit
- $12,796
Cash invested: $41,440 (down + closing). Projections, not guarantees.
Landlord ↔ Tenant lean methodology
- Overall (STATE)
- 87 Strongly Landlord-Friendly
- State Arizona
- 87 Strongly Landlord-Friendly · R+3
- County
- — inherits STATE
- City
- — inherits STATE
ZIP-level market 85367
- Home prices YoY
- -26.2%
- Rents YoY
- 4.5%
- Active inventory
- 413
- Price-to-rent
- 7.2×
Monthly cashflow live
- Estimated rent
- $1,716 high interval (Pro) →
- Mortgage (P&I)
- −$776
- Tax from tax record
- −$82 /mo · $989/yr
- Insurance
- −$62
- HOA
- −$0
- Vacancy / Maint / Mgmt
- −$360
- Net cashflow
- $435
Break-even live
UW: 25.0% down · 7.5% · 30yr · 1.5% tax · 5.0% vac · 8.0% maint · 8.0% mgmt
Financing live
Cash to close
- Down payment
- $37,000
- Closing costs
- $4,440
- Reserves months
- —
- Total cash needed
- —
Loan-product check · same deal, 3 products live
Conventional
25% down · 7.5% · 30yr
- Down + closing
- —
- Monthly P&I
- —
- Monthly cashflow
- —
- DSCR
- —
- Eligible?
- —
Personal DTI + credit; lowest rate.
DSCR
20% down · 8.5% · 30yr
- Down + closing
- —
- Monthly P&I
- —
- Monthly cashflow
- —
- DSCR
- —
- Eligible?
- —
No personal income docs; deal must DSCR.
Hard money
10% down · 12.0% · 12mo
- Down + closing
- —
- Monthly P&I
- —
- Monthly cashflow
- —
- DSCR
- —
- Eligible?
- —
Short-term bridge; refi at stabilization.
Rent comps 17 comps
| Address | Beds | Baths | Sqft | Rent | $/sqft | DOM | Units | Dist |
|---|---|---|---|---|---|---|---|---|
| 10638 E 38th Pl Yuma, AZ | 3.0 | 2.0 | 1572 | $1,650 | $1.05 | 20d | 1 | 0.66mi |
| 12115 E 39th St Yuma, AZ | 3.0 | 2.0 | 1666 | $1,700 | $1.02 | 13d | 1 | 0.72mi |
| 11381 S Kingman Ave Yuma, AZ | 3.0 | 2.0 | 1247 | $1,650 | $1.32 | 13d | 1 | 0.73mi |
| 11367 S Kingman Ave Yuma, AZ | 2.0 | 2.0 | 1200 | $1,495 | $1.25 | 13d | 1 | 0.74mi |
| 11623 E 33rd Way Yuma, AZ | 3.0 | 2.0 | 1386 | $1,795 | $1.30 | 13d | 1 | 0.75mi |
| 12627 S Prescott Rd Yuma, AZ | 3.0 | 2.0 | 1168 | $1,500 | $1.28 | 13d | 1 | 0.80mi |
| 11525 S Chaparral Dr Yuma, AZ | 2.0 | 2.0 | 1102 | $1,700 | $1.54 | 13d | 1 | 0.91mi |
| 12255 E 37th St Yuma, AZ | 2.0 | 2.0 | 967 | $1,600 | $1.65 | 13d | 1 | 0.91mi |
| 11649 E 33rd Pl Yuma, AZ | 3.0 | 2.0 | 1300 | $1,700 | $1.31 | 13d | 1 | 1.06mi |
| 10768 S Monterrey Way Yuma, AZ | 3.0 | 2.0 | 1653 | $1,995 | $1.21 | 20d | 1 | 1.09mi |
| 10164 E 39th St Yuma, AZ | 3.0 | 2.0 | 1498 | $1,800 | $1.20 | 13d | 1 | 1.20mi |
| 10736 S Calle Raquel Yuma, AZ | 3.0 | 2.5 | 1308 | $1,600 | $1.22 | 13d | 1 | 1.28mi |
| 10155 E 35th St Yuma, AZ | 3.0 | 2.0 | 1460 | $1,750 | $1.20 | 13d | 1 | 1.32mi |
| 12443 E Brenda Dr Yuma, AZ | 2.0 | 2.0 | 914 | $1,400 | $1.53 | 13d | 1 | 1.36mi |
| 10685 S Calle Raquel Yuma, AZ | 3.0 | 2.5 | 1190 | $2,500 | $2.10 | 13d | 1 | 1.36mi |
| 10608 Avenida Canela Yuma, AZ | 3.0 | 2.0 | 1580 | $1,800 | $1.14 | 13d | 1 | 1.39mi |
| 12408 E Calle Maria Yuma, AZ | 3.0 | 2.0 | 1259 | $1,800 | $1.43 | 13d | 1 | 1.48mi |
Listing history 9 events
-
2026-06-19days on market $148,000 Active 10 DOM
-
2026-06-18days on market $148,000 Active 9 DOM
-
2026-06-17days on market $148,000 Active 8 DOM
-
2026-06-16days on market $148,000 Active 7 DOM
-
2026-06-15days on market $148,000 Active 6 DOM
-
2026-06-14days on market $148,000 Active 4 DOM
-
2026-06-13days on market $148,000 Active 3 DOM
-
2026-06-10remarks 549-char remark
-
2026-06-10$148,000 Active 1 DOM
ⓘ Source: listings_history table (triggers on properties + properties_extension) + one-shot
backfill from property_details.listing_events for pre-trigger history.
Tax reassessment forecast AZ · Resets to sale price
- Current annual tax
- $989 · $82/mo
- Projected year-2 tax
- $989 · $82/mo
- Expected delta
- $0/yr ($0/mo · 0.0%)
ⓘ Screening estimate from a state-policy table — verify with the county assessor before closing.
Climate risk First Street
- Flood 1/10 Low FEMA zone X (shaded) · 0% chance over 30 yrs
- Wildfire 4/10 Moderate
- Heat 9/10 Extreme 5 d/yr ≥114°F today · 14 d/yr by 30 yrs out
- Wind 1/10 Low
- Air quality 1/10 Low 0 unhealthy d/yr today · 0 by 30 yrs out
Nearby sold comps map
Loading sold comps map…
Walkable amenities ~0.75 mi
Loading nearby amenities…
Taxation est. · year 1
- Rental income
- $20,590
- − Mortgage interest
- −$8,290
- − Property taxes
- −$989
- − Insurance
- −$740
- − Repairs & maintenance
- −$1,647
- − Management
- −$1,647
- − Depreciation
- −$4,305
- Taxable income
- $2,970
- Est. tax owed @ 24.0%
- −$713
- After-tax cash flow
- $4,510/yr
For passive investors: Depreciation is non-cash, so a rental often shows a tax loss while cash-flowing — sheltering income. Rental losses are passive: they offset passive income freely, and up to $25,000/yr can offset ordinary (W-2) income if you actively participate and your MAGI is under $100k (phasing out to $0 by $150k); unused losses carry forward. On sale, claimed depreciation is recaptured at up to 25%, and gains may owe capital-gains tax (a 1031 exchange can defer both). Figures are a year-1 estimate at your 24.0% rate — not tax advice; consult a CPA.
Schools (NCES district)
- District
- Yuma Union High School District (4507)
- NCES district ID
- 0409630
- Math proficiency
- 14% ▼ -12.00%
- Reading proficiency
- 16% ▼ -10.00%
- Median HH income
- $40,512
- Composite
- 12.86/100
- National rank
- #9592
- State rank
- #212 of 249 in AZ
Livability — Fortuna Foothills
- Score
- 60/100
- State rank
- #174
- US rank
- #18663
Category grades
Schools grade is shown separately in the Schools card above.
Census & demographics
- Census place
- Fortuna Foothills, AZ
- County
- Yuma County · 149,809 people
- City population
- 21,356
- Metro
- Yuma, AZ
- Population (ZIP)
- 22,074
- Household income
- $58,469
- Rent vs Own
- Severe rent burden
- 408.0
Population outlook (Yuma County) Hauer SSP2
- Today (2025)
- 211,633 people
- By 2030
- 214,114 · +1.2%
- By 2040
- 217,856 · +2.9%
- By 2050
- 220,276 · +4.1%
- By 2075
- 222,359 · +5.1%
- By 2100
- 198,880 · -6.0%
Race, ethnicity, and origin ACS 2023
- Neighborhood character
- Predominantly White (71%)
- Race & ethnicity
- White 71% Hispanic / Latino 22% Two or more races 11% Black 3%
- Hispanic origin (detail)
- Mexican 20%
- Common ancestry
- Portuguese 4% Lithuanian 2% Italian 2%
- Foreign-born
- 10% · Canada
- Languages at home
- 81% English-only · Spanish 16% French/Haitian/Cajun 1% German/W. Germanic 1%
Political lean MEDSL · Yuma
- 2024 margin
- Strong R (+20.4) · D 39.3% · R 59.8%
- 2008→2024 swing
- -6.6pp toward R · 2008: -13.8pp · 2024: -20.4pp
- All cycles
- 2024: R+20.4 2020: R+6.2 2016: R+5.5 2012: R+16.1 2008: R+13.8
Not yet ingested
- Civics
- —
Market trends
- HPI YoY
- ▼ -80.81%
- Current HPI
- 227.2692
- Rent YoY
- ▲ 4.46%
- Metro
- Yuma, AZ
- State GDP YoY
- ▲ 4.54%
- F500 in state
- 20
Industry mix (Fortune 500 HQ in AZ)
| Industry | F500 HQs | Revenue |
|---|---|---|
| Technology | 2 | $13B |
|
||
| Mining / Metals | 1 | $23B |
|
||
| Environmental Services | 1 | $16B |
|
||
| Metals / Steel | 1 | $14B |
|
||
| Technology Distribution | 1 | $9B |
|
||
| Homebuilding | 1 | $8B |
|
||
Price history
+7.6% since first listed8 events — show timeline
- 2026-06-09 Listed $148,000 YAR
- 2023-10-12 Sold (Public Records) $160,000 Public Records
- 2023-10-12 Sold (MLS) $168,563 YAR
- 2023-08-28 Contingent — YAR
- 2023-08-18 Relisted — YAR
- 2023-08-09 Delisted — YAR
- 2023-08-03 Listed $164,900 YAR
- 2009-03-11 Sold (Public Records) $137,500 Public Records
Property tax history
+2.6%/yrLatest (2025): $989 · +2.6% YoY. Source: county tax records.
Cash-flow waterfall
monthlySold comps — $/sqft
last 12 mo · ≤1 miLoading sold comps…