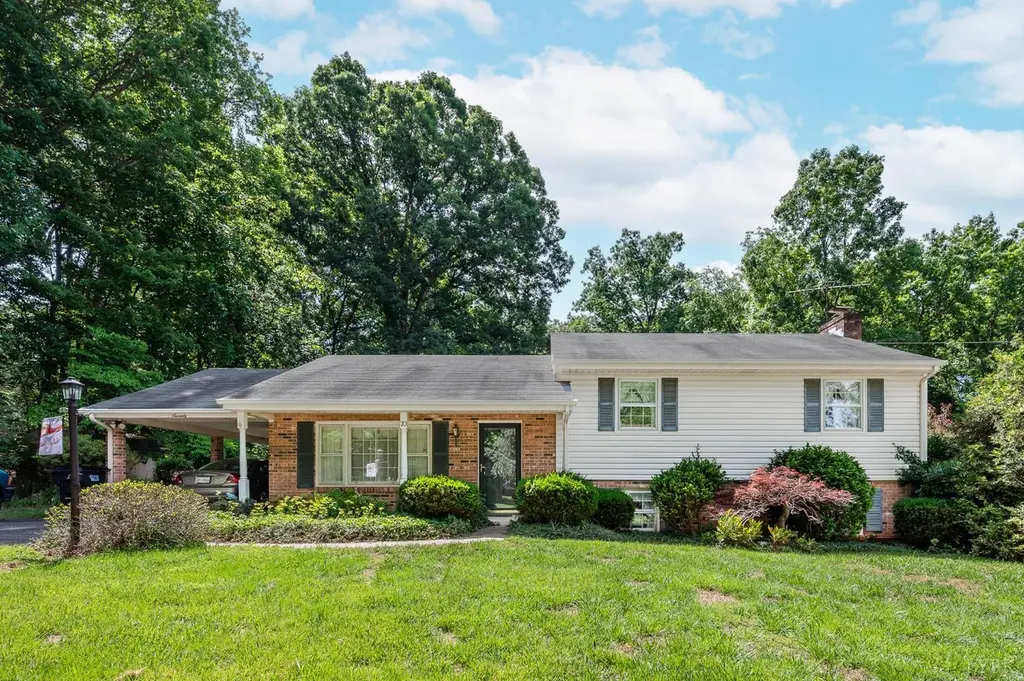
70 Westfield Dr · Timberlake, VA
Flood risk 1/10 · Minimal
- FEMA flood zone
- X (unshaded)
- Chance of flooding over 30 yrs
- 0.0%
- Est. flood insurance / yr
- $473 – $860
Fire risk 4/10 · Minor
- Est. fire insurance / yr
- $666 – $1,236
Heat risk 5/10 · Moderate
- Hot days now (above 101°F)
- 7 days/yr
- Hot days in 30 yrs
- 18 days/yr
Wind risk 2/10 · Minimal
- Chance of severe wind over 30 yrs
- 3.0%
Air-quality risk 2/10 · Minimal
- Unhealthy air days now
- 1 days/yr
- Unhealthy air days in 30 yrs
- 1 days/yr
Risk factors via First Street. Map © Google.
Why this score? — see what drove the D+ grade
The composite is a weighted blend of 9 inputs, each scored 0–100. Each bar is that input's sub-score; the figure is the points it added to the 100-point composite (weight × sub-score).
- ARV discount +15.0/15.0
- Cash flow +12.9/30.0
- Schools +5.2/10.0
- DSCR +3.8/10.0
- Rent growth +3.8/5.0
- Livability +3.5/5.0
- Condition / age +2.5/5.0
- 1% rule +2.4/10.0
- Appreciation +0.0/10.0
$269,900
🖨 Deal sheet 📄 Offer letter ✓ Due diligence
Listing remarks
Great location right off Timberlake in the Brookville School district! Featuring over 2,000 square feet, 4 bedrooms and 3 full bathrooms. Home is being sold As-Is but is a great price with lots of equity potential for you to come in and update with your personal touches. Yard is private and has two sheds for storage. Large living room and kitchen opens to the dining space. Upstairs boasts master bedroom with its own private bath and also two more bedrooms and a full bathroom. Terrace level boasts a very large den for a second entertaining space, a fourth bedroom and third full bathroom. This is a rare split level home that also features three finished level plus an unfinished basement as we
Key facts
- Large den
- Quiet cul-de-sac
- Carport
Tags
Property features AI
Exterior
- Parking: Carport (1 space); Paved off-street parking
- Utilities: Septic tank
- Home design: Single family residence; Residential property; Above-grade finished living area and additional finished lower-level space
- Construction: Brick and vinyl siding exterior
- Exterior features: Porch; Shingle roof
Interior
- Kitchen: Dishwasher; Electric range; Refrigerator
- Flooring: Carpet; Hardwood; Laminate; Wood
- Bathrooms: 3 full bathrooms
- Heating & cooling: Baseboard heating; Heat pump
- Interior features: Finished full walk-out basement; Porch
- Laundry & utility: Washer hookup in basement; Electric water heater
Neighborhood map
What this means for you Summary
Snapshot
- This is a 4-bed/2.5-bath single-family listed at $270k.
Deal economics
- At list price, monthly cash flow is $-22 ($-258/yr) — negative.
- To cash-flow at today's rent, offer at most $266k (1.4% below list).
- To meet the 1% rule (rent ≥ 1% of price), the offer needs to be $201k (25.5% below list).
- Recommended offer: $201k (25.5% below list) — sets the bar for 1% rule.
- Cap rate 6.2% vs local median 3.8% in Timberlake — top-decile yield for the area; either an underpriced asset or a hidden risk that comps aren't pricing in. Stress-test before assuming the spread holds.
Location & tenants
- Location reads 70/100 on livability (#227 in VA) — a middle-class / working-renter tenant base. Strengths: cost of living A+, housing A+; Watch: health & safety C-, commute D+, amenities F.
- Campbell County Public School District (rural): math 55% / reading 68% proficiency, ranked #55 of 131 in VA (top 42%) — acceptable for families but not a draw, mixed tenant base, ~2y average lease.
- Zoned schools: Tomahawk Elementary (math 61% / reading 70%, grade B+, #410 of 1,108 statewide, top 37%, 685 students, 74% FRL); Brookville Middle (math 44% / reading 72%, grade B, #174 of 342 statewide, top 51%, 715 students, 74% FRL); Brookville High (math 66% / reading 82%, grade B+, #120 of 319 statewide, top 38%, 971 students, 69% FRL) — zoned schools average 72% FRL vs 37% district-wide (35 pts higher); higher-poverty schools than district average — tighter screening recommended.
- Market conditions: Rents rising fast (+5.1%/yr); 318 active listings in the ZIP; 5 comparable units currently listed for rent nearby; rentals leasing fast (median 14d on market — plan ~1-2 weeks tenant-placement turnaround); 315 units permitted in Campbell County in 2024 (51 in 5+ unit buildings).
- This rent runs 35% of the median local income ($69k/yr) — at the standard rent-burdened threshold; future hikes will face affordability resistance.
Forward outlook
- Local home prices are declining (-3.0%/yr); year-one equity from $2k of loan paydown is wiped out by about $8k of value loss. Plan a longer hold.
- Campbell County population projected to shrink 6% by 2050 — rents likely to lag national; underwrite the cash flow, not the appreciation.
Negotiation context
- Only 4 days on market — expect competitive offers; lowballing is unlikely to land.
Risks & watch-outs
- Climate carrying-cost: extreme-heat days projected 7→18/yr by 2055 (HVAC capex compounding) — expect insurance premiums to compound above CPI over the hold.
Questions for the listing agent
- What do current leases actually rent for vs. the listed asking? Can we see a recent rent roll and the last 12 months of T-12 income?
- Built in 1969 — when were the roof, HVAC, electrical panel, plumbing, and water heater last replaced?
- Is there a deadline driving the sale (1031 exchange, divorce, estate, relocation)? That informs how much negotiation room exists.
- Schools are F-rated, which usually means shorter tenancies and higher turnover. Who's the typical renter profile here, and what's been the actual vacancy rate?
- The area grade is low — what's the realistic commute time and amenity access for the typical tenant pool here? Any planned neighborhood developments (good or bad) we should know about?
- What's the average days-on-market for RENTAL listings here right now (not sales)? A rising rental-DOM trend means longer vacancies and softer asking-rent achievability than the comps imply.
- What's the recent tenant-quality profile in this submarket — average credit score on applications, eviction rate, late-payment / NSF rate, and stable-employment percentage? A property-management company in the area should have these aggregated.
- How much new for-sale + rental construction is in the pipeline within 1–3 miles? Heavy new supply typically softens prices + rents 12–24 months out; constrained supply supports both.
Investment metrics
- 1% rule
- 0.74% ✗
- Cap rate
- 6.20%
- Cash-on-cash
- -0.34%
- DSCR
- 0.98
- GRM
- 11.2
CMA / ARV
- ARV (on-the-fly)
- $380,380
- Comps found
- 12
Show comp detail 12 sales within ~0.75 mi
| Address | Dist | Beds/Ba | Sqft | Sold | Price | $/sf | Match |
|---|---|---|---|---|---|---|---|
| 643 Willow Oak Ter | 0.30mi | 3/2.0 (-1) | 1,986 (-1%) | 8mo | $329,900 | $166 | 72 |
| 636 Willow Oak Ter | 0.26mi | 3/2.5 (-1) | 2,248 (+12%) | 3mo | $305,000 | $136 | 60 |
| 139 Woodhaven Dr | 0.23mi | 3/2.5 (-1) | 1,777 (-11%) | 7mo | $299,999 | $169 | 60 |
| 1593 Timberlake Dr Dr | 0.70mi | 4/2.0 | 2,030 (+1%) | 4mo | $386,000 | $190 | 60 |
| 441 Greenwell Ct | 0.66mi | 3/1.5 (-1) | 1,942 (-3%) | 0mo | $290,000 | $149 | 55 |
| 369 Greenwell CT Ct | 0.66mi | 3/2.0 (-1) | 2,061 (+3%) | 7mo | $195,000 | $95 | 52 |
| 659 Timberlake Dr | 0.24mi | 3/2.5 (-1) | 1,756 (-12%) | 14mo | $347,900 | $198 | 51 |
| 1890 Timberlake Dr | 0.60mi | 3/2.5 (-1) | 2,170 (+8%) | 11mo | $875,000 | $403 | 43 |
| 153 Emberly | 0.73mi | 3/2.0 (-1) | 1,812 (-10%) | 1mo | $420,000 | $232 | 43 |
| 1336 Timberlake Dr | 0.61mi | 3/2.0 (-1) | 1,821 (-9%) | 14mo | $450,000 | $247 | 38 |
| 72 Preston Pl | 0.66mi | 3/2.0 (-1) | 1,770 (-12%) | 7mo | $339,500 | $192 | 37 |
| 438 Greenwell Ct | 0.70mi | 3/2.0 (-1) | 1,755 (-12%) | 14mo | $324,900 | $185 | 28 |
Match score weights: distance 35% · size 25% · config 20% · recency 20%. Top-matched comps best support the ARV.
Projected returns pro-forma
-3.0% appreciation · 5.11% rent growth · sell at horizon
- IRR
- -14.9%
- Equity multiple
- 0.46×
- Total profit
- $-40,877
- Equity at exit
- $40,243
- IRR
- -3.5%
- Equity multiple
- 0.75×
- Total profit
- $-19,211
- Equity at exit
- $23,336
Cash invested: $75,572 (down + closing). Projections, not guarantees.
Landlord ↔ Tenant lean methodology
- Overall (STATE)
- 55 Moderately Landlord-Leaning
- State Virginia
- 55 Moderately Landlord-Leaning · D+2
- County
- — inherits STATE
- City
- — inherits STATE
ZIP-level market 24502
- Rents YoY
- 5.1%
- Active inventory
- 318
- Price-to-rent
- 11.2×
Monthly cashflow live
- Estimated rent
- $2,010 high interval (Pro) →
- Mortgage (P&I)
- −$1,415
- Tax from tax record
- −$81 /mo · $978/yr
- Insurance
- −$112
- HOA
- −$0
- Vacancy / Maint / Mgmt
- −$422
- Net cashflow
- $-22
Break-even live
UW: 25.0% down · 7.5% · 30yr · 1.5% tax · 5.0% vac · 8.0% maint · 8.0% mgmt
Financing live
Cash to close
- Down payment
- $67,475
- Closing costs
- $8,097
- Reserves months
- —
- Total cash needed
- —
Loan-product check · same deal, 3 products live
Conventional
25% down · 7.5% · 30yr
- Down + closing
- —
- Monthly P&I
- —
- Monthly cashflow
- —
- DSCR
- —
- Eligible?
- —
Personal DTI + credit; lowest rate.
DSCR
20% down · 8.5% · 30yr
- Down + closing
- —
- Monthly P&I
- —
- Monthly cashflow
- —
- DSCR
- —
- Eligible?
- —
No personal income docs; deal must DSCR.
Hard money
10% down · 12.0% · 12mo
- Down + closing
- —
- Monthly P&I
- —
- Monthly cashflow
- —
- DSCR
- —
- Eligible?
- —
Short-term bridge; refi at stabilization.
Rent comps 5 comps
| Address | Beds | Baths | Sqft | Rent | $/sqft | DOM | Units | Dist |
|---|---|---|---|---|---|---|---|---|
| 64 Maybrook Dr Lynchburg, VA | 3.0 | 2.5 | 2000 | $2,000 | $1.00 | 43d | 1 | 0.16mi |
| 702 Goose Meadow Dr Forest, VA | 3.0 | 2.5 | 1532 | $1,595 | $1.04 | 21d | 1 | 0.84mi |
| 27 Odara Dr Forest, VA | 1.0–3.0 | 1.0–2.0 | 1285 | $1,495 | $1.16 | 13d | 1 | 0.85mi |
| 112 Mozart Ln Unit 2301 1559SF 3BD/2BA Lynchburg, VA | 3.0 | 2.0 | 1559 | $1,695 | $1.09 | 13d | 1 | 1.40mi |
| 95 Buxton Dr Lynchburg, VA | 4.0 | 2.0 | 2300 | $2,200 | $0.96 | 13d | 1 | 1.46mi |
Listing history 4 events
-
2026-06-14statusdays on market $269,900 Pending 4 DOM
-
2026-06-13days on market $269,900 Active 3 DOM
-
2026-06-10remarks 699-char remark
-
2026-06-10$269,900 Active 1 DOM
ⓘ Source: listings_history table (triggers on properties + properties_extension) + one-shot
backfill from property_details.listing_events for pre-trigger history.
Tax reassessment forecast VA · Resets to sale price
- Current annual tax
- $978 · $81/mo
- Projected year-2 tax
- $2,213 · $184/mo
- Expected delta
- +$1,235/yr (+$103/mo · 126.3%)
ⓘ Screening estimate from a state-policy table — verify with the county assessor before closing.
Climate risk First Street
- Flood 1/10 Low FEMA zone X (unshaded) · 0% chance over 30 yrs
- Wildfire 4/10 Moderate
- Heat 5/10 Major 7 d/yr ≥101°F today · 18 d/yr by 30 yrs out
- Wind 2/10 Low 3% chance of damaging wind over 30 yrs
- Air quality 2/10 Low 1 unhealthy d/yr today · 1 by 30 yrs out
Nearby sold comps map
Loading sold comps map…
Walkable amenities ~0.75 mi
Loading nearby amenities…
Taxation est. · year 1
- Rental income
- $24,118
- − Mortgage interest
- −$15,119
- − Property taxes
- −$978
- − Insurance
- −$1,350
- − Repairs & maintenance
- −$1,929
- − Management
- −$1,929
- − Depreciation
- −$7,852
- Taxable loss
- −$5,038
- Est. tax savings @ 24.0%
- +$1,209
- After-tax cash flow
- $951/yr
For passive investors: Depreciation is non-cash, so a rental often shows a tax loss while cash-flowing — sheltering income. Rental losses are passive: they offset passive income freely, and up to $25,000/yr can offset ordinary (W-2) income if you actively participate and your MAGI is under $100k (phasing out to $0 by $150k); unused losses carry forward. On sale, claimed depreciation is recaptured at up to 25%, and gains may owe capital-gains tax (a 1031 exchange can defer both). Figures are a year-1 estimate at your 24.0% rate — not tax advice; consult a CPA.
Schools (NCES district)
- District
- Campbell County Public School District
- NCES district ID
- 5100600
- Math proficiency
- 55% ▼ -29.00%
- Reading proficiency
- 68% ▼ -11.00%
- Median HH income
- $45,915
- Composite
- 51.88/100
- National rank
- #1656
- State rank
- #55 of 131 in VA
Livability — Timberlake
- Score
- 70/100
- State rank
- #227
- US rank
- #7595
Category grades
Schools grade is shown separately in the Schools card above.
Census & demographics
- Census place
- Timberlake, VA
- County
- Lynchburg City · 97,036 people
- Metro
- Lynchburg, VA
- Population (ZIP)
- 41,979
- Household income
- $68,872
- Rent vs Own
- Severe rent burden
- 1774.0
Population outlook (Campbell County) Hauer SSP2
- Today (2025)
- 56,306 people
- By 2030
- 56,366 · +0.1%
- By 2040
- 55,406 · -1.6%
- By 2050
- 53,011 · -5.9%
- By 2075
- 45,932 · -18.4%
- By 2100
- 36,029 · -36.0%
Race, ethnicity, and origin ACS 2023
- Neighborhood character
- Predominantly White (68%)
- Race & ethnicity
- White 68% Black 19% Two or more races 6% Hispanic / Latino 6% Asian 2%
- Hispanic origin (detail)
- Mexican 2%
- Common ancestry
- Slovak 3% Italian 2% Lithuanian 2%
- Foreign-born
- 6% · Canada, South Korea, United Kingdom
- Languages at home
- 91% English-only · Spanish 4% Other Indo-European 1% Other Asian/Pacific 1%
Political lean MEDSL · Campbell
- 2024 margin
- Solid R (+48.6) · D 25.3% · R 73.9%
- 2008→2024 swing
- -12.3pp toward R · 2008: -36.2pp · 2024: -48.6pp
- All cycles
- 2024: R+48.6 2020: R+44.1 2016: R+47.2 2012: R+39.4 2008: R+36.2
Not yet ingested
- Civics
- —
Market trends
- HPI YoY
- ▼ -222.79%
- Current HPI
- 241.9041
- Rent YoY
- ▲ 5.11%
- Metro
- Lynchburg, VA
- State GDP YoY
- ▲ 2.40%
- F500 in state
- 50
Industry mix (Fortune 500 HQ in VA)
| Industry | F500 HQs | Revenue |
|---|---|---|
| Aerospace / Defense | 4 | $236B |
|
||
| Technology / Defense | 3 | $32B |
|
||
| Financial Services | 2 | $176B |
|
||
| Utilities | 2 | $27B |
|
||
| Insurance | 2 | $25B |
|
||
| Technology | 2 | $15B |
|
||
Price history
1 event — show timeline
- 2026-06-09 Listed $269,900 LMLS
Property tax history
+2.3%/yrLatest (2025): $978 · +0.0% YoY. Source: county tax records.
Cash-flow waterfall
monthlySold comps — $/sqft
last 12 mo · ≤1 miLoading sold comps…