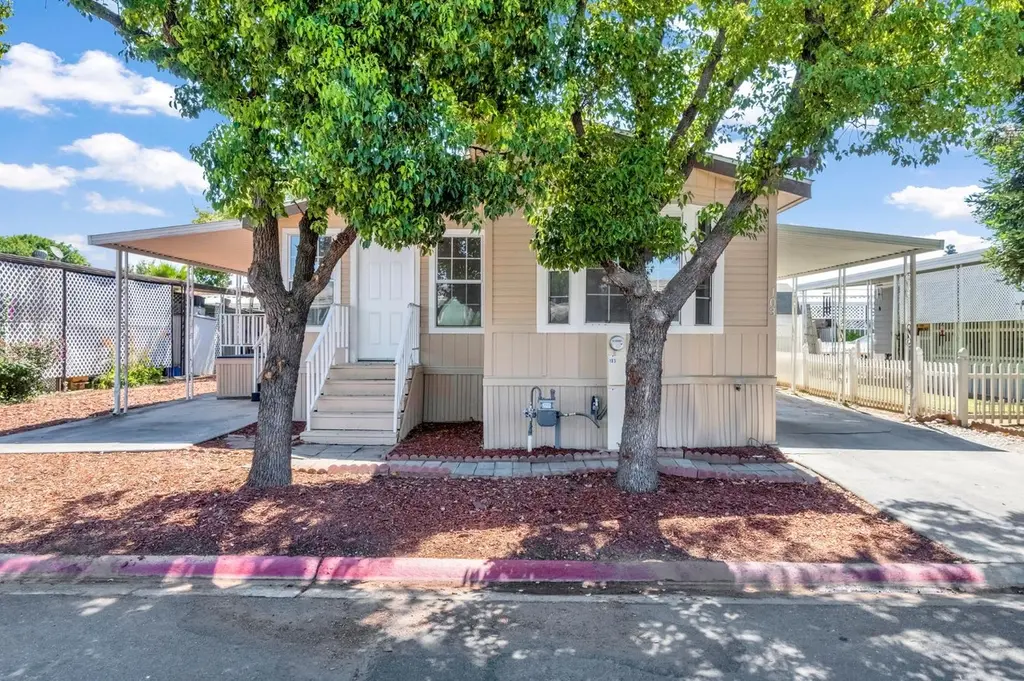
1218 E Cleveland Ave #103 · Madera, CA
Flood risk 8/10 · Major
- FEMA flood zone
- X (unshaded)
- Chance of flooding over 30 yrs
- 0.99%
- Est. flood insurance / yr
- $507 – $1,088
Fire risk 9/10 · Severe
- Est. fire insurance / yr
- $659 – $1,223
Heat risk 8/10 · Major
- Hot days now (above 106°F)
- 6 days/yr
- Hot days in 30 yrs
- 14 days/yr
Wind risk 1/10 · Minimal
- Chance of severe wind over 30 yrs
- —
Air-quality risk 10/10 · Severe
- Unhealthy air days now
- 38 days/yr
- Unhealthy air days in 30 yrs
- 40 days/yr
Risk factors via First Street. Map © Google.
Why this score? — see what drove the B- grade
The composite is a weighted blend of 9 inputs, each scored 0–100. Each bar is that input's sub-score; the figure is the points it added to the 100-point composite (weight × sub-score).
- Cash flow +30.0/30.0
- 1% rule +10.0/10.0
- DSCR +10.0/10.0
- ARV discount +7.5/15.0
- Schools +2.7/10.0
- Livability +2.6/5.0
- Rent growth +2.5/5.0
- Condition / age +2.5/5.0
- Appreciation +0.0/10.0
$97,900
🖨 Deal sheet (PDF) 📄 Offer letter ✓ Due diligence
Listing remarks
Welcome to this beautifully update 3-bedroom, 2-bathroom double-wide mobile home offering 1,280 sq ft of modern living space. Located in a peaceful 55+senior community, this move-in ready home features a spacious open floor plan, updated kitchen and bathrooms, new flooring, fresh paint, and stylish finishes throughout. Enjoy resort-style living amenities including a sparkling pool, clubhouse, and social activities. Conveniently located near shopping and dining, and medical services. Don't miss this rare opportunity for comfort, convenience, and community living.
Key facts
- Fresh paint
- Clubhouse
- New flooring
Tags
Property features AI
Finance
- HOA & community: Community association with clubhouse, pool, and fitness center; Association fee $850 monthly
Exterior
- Utilities: Electric service: on; Public utilities
- Home design: Mobile home; Park space rented
- Construction: Delaware Western mobile home; Wood siding exterior; Composition roof; Wood subfloor foundation
- Exterior features: One-level property; Urban lot setting; Private in-ground pool in the community
Interior
- Bathrooms: 2 bathrooms
- Heating & cooling: Central heat and central air conditioning; Has heating; Has cooling
- Interior features: Inside laundry
- Laundry & utility: Laundry located inside
Neighborhood map
What this means for you Summary
Snapshot
- This is a 3-bed/2.0-bath single-family listed at $98k.
Deal economics
- At list price, monthly cash flow is $318 ($4k/yr) — positive.
- The deal already cash-flows at list — no discount required.
- Meets the 1% rule at list price ($2k rent vs $98k).
- Recommended offer: $95k (3.0% below list) — sets the bar for market timing.
- Cap rate 11.0% vs local median 3.9% in Madera — top-decile yield for the area; either an underpriced asset or a hidden risk that comps aren't pricing in. Stress-test before assuming the spread holds.
Location & tenants
- Location reads 51/100 on livability (#1,053 in CA) — a working-class tenant base; expect higher turnover. Strengths: housing A+; Watch: amenities F, commute F, employment D-.
- Madera Unified (urban): math 22% / reading 35% proficiency, ranked #1,095 of 1,400 in CA (top 78%) — low school quality limits family demand, transient renter base, plan for 1-2y turnover; 75% free/reduced lunch — lower-income household profile, screen leases tightly.
- Zoned schools: Millview Elementary (636 students, 99% FRL); Martin Luther King Jr. Middle (919 students, 97% FRL); Madera South High (1,994 students, 93% FRL) — zoned schools average 96% FRL vs 75% district-wide (21 pts higher); higher-poverty schools than district average — tighter screening recommended.
- Market conditions: 124 active listings in the ZIP; 3 comparable units currently listed for rent nearby; rentals leasing fast (median 13d on market — plan ~1-2 weeks tenant-placement turnaround); 1,346 units permitted in Madera County in 2024 (8 in 5+ unit buildings).
- This rent runs 44% of the median local income ($62k/yr) — at the standard rent-burdened threshold; future hikes will face affordability resistance.
Forward outlook
- Local home prices are declining (-3.0%/yr); year-one equity from $677 of loan paydown is wiped out by about $3k of value loss. Plan a longer hold.
- Madera County population projected at +6% by 2050 — modest demand growth; plan on rents tracking national, not racing it.
- At projected returns (-3.0% appreciation + 3.0% rent growth), your $27k cash investment doubles in ~9 years — after that, you're playing with house money.
Negotiation context
- It's been on market 33 days — a 3% lower offer ($95k) is reasonable based on typical stale-listing flexibility.
- 13 sale attempts with the ask held roughly flat each time — persistent listings suggest the price (not the market) is what's stuck; bring a comps-based counter.
Risks & watch-outs
- Watch-outs: flood insurance adds $66/mo; HOA is 37% of rent.
- Climate carrying-cost: severe flood risk; severe wildfire risk; extreme-heat days projected 6→14/yr by 2055 (HVAC capex compounding) — expect insurance premiums to compound above CPI over the hold.
Questions for the listing agent
- It's been on market 33 days. Have you received any prior offers? Is the seller open to a 3% concession, seller financing, or rate buy-down credit?
- What's the actual annual flood-insurance premium (NFIP or private), and is the property in a SFHA with mandatory coverage?
- What does the HOA fee cover, when was the last increase, and are there any pending special assessments or reserve-fund shortfalls?
- Is there a deadline driving the sale (1031 exchange, divorce, estate, relocation)? That informs how much negotiation room exists.
- Schools are F-rated, which usually means shorter tenancies and higher turnover. Who's the typical renter profile here, and what's been the actual vacancy rate?
- What's the average days-on-market for RENTAL listings here right now (not sales)? A rising rental-DOM trend means longer vacancies and softer asking-rent achievability than the comps imply.
- What's the recent tenant-quality profile in this submarket — average credit score on applications, eviction rate, late-payment / NSF rate, and stable-employment percentage? A property-management company in the area should have these aggregated.
- How much new for-sale + rental construction is in the pipeline within 1–3 miles? Heavy new supply typically softens prices + rents 12–24 months out; constrained supply supports both.
Investment metrics
- 1% rule
- 2.35% ✓
- Cap rate
- 11.01%
- Cash-on-cash
- 16.84%
- DSCR
- 1.75
- GRM
- 3.5
CMA / ARV
- ARV (median comp)
- $293,451
- List price
- $97,900
- Delta
- -66.64%
- Verdict
- UNDERPRICED
- Comps
- 20 within 1.0 mi
Show comp detail 12 sales within ~0.75 mi
| Address | Dist | Beds/Ba | Sqft | Sold | Price | $/sf | Match |
|---|---|---|---|---|---|---|---|
| 1413 Wrenwood Way | 0.46mi | 3/2.0 | 1,376 (+8%) | 4mo | $350,000 | $254 | 63 |
| 901 Bloker St | 0.42mi | 3/2.0 | 1,426 (+11%) | 6mo | $380,000 | $266 | 56 |
| 1451 Segovia Ct | 0.65mi | 4/2.0 (+1) | 1,275 (-0%) | 11mo | $345,000 | $271 | 55 |
| 1505 Fountain Way | 0.50mi | 4/2.0 (+1) | 1,411 (+10%) | 1mo | $372,500 | $264 | 54 |
| 821 Austin Ave | 0.56mi | 3/2.0 | 1,400 (+9%) | 6mo | $294,999 | $211 | 53 |
| 821 Austin Ave | 0.56mi | 3/2.0 | 1,400 (+9%) | 6mo | $294,999 | $211 | 53 |
| 1101 Nebraska Ave | 0.68mi | 3/2.0 | 1,380 (+8%) | 4mo | $347,950 | $252 | 52 |
| 1326 Dellavalle Ave | 0.74mi | 3/1.0 | 1,316 (+3%) | 11mo | $280,000 | $213 | 47 |
| 1326 Dellavalle Ave | 0.75mi | 3/1.0 | 1,316 (+3%) | 11mo | $280,000 | $213 | 47 |
| 1061 Adell St | 0.74mi | 3/2.0 | 1,369 (+7%) | 12mo | $395,000 | $289 | 44 |
| 754 Shasta St | 0.73mi | 3/2.0 | 1,100 (-14%) | 7mo | $378,950 | $345 | 36 |
| 1717 Merced St | 0.70mi | 4/2.0 (+1) | 1,420 (+11%) | 14mo | $353,000 | $249 | 32 |
Match score weights: distance 35% · size 25% · config 20% · recency 20%. Top-matched comps best support the ARV.
Projected returns pro-forma
-3.0% appreciation · 3.0% rent growth · sell at horizon
- IRR
- 4.6%
- Equity multiple
- 1.18×
- Total profit
- $4,943
- Equity at exit
- $14,597
- IRR
- 14.5%
- Equity multiple
- 2.19×
- Total profit
- $32,596
- Equity at exit
- $8,465
Cash invested: $27,412 (down + closing). Projections, not guarantees.
Landlord ↔ Tenant lean methodology
- Overall (STATE)
- 18 Strongly Tenant-Friendly
- State California
- 18 Strongly Tenant-Friendly · D+13
- County
- — inherits STATE
- City
- — inherits STATE
ZIP-level market 93638
- Home prices YoY
- -30.1%
- Active inventory
- 124
- Price-to-rent
- 3.5×
Monthly cashflow live
- Estimated rent
- $2,302 medium interval (Pro) →
- Mortgage (P&I)
- −$513
- Tax from tax record
- −$29 /mo · $352/yr
- Insurance
- −$41
- Flood insurance flood zone
- −$66 /mo · $798/yr
- HOA
- −$850
- Vacancy / Maint / Mgmt
- −$483
- Net cashflow
- $318
Break-even live
Sensitivity live
| Price | -10% $374 | -5% $346 | +0% $318 | +5% $290 | +10% $263 |
|---|---|---|---|---|---|
| Rent | -10% $136 | -5% $227 | +0% $318 | +5% $409 | +10% $500 |
| Rate | -1.0pp $367 | -0.5pp $343 | base $318 | +0.5pp $293 | +1.0pp $267 |
UW: 25.0% down · 7.5% · 30yr · 1.5% tax · 5.0% vac · 8.0% maint · 8.0% mgmt
Financing live
Cash to close
- Down payment
- $24,475
- Closing costs
- $2,937
- Reserves months
- —
- Total cash needed
- —
Loan-product check · same deal, 3 products live
Conventional
25% down · 7.5% · 30yr
- Down + closing
- —
- Monthly P&I
- —
- Monthly cashflow
- —
- DSCR
- —
- Eligible?
- —
Personal DTI + credit; lowest rate.
DSCR
20% down · 8.5% · 30yr
- Down + closing
- —
- Monthly P&I
- —
- Monthly cashflow
- —
- DSCR
- —
- Eligible?
- —
No personal income docs; deal must DSCR.
Hard money
10% down · 12.0% · 12mo
- Down + closing
- —
- Monthly P&I
- —
- Monthly cashflow
- —
- DSCR
- —
- Eligible?
- —
Short-term bridge; refi at stabilization.
Rent comps 3 comps
| Address | Beds | Baths | Sqft | Rent | $/sqft | DOM | Units | Dist |
|---|---|---|---|---|---|---|---|---|
| 1101 Nebraska Ave Madera, CA | 3.0 | 2.0 | 1380 | $2,095 | $1.52 | 13d | 1 | 0.66mi |
| 1243 Bristlecone Dr Madera, CA | 3.0 | 2.0 | 1616 | $2,395 | $1.48 | 13d | 1 | 0.89mi |
| 27848 Ellis St Madera, CA | 3.0 | 2.0 | 1440 | $2,000 | $1.39 | 5d | 1 | 1.11mi |
HOA detail
- Monthly dues
- $850 · $10,200/yr
- Likely covers
- pool
Listing history 34 events
-
2026-05-06historical Pending Accepting Backups 567-char remark
-
2026-04-24$97,900 Active 567-char remark
-
2026-04-24historical
-
2026-04-23price $98,900
-
2026-04-13status Active
-
2026-04-11status Active
-
2026-03-24status Pending Sale
-
2026-03-24historical Pending Accepting Backups
-
2026-02-12$99,900 Active
-
2026-02-01price $99,900
-
2026-01-09historical
-
2026-01-08$109,900 Active
-
2025-11-23price $109,900
-
2025-11-19price $109,900
-
2025-11-17status Active
-
2025-11-17status Active
-
2025-11-02historical Active Under Contract
-
2025-10-25historical Pending Accepting Backups
-
2025-08-30status Active
-
2025-08-30status Active
-
2025-08-24historical Active Under Contract
-
2025-08-24historical Pending Accepting Backups
-
2025-07-11$119,900 Active
-
2025-07-09$119,900 Active
-
2025-04-21soldstatus $50,000 Closed Sale
-
2025-04-21soldstatus $50,000 Closed
-
2025-03-20status Pending Sale
-
2025-03-20status Pending
-
2025-03-15price $60,000
-
2025-03-15price $60,000
-
2025-03-05price $75,000
-
2025-03-05price $75,000
-
2025-01-31$95,000 Active
-
2025-01-31$95,000 Active
ⓘ Source: listings_history table (triggers on properties + properties_extension) + one-shot
backfill from property_details.listing_events for pre-trigger history.
Tax reassessment forecast CA · Resets to sale price
- Current annual tax
- $352 · $29/mo
- Projected year-2 tax
- $744 · $62/mo
- Expected delta
- +$392/yr (+$33/mo · 111.2%)
ⓘ Screening estimate from a state-policy table — verify with the county assessor before closing.
Climate risk First Street
- Flood 8/10 Severe FEMA zone X (unshaded) · 99% chance over 30 yrs
- Wildfire 9/10 Extreme
- Heat 8/10 Severe 6 d/yr ≥106°F today · 14 d/yr by 30 yrs out
- Wind 1/10 Low
- Air quality 10/10 Extreme 38 unhealthy d/yr today · 40 by 30 yrs out
Nearby sold comps map
Loading sold comps map…
Walkable amenities ~0.75 mi
Loading nearby amenities…
Taxation est. · year 1
- Rental income
- $27,618
- − Mortgage interest
- −$5,484
- − Property taxes
- −$352
- − Insurance
- −$1,287
- − Repairs & maintenance
- −$2,209
- − Management
- −$2,209
- − HOA
- −$10,200
- − Depreciation
- −$2,848
- Taxable income
- $3,028
- Est. tax owed @ 24.0%
- −$727
- After-tax cash flow
- $3,092/yr
For passive investors: Depreciation is non-cash, so a rental often shows a tax loss while cash-flowing — sheltering income. Rental losses are passive: they offset passive income freely, and up to $25,000/yr can offset ordinary (W-2) income if you actively participate and your MAGI is under $100k (phasing out to $0 by $150k); unused losses carry forward. On sale, claimed depreciation is recaptured at up to 25%, and gains may owe capital-gains tax (a 1031 exchange can defer both). Figures are a year-1 estimate at your 24.0% rate — not tax advice; consult a CPA.
Schools (NCES district)
- District
- Madera Unified
- NCES district ID
- 0623340
- Math proficiency
- 22% ▬ 0.00%
- Reading proficiency
- 35% ▲ 2.00%
- Median HH income
- $43,446
- Composite
- 27.2/100
- National rank
- #12454
- State rank
- #1095 of 1400 in CA
Livability — Madera
- Score
- 51/100
- State rank
- #1053
- US rank
- #25190
Category grades
Schools grade is shown separately in the Schools card above.
Census & demographics
- Census place
- Madera, CA
- County
- Madera County · 133,170 people
- City population
- 109,650
- Metro
- Madera, CA
- Population (ZIP)
- 50,571
- Household income
- $62,374
- Rent vs Own
- Severe rent burden
- 1707.0
Population outlook (Madera County) Hauer SSP2
- Today (2025)
- 157,915 people
- By 2030
- 159,604 · +1.1%
- By 2040
- 163,454 · +3.5%
- By 2050
- 167,071 · +5.8%
- By 2075
- 171,182 · +8.4%
- By 2100
- 162,781 · +3.1%
Race, ethnicity, and origin ACS 2023
- Neighborhood character
- Predominantly Hispanic (83%)
- Race & ethnicity
- Hispanic / Latino 83% Two or more races 22% White 11% Asian 2% Black 2% Native American 1%
- Hispanic origin (detail)
- Mexican 80%
- Common ancestry
- Lithuanian 1%
- Foreign-born
- 32% · Canada
- Languages at home
- 29% English-only · Spanish 69% Other Indo-European 2%
Political lean MEDSL · Madera
- 2024 margin
- Strong R (+20.8) · D 38.4% · R 59.2% · Other 2.4%
- 2008→2024 swing
- -7.5pp toward R · 2008: -13.3pp · 2024: -20.8pp
- All cycles
- 2024: R+20.8 2020: R+11.6 2016: R+17.3 2012: R+19.4 2008: R+13.3
Not yet ingested
- Civics
- —
Market trends
- HPI YoY
- ▼ -197.33%
- Current HPI
- 458.5577
- Rent YoY
- —
- Metro
- Madera, CA
- State GDP YoY
- ▲ 3.21%
- F500 in state
- 116
Industry mix (Fortune 500 HQ in CA)
| Industry | F500 HQs | Revenue |
|---|---|---|
| Technology | 27 | $1,492B |
|
||
| Financial Services | 3 | $174B |
|
||
| Retail | 3 | $44B |
|
||
| Insurance | 3 | $26B |
|
||
| Media / Entertainment | 2 | $115B |
|
||
| Pharmaceuticals / Biotech | 2 | $62B |
|
||
Price history
+3.1% since first listed36 events — show timeline
- 2026-06-12 Sold (MLS) $97,900 FRESNOMLS
- 2026-05-27 Pending — FRESNOMLS
- 2026-05-06 Contingent — FRESNOMLS
- 2026-04-24 Listing Removed — CRMLS
- 2026-04-24 Listed $97,900 FRESNOMLS
- 2026-04-23 Price Changed $98,900 CRMLS
- 2026-04-13 Relisted — FRESNOMLS
- 2026-04-11 Relisted — CRMLS
- 2026-03-24 Pending — CRMLS
- 2026-03-24 Contingent — FRESNOMLS
- 2026-02-12 Listed $99,900 CRMLS
- 2026-02-01 Price Changed $99,900 FRESNOMLS
- 2026-01-09 Listing Removed — CRMLS
- 2026-01-08 Listed $109,900 FRESNOMLS
- 2025-11-23 Price Changed $109,900 CRMLS
- 2025-11-19 Price Changed $109,900 FRESNOMLS
- 2025-11-17 Relisted — CRMLS
- 2025-11-17 Relisted — FRESNOMLS
- 2025-11-02 Contingent — CRMLS
- 2025-10-25 Contingent — FRESNOMLS
- 2025-08-30 Relisted — CRMLS
- 2025-08-30 Relisted — FRESNOMLS
- 2025-08-24 Contingent — CRMLS
- 2025-08-24 Contingent — FRESNOMLS
- 2025-07-11 Listed $119,900 CRMLS
- 2025-07-09 Listed $119,900 FRESNOMLS
- 2025-04-21 Sold (MLS) $50,000 FRESNOMLS
- 2025-04-21 Sold (MLS) $50,000 CRMLS
- 2025-03-20 Pending — CRMLS
- 2025-03-20 Pending — FRESNOMLS
- 2025-03-15 Price Changed $60,000 CRMLS
- 2025-03-15 Price Changed $60,000 FRESNOMLS
- 2025-03-05 Price Changed $75,000 CRMLS
- 2025-03-05 Price Changed $75,000 FRESNOMLS
- 2025-01-31 Listed $95,000 FRESNOMLS
- 2025-01-31 Listed $95,000 CRMLS
Property tax history
+8.6%/yrLatest (2017): $352 · -2.9% YoY. Source: county tax records.
Cash-flow waterfall
monthlySold comps — $/sqft
last 12 mo · ≤1 miLoading sold comps…