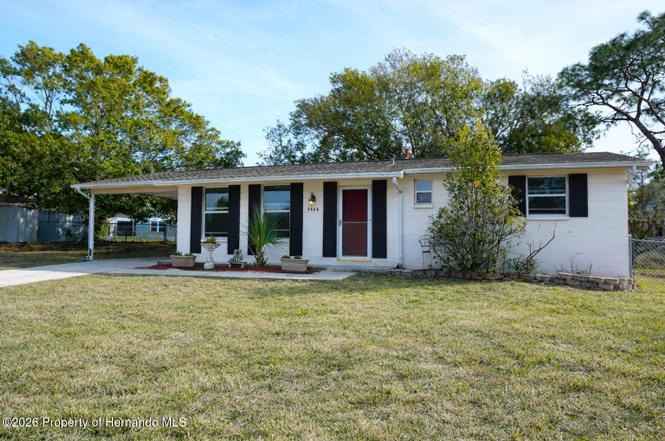
9466 Midway St · Spring Hill, FL
Flood risk 1/10 · Minimal
- FEMA flood zone
- X (unshaded)
- Chance of flooding over 30 yrs
- 0.0%
- Est. flood insurance / yr
- $507 – $1,088
Fire risk 4/10 · Minor
- Est. fire insurance / yr
- $947 – $1,759
Heat risk 10/10 · Severe
- Hot days now (above 110°F)
- 7 days/yr
- Hot days in 30 yrs
- 25 days/yr
Wind risk 10/10 · Severe
- Chance of severe wind over 30 yrs
- 99.0%
Air-quality risk 3/10 · Minor
- Unhealthy air days now
- 1 days/yr
- Unhealthy air days in 30 yrs
- 4 days/yr
Risk factors via First Street. Map © Google.
Why this score? — see what drove the D grade
The composite is a weighted blend of 9 inputs, each scored 0–100. Each bar is that input's sub-score; the figure is the points it added to the 100-point composite (weight × sub-score).
- Cash flow +14.3/30.0
- ARV discount +10.1/15.0
- DSCR +4.3/10.0
- Schools +4.2/10.0
- Livability +3.2/5.0
- 1% rule +3.1/10.0
- Condition / age +2.5/5.0
- Rent growth +2.3/5.0
- Appreciation +0.0/10.0
$190,000
🖨 Deal sheet (PDF) 📄 Offer letter ✓ Due diligence
Listing remarks MLS
active with contract - Convenient Location, Only about 10 minutes from the Beautiful Weeki Wachee River and Gulf of Mexico, Fenced Rear Yard, Treed Lot, 2018 Roof, 2007 HVAC, Neutral Tones, Tile / Laminate Flooring, Nice Kitchen Area with Updated Cabinets / Counter Space, Remaining Appliances, Updated Windows, Updated Bathrooms, Extra Attic Insulation for Reduced Utility Costs, Very Clean / Neat and Ready to Just Move In!
Key facts
- Spacious yard
- Near dining
- Near us19 shopping
Tags
Property features AI
Exterior
- Parking: Attached carport; 1 carport space
- Utilities: Public water; Public sewer; Electricity connected; Water connected; Sewer connected; Cable connected
- Home design: Single-family residence; Residential property; Single story (implied by property subtype)
- Construction: Block construction; Shingle roof
- Exterior features: Rear screened porch; Few trees on lot
Interior
- Kitchen: Electric cooktop; Electric range; Dishwasher; Microwave; Refrigerator
- Bathrooms: 2 full bathrooms
- Heating & cooling: Central heating; Central air conditioning
- Interior features: Dryer; Dishwasher; Electric cooktop; Electric range; Electric water heater; Microwave; Refrigerator; Washer
- Laundry & utility: Washer and dryer; Electric water heater
Neighborhood map
What this means for you Summary
Snapshot
- This is a 2-bed/2.0-bath single-family listed at $190k.
Deal economics
- At list price, monthly cash flow is $34 ($410/yr) — positive.
- The deal already cash-flows at list — no discount required.
- To meet the 1% rule (rent ≥ 1% of price), the offer needs to be $154k (18.9% below list).
- Recommended offer: $154k (18.9% below list) — sets the bar for 1% rule.
- Cap rate 6.5% vs local median 4.4% in Spring Hill — top-decile yield for the area; either an underpriced asset or a hidden risk that comps aren't pricing in. Stress-test before assuming the spread holds.
Location & tenants
- Location reads 63/100 on livability (#738 in FL) — a middle-class / working-renter tenant base. Strengths: cost of living A+, housing A+; Watch: health & safety C-, employment D+, amenities F.
- Hernando (suburban): math 50% / reading 50% proficiency, ranked #38 of 73 in FL (top 52%) — acceptable for families but not a draw, mixed tenant base, ~2y average lease.
- Zoned schools: Explorer K-8 (math 40% / reading 41%, grade F, #1,471 of 2,144 statewide, top 69%, 1,617 students, 69% FRL); Frank W. Springstead High School (math 45% / reading 55%, grade D+, #175 of 667 statewide, top 27%, 1,896 students, 49% FRL) — zoned schools at 59% FRL track the district average.
- Market conditions: Rents soft (-0.7%/yr); 389 active listings in the ZIP; 23 comparable units currently listed for rent nearby; rentals at typical pace (median 26d on market — plan ~3-4 weeks tenant-placement turnaround); 2,505 units permitted in Hernando County in 2024 (318 in 5+ unit buildings).
Forward outlook
- Local home prices are declining (-3.0%/yr); year-one equity from $1k of loan paydown is wiped out by about $6k of value loss. Plan a longer hold.
- Hernando County population projected at +11% by 2050 — modest demand growth; plan on rents tracking national, not racing it.
Negotiation context
- It's been on market 50 days — a 3% lower offer ($184k) is reasonable based on typical stale-listing flexibility.
- 5 sale attempts since 23y ago with the ask held roughly flat each time — persistent listings suggest the price (not the market) is what's stuck; bring a comps-based counter.
- Current owner paid $126k; list at $190k implies a 51% gain — meaningful room to come down on a strong offer.
Risks & watch-outs
- Climate carrying-cost: severe wind risk, 99% chance of damaging wind over 30y; extreme-heat days projected 7→25/yr by 2055 (HVAC capex compounding) — expect insurance premiums to compound above CPI over the hold.
Questions for the listing agent
- It's been on market 50 days. Have you received any prior offers? Is the seller open to a 19% concession, seller financing, or rate buy-down credit?
- Built in 1976 — when were the roof, HVAC, electrical panel, plumbing, and water heater last replaced?
- Is there a deadline driving the sale (1031 exchange, divorce, estate, relocation)? That informs how much negotiation room exists.
- The area grade is low — what's the realistic commute time and amenity access for the typical tenant pool here? Any planned neighborhood developments (good or bad) we should know about?
- What's the average days-on-market for RENTAL listings here right now (not sales)? A rising rental-DOM trend means longer vacancies and softer asking-rent achievability than the comps imply.
- What's the recent tenant-quality profile in this submarket — average credit score on applications, eviction rate, late-payment / NSF rate, and stable-employment percentage? A property-management company in the area should have these aggregated.
- How much new for-sale + rental construction is in the pipeline within 1–3 miles? Heavy new supply typically softens prices + rents 12–24 months out; constrained supply supports both.
Investment metrics
- 1% rule
- 0.81% ✗
- Cap rate
- 6.51%
- Cash-on-cash
- 0.77%
- DSCR
- 1.03
- GRM
- 10.3
CMA / ARV
- ARV (on-the-fly)
- $201,520
- Comps found
- 12
Show comp detail 12 sales within ~0.75 mi
| Address | Dist | Beds/Ba | Sqft | Sold | Price | $/sf | Match |
|---|---|---|---|---|---|---|---|
| 9635 Century Dr | 0.09mi | 2/1.5 | 880 (0%) | 9mo | $225,000 | $256 | 86 |
| 9367 Midway St | 0.20mi | 2/1.0 | 880 (0%) | 5mo | $170,000 | $193 | 83 |
| 9420 Midway St | 0.10mi | 2/1.5 | 924 (+5%) | 7mo | $190,000 | $206 | 79 |
| 5100 Mentmore Ave | 0.49mi | 2/2.0 | 903 (+3%) | 7mo | $245,000 | $271 | 67 |
| 4581 Deltona Blvd | 0.27mi | 2/1.5 | 943 (+7%) | 11mo | $144,000 | $153 | 65 |
| 9248 Chase St | 0.55mi | 2/1.0 | 864 (-2%) | 5mo | $182,000 | $211 | 63 |
| 9513 Lakeview Ct | 0.29mi | 3/1.0 (+1) | 924 (+5%) | 8mo | $158,000 | $171 | 63 |
| 9384 Midway St | 0.17mi | 2/1.0 | 960 (+9%) | 13mo | $219,900 | $229 | 62 |
| 9430 Chase St | 0.22mi | 3/1.0 (+1) | 924 (+5%) | 14mo | $110,000 | $119 | 61 |
| 4336 Pallas Ave | 0.19mi | 3/2.0 (+1) | 981 (+12%) | 13mo | $293,000 | $299 | 56 |
| 9326 Bay Dr | 0.69mi | 2/1.5 | 943 (+7%) | 3mo | $222,500 | $236 | 52 |
| 9238 Century Dr | 0.63mi | 3/1.0 (+1) | 924 (+5%) | 13mo | $219,900 | $238 | 42 |
Match score weights: distance 35% · size 25% · config 20% · recency 20%. Top-matched comps best support the ARV.
Projected returns pro-forma
-3.0% appreciation · 0.0% rent growth · sell at horizon
- IRR
- -18.2%
- Equity multiple
- 0.38×
- Total profit
- $-33,187
- Equity at exit
- $28,330
- IRR
- -17.0%
- Equity multiple
- 0.18×
- Total profit
- $-43,787
- Equity at exit
- $16,428
Cash invested: $53,200 (down + closing). Projections, not guarantees.
Landlord ↔ Tenant lean methodology
- Overall (STATE)
- 87 Strongly Landlord-Friendly
- State Florida
- 87 Strongly Landlord-Friendly · R+3
- County
- — inherits STATE
- City
- — inherits STATE
ZIP-level market 34608
- Home prices YoY
- -24.7%
- Rents YoY
- -0.7%
- Active inventory
- 389
- Price-to-rent
- 10.3×
Monthly cashflow live
- Estimated rent
- $1,542 high interval (Pro) →
- Mortgage (P&I)
- −$996
- Tax from tax record
- −$108 /mo · $1,300/yr
- Insurance
- −$79
- HOA
- −$0
- Vacancy / Maint / Mgmt
- −$324
- Net cashflow
- $34
Break-even live
Sensitivity live
| Price | -10% $142 | -5% $88 | +0% $34 | +5% $-20 | +10% $-73 |
|---|---|---|---|---|---|
| Rent | -10% $-88 | -5% $-27 | +0% $34 | +5% $95 | +10% $156 |
| Rate | -1.0pp $130 | -0.5pp $82 | base $34 | +0.5pp $-15 | +1.0pp $-65 |
UW: 25.0% down · 7.5% · 30yr · 1.5% tax · 5.0% vac · 8.0% maint · 8.0% mgmt
Financing live
Cash to close
- Down payment
- $47,500
- Closing costs
- $5,700
- Reserves months
- —
- Total cash needed
- —
Loan-product check · same deal, 3 products live
Conventional
25% down · 7.5% · 30yr
- Down + closing
- —
- Monthly P&I
- —
- Monthly cashflow
- —
- DSCR
- —
- Eligible?
- —
Personal DTI + credit; lowest rate.
DSCR
20% down · 8.5% · 30yr
- Down + closing
- —
- Monthly P&I
- —
- Monthly cashflow
- —
- DSCR
- —
- Eligible?
- —
No personal income docs; deal must DSCR.
Hard money
10% down · 12.0% · 12mo
- Down + closing
- —
- Monthly P&I
- —
- Monthly cashflow
- —
- DSCR
- —
- Eligible?
- —
Short-term bridge; refi at stabilization.
Rent comps 23 comps
| Address | Beds | Baths | Sqft | Rent | $/sqft | DOM | Units | Dist |
|---|---|---|---|---|---|---|---|---|
| 4470 Cynthia Ln Spring Hill, FL | 2.0 | 1.0 | 1016 | $1,400 | $1.38 | 22d | 1 | 0.50mi |
| 4353 Azora Rd Spring Hill, FL | 2.0 | 2.0 | 979 | $1,650 | $1.69 | 26d | 1 | 0.51mi |
| 4283 Azora Rd Spring Hill, FL | 3.0 | 2.0 | 1110 | $1,600 | $1.44 | 26d | 1 | 0.54mi |
| 2634 Landover Blvd Spring Hill, FL | 2.0 | 2.0 | 1021 | $1,250 | $1.22 | 19d | 1 | 0.66mi |
| 4400 Millwood Rd Unit E Spring Hill, FL | 2.0 | 1.5 | 864 | $1,250 | $1.45 | 26d | 1 | 0.74mi |
| 4225 Jason Rd Spring Hill, FL | 2.0 | 1.0 | 804 | $1,300 | $1.62 | 26d | 1 | 0.78mi |
| 4208 Jason Rd Spring Hill, FL | 2.0 | 2.0 | 1038 | $1,500 | $1.45 | 26d | 1 | 0.78mi |
| 4243 Jason Rd Spring Hill, FL | 2.0 | 1.0 | 804 | $1,300 | $1.62 | 26d | 1 | 0.79mi |
| 4247 Jason Rd Spring Hill, FL | 2.0 | 1.0 | 804 | $1,300 | $1.62 | 12d | 1 | 0.80mi |
| 4224 Portillo Rd Spring Hill, FL | 2.0 | 2.0 | 1100 | $1,462 | $1.33 | 1d | 2 | 0.85mi |
| 10313 Walton St Spring Hill, FL | 2.0 | 1.5 | 1000 | $1,550 | $1.55 | 19d | 1 | 0.87mi |
| 10315 Walton St Spring Hill, FL | 2.0 | 1.5 | 1000 | $1,650 | $1.65 | 19d | 1 | 0.89mi |
| 2789 Landover Blvd Spring Hill, FL | 2.0 | 1.0 | 824 | $1,300 | $1.58 | 26d | 1 | 0.93mi |
| 10337 Usher St Spring Hill, FL | 2.0 | 1.0 | 1009 | $1,475 | $1.46 | 26d | 1 | 0.95mi |
| 4253 Central Park Dr Spring Hill, FL | 2.0–3.0 | 2.0 | 1107 | $1,445 | $1.31 | 3d | 8 | 1.06mi |
| 4028 Portillo Rd Spring Hill, FL | 2.0 | 2.0 | 1032 | $1,475 | $1.43 | 4d | 1 | 1.06mi |
| 10322 Gracelyn DR Spring Hill, FL | 1.0–3.0 | 1.0–2.5 | 1206 | $1,975 | $1.64 | 0d | 42 | 1.07mi |
| 3544 Portillo Rd Spring Hill, FL | 2.0 | 1.0 | 850 | $1,275 | $1.50 | 26d | 1 | 1.24mi |
| 3535 Portillo Rd Apt 56 Spring Hill, FL | 2.0 | 2.0 | 1000 | $1,395 | $1.40 | 26d | 1 | 1.26mi |
| 10490 Chalmer St Apt 3 Spring Hill, FL | 2.0 | 2.0 | 1050 | $1,550 | $1.48 | 26d | 1 | 1.27mi |
| 3535 Portillo Rd Unit 40 Spring Hill, FL | 2.0 | 2.0 | 1000 | $1,379 | $1.38 | 25d | 1 | 1.28mi |
| 3535 Portillo Rd Unit 40 Spring Hill, FL | 2.0 | 2.0 | 1000 | $1,379 | $1.38 | 23d | 1 | 1.28mi |
| 11201 Kangley Ln Spring Hill, FL | 2.0 | 2.0 | 1105 | $1,695 | $1.53 | 6d | 1 | 1.49mi |
Listing history 13 events
-
2026-05-13status Pending
-
2026-05-03price $190,000
-
2026-04-08status Active
-
2026-03-08status Pending
-
2026-02-21$195,000 Active
-
2020-11-20soldstatus $126,000 425-char remark
Show marketing remark (425 chars)
active with contract - Convenient Location, Only about 10 minutes from the Beautiful Weeki Wachee River and Gulf of Mexico, Fenced Rear Yard, Treed Lot, 2018 Roof, 2007 HVAC, Neutral Tones, Tile / Laminate Flooring, Nice Kitchen Area with Updated Cabinets / Counter Space, Remaining Appliances, Updated Windows, Updated Bathrooms, Extra Attic Insulation for Reduced Utility Costs, Very Clean / Neat and Ready to Just Move In!
-
2020-10-09$129,900 425-char remark
Show marketing remark (425 chars)
active with contract - Convenient Location, Only about 10 minutes from the Beautiful Weeki Wachee River and Gulf of Mexico, Fenced Rear Yard, Treed Lot, 2018 Roof, 2007 HVAC, Neutral Tones, Tile / Laminate Flooring, Nice Kitchen Area with Updated Cabinets / Counter Space, Remaining Appliances, Updated Windows, Updated Bathrooms, Extra Attic Insulation for Reduced Utility Costs, Very Clean / Neat and Ready to Just Move In!
-
2003-03-11soldstatus $53,500
-
2003-03-10soldstatus $53,500
-
2003-03-03$55,900
-
1991-05-01soldstatus $30,000
ⓘ Source: listings_history table (triggers on properties + properties_extension) + one-shot
backfill from property_details.listing_events for pre-trigger history.
Tax reassessment forecast FL · Resets to sale price
- Current annual tax
- $1,300 · $108/mo
- Projected year-2 tax
- $1,577 · $131/mo
- Expected delta
- +$277/yr (+$23/mo · 21.3%)
ⓘ Screening estimate from a state-policy table — verify with the county assessor before closing.
Climate risk First Street
- Flood 1/10 Low FEMA zone X (unshaded) · 0% chance over 30 yrs
- Wildfire 4/10 Moderate
- Heat 10/10 Extreme 7 d/yr ≥110°F today · 25 d/yr by 30 yrs out
- Wind 10/10 Extreme 99% chance of damaging wind over 30 yrs
- Air quality 3/10 Moderate 1 unhealthy d/yr today · 4 by 30 yrs out
Nearby sold comps map
Loading sold comps map…
Walkable amenities ~0.75 mi
Loading nearby amenities…
Taxation est. · year 1
- Rental income
- $18,501
- − Mortgage interest
- −$10,643
- − Property taxes
- −$1,300
- − Insurance
- −$950
- − Repairs & maintenance
- −$1,480
- − Management
- −$1,480
- − Depreciation
- −$5,527
- Taxable loss
- −$2,879
- Est. tax savings @ 24.0%
- +$691
- After-tax cash flow
- $1,101/yr
For passive investors: Depreciation is non-cash, so a rental often shows a tax loss while cash-flowing — sheltering income. Rental losses are passive: they offset passive income freely, and up to $25,000/yr can offset ordinary (W-2) income if you actively participate and your MAGI is under $100k (phasing out to $0 by $150k); unused losses carry forward. On sale, claimed depreciation is recaptured at up to 25%, and gains may owe capital-gains tax (a 1031 exchange can defer both). Figures are a year-1 estimate at your 24.0% rate — not tax advice; consult a CPA.
Schools (NCES district)
- District
- Hernando
- NCES district ID
- 1200810
- Math proficiency
- 50% ▼ -8.00%
- Reading proficiency
- 50% ▼ -4.00%
- Median HH income
- $41,985
- Composite
- 42.03/100
- National rank
- #3329
- State rank
- #38 of 73 in FL
Livability — Spring Hill
- Score
- 63/100
- State rank
- #738
- US rank
- #15937
Category grades
Schools grade is shown separately in the Schools card above.
Census & demographics
- Census place
- Spring Hill, FL
- County
- Hernando County · 169,677 people
- City population
- 83,915
- Metro
- Tampa-St. Petersburg-Clearwater, FL
- Population (ZIP)
- 36,658
- Household income
- $64,345
- Rent vs Own
- Severe rent burden
- 647.0
Population outlook (Hernando County) Hauer SSP2
- Today (2025)
- 189,218 people
- By 2030
- 194,367 · +2.7%
- By 2040
- 203,398 · +7.5%
- By 2050
- 209,589 · +10.8%
- By 2075
- 218,452 · +15.4%
- By 2100
- 205,923 · +8.8%
Race, ethnicity, and origin ACS 2023
- Neighborhood character
- Predominantly White (71%)
- Race & ethnicity
- White 71% Hispanic / Latino 18% Two or more races 11% Black 4% Asian 2%
- Hispanic origin (detail)
- Puerto Rican 9% Cuban 3%
- Common ancestry
- Slovak 4% Romanian 3% Lithuanian 3%
- Foreign-born
- 9% · Canada, Jamaica, China
- Languages at home
- 87% English-only · Spanish 9% Other Indo-European 2% French/Haitian/Cajun 1%
Political lean MEDSL · Hernando
- 2024 margin
- Solid R (+37.0) · D 31.1% · R 68.2%
- 2008→2024 swing
- -33.5pp toward R · 2008: -3.6pp · 2024: -37.0pp
- All cycles
- 2024: R+37.0 2020: R+30.2 2016: R+29.0 2012: R+8.5 2008: R+3.6
Not yet ingested
- Civics
- —
Market trends
- HPI YoY
- ▼ -99.94%
- Current HPI
- 305.1933
- Rent YoY
- ▼ -0.68%
- Metro
- Tampa-St. Petersburg-Clearwater, FL
- State GDP YoY
- ▲ 3.28%
- F500 in state
- 36
Industry mix (Fortune 500 HQ in FL)
| Industry | F500 HQs | Revenue |
|---|---|---|
| Industrial Technology | 2 | $29B |
|
||
| Insurance | 2 | $17B |
|
||
| Retail | 1 | $60B |
|
||
| Technology Distribution | 1 | $58B |
|
||
| Homebuilding | 1 | $35B |
|
||
| Technology Manufacturing | 1 | $35B |
|
||
Price history
+533.3% since first listed13 events — show timeline
- 2026-05-13 Pending — HCAR
- 2026-05-03 Price Changed $190,000 HCAR
- 2026-04-08 Relisted — HCAR
- 2026-03-08 Pending — HCAR
- 2026-02-21 Listed $195,000 HCAR
- 2020-11-20 Sold (MLS) $126,000 St. Augustine and St. Johns County Board of REALTORS®
- 2020-11-20 Sold (MLS) $126,000 HCAR
- 2020-10-09 Listed $129,900 St. Augustine and St. Johns County Board of REALTORS®
- 2020-10-09 Listed $129,900 HCAR
- 2003-03-11 Sold (Public Records) $53,500 Public Records
- 2003-03-10 Sold (MLS) $53,500 HCAR
- 2003-03-03 Listed $55,900 HCAR
- 1991-05-01 Sold (Public Records) $30,000 Public Records
Property tax history
+11.9%/yrLatest (2025): $1,300 · +1.7% YoY. Source: county tax records.
Cash-flow waterfall
monthlySold comps — $/sqft
last 12 mo · ≤1 miLoading sold comps…