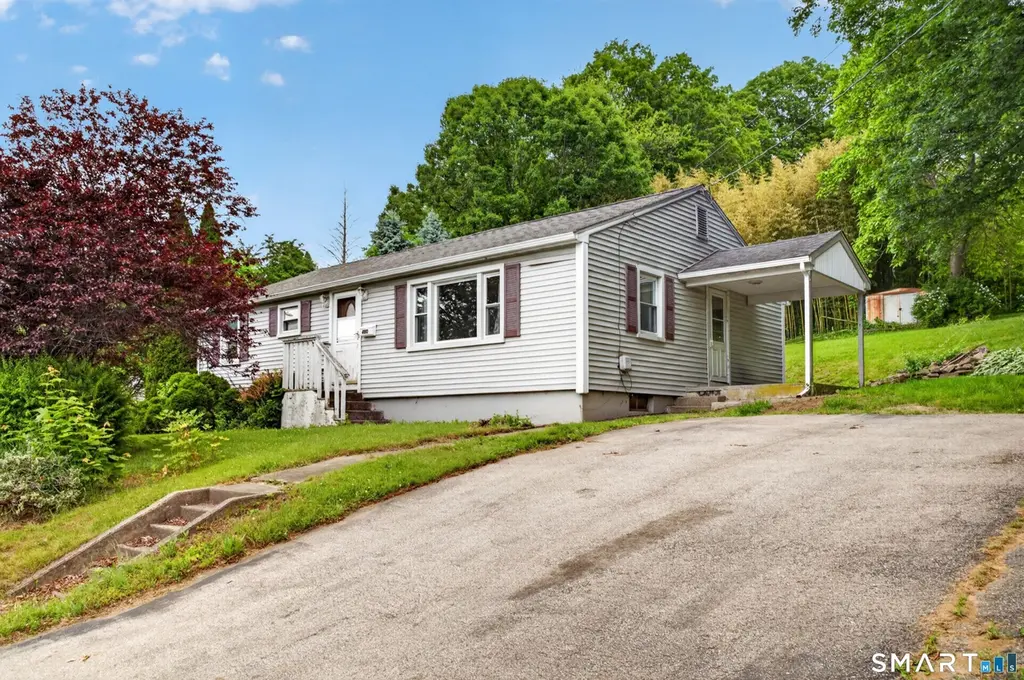
480 New London Tpke · Norwich, CT
Flood risk 1/10 · Minimal
- FEMA flood zone
- X (unshaded)
- Chance of flooding over 30 yrs
- 0.0%
- Est. flood insurance / yr
- $473 – $860
Fire risk 1/10 · Minimal
- Est. fire insurance / yr
- $829 – $1,539
Heat risk 5/10 · Moderate
- Hot days now (above 96°F)
- 7 days/yr
- Hot days in 30 yrs
- 16 days/yr
Wind risk 6/10 · Moderate
- Chance of severe wind over 30 yrs
- 64.0%
Air-quality risk 3/10 · Minor
- Unhealthy air days now
- 2 days/yr
- Unhealthy air days in 30 yrs
- 3 days/yr
Risk factors via First Street. Map © Google.
Why this score? — see what drove the C- grade
The composite is a weighted blend of 9 inputs, each scored 0–100. Each bar is that input's sub-score; the figure is the points it added to the 100-point composite (weight × sub-score).
- ARV discount +15.0/15.0
- Cash flow +13.9/30.0
- DSCR +4.2/10.0
- Rent growth +4.2/5.0
- 1% rule +4.1/10.0
- Livability +4.0/5.0
- Condition / age +2.5/5.0
- Schools +2.1/10.0
- Appreciation +0.0/10.0
$215,000
🖨 Deal sheet (PDF) 📄 Offer letter ✓ Due diligence
Listing remarks MLS
BACK ON THE MARKET. Price has been approved by the bank for the short sale. Quick close. Nice ranch with only cosmetic work needed. Great opportunity for sweat equity even if you are not handy.
Key facts
- 0.32 acre lot
- Built 1957
- Listed 5 days
Property features AI
Exterior
- Utilities: Public water connected; Public sewer connected; Electric service
- Home design: Single-family home
- Construction: Frame construction; Concrete foundation; Asphalt shingle roof
- Exterior features: Sloping lot; Vinyl siding
Interior
- Kitchen: Oven/Range; Refrigerator
- Bedrooms: 3 bedrooms
- Bathrooms: 1 full bathroom
- Heating & cooling: Hot water heating; Window air conditioning unit
- Interior features: Full basement
- Laundry & utility: 80-gallon electric hot water (also listed as tankless); Oil-fired hot water/heat with fuel tank located in basement
Neighborhood map
What this means for you Summary
Snapshot
- This is a 3-bed/1.0-bath single-family listed at $215k.
Deal economics
- At list price, monthly cash flow is $26 ($307/yr) — positive.
- The deal already cash-flows at list — no discount required.
- To meet the 1% rule (rent ≥ 1% of price), the offer needs to be $196k (8.9% below list).
- Recommended offer: $196k (8.9% below list) — sets the bar for 1% rule.
- Cap rate 6.4% vs local median 4.1% in Norwich — top-decile yield for the area; either an underpriced asset or a hidden risk that comps aren't pricing in. Stress-test before assuming the spread holds.
Location & tenants
- Location reads 81/100 on livability (#18 in CT, #1,391 nationally) — a professional / high-income tenant draw. Strengths: housing A+, health & safety A+, commute A-.
- Norwich School District (urban): math 19% / reading 29% proficiency, ranked #139 of 153 in CT (top 91%) — low school quality limits family demand, transient renter base, plan for 1-2y turnover; 62% free/reduced lunch — lower-income household profile, screen leases tightly.
- Zoned schools: John B. Stanton School (math 17% / reading 22%, grade F, #447 of 553 statewide, top 82%, 377 students, 71% FRL); Kelly Steam Magnet Middle School (math 15% / reading 32%, grade F, #156 of 175 statewide, top 90%, 556 students, 72% FRL).
- Market conditions: Rents rising fast (+6.6%/yr); 243 active listings in the ZIP; 6 comparable units currently listed for rent nearby; rentals at typical pace (median 23d on market — plan ~3-4 weeks tenant-placement turnaround); 487 units permitted in Southeastern Connecticut Planning Region in 2024 (244 in 5+ unit buildings).
- This rent runs 36% of the median local income ($66k/yr) — at the standard rent-burdened threshold; future hikes will face affordability resistance.
Forward outlook
- Local home prices are declining (-3.0%/yr); year-one equity from $1k of loan paydown is wiped out by about $6k of value loss. Plan a longer hold.
Negotiation context
- Only 5 days on market — expect competitive offers; lowballing is unlikely to land.
- 3 sale attempts since 16y ago; this cycle's ask is 177% above the opening price — seller raised mid-cycle; expect resistance to lowballs.
- Current owner paid $78k; list at $215k implies a 177% gain — meaningful room to come down on a strong offer.
Risks & watch-outs
- Watch-outs: built in 1957 — expect roof / HVAC / electrical / plumbing capex.
- Climate carrying-cost: major wind risk, 64% chance of damaging wind over 30y; extreme-heat days projected 7→16/yr by 2055 (HVAC capex compounding) — expect insurance premiums to compound above CPI over the hold.
Questions for the listing agent
- Built in 1957 — when were the roof, HVAC, electrical panel, plumbing, and water heater last replaced?
- Is there a deadline driving the sale (1031 exchange, divorce, estate, relocation)? That informs how much negotiation room exists.
- Schools are D-rated, which usually means shorter tenancies and higher turnover. Who's the typical renter profile here, and what's been the actual vacancy rate?
- What's the average days-on-market for RENTAL listings here right now (not sales)? A rising rental-DOM trend means longer vacancies and softer asking-rent achievability than the comps imply.
- What's the recent tenant-quality profile in this submarket — average credit score on applications, eviction rate, late-payment / NSF rate, and stable-employment percentage? A property-management company in the area should have these aggregated.
- How much new for-sale + rental construction is in the pipeline within 1–3 miles? Heavy new supply typically softens prices + rents 12–24 months out; constrained supply supports both.
Investment metrics
- 1% rule
- 0.91% ✗
- Cap rate
- 6.44%
- Cash-on-cash
- 0.51%
- DSCR
- 1.02
- GRM
- 9.1
CMA / ARV
- ARV (on-the-fly)
- $312,816
- Comps found
- 12
Show comp detail 12 sales within ~0.75 mi
| Address | Dist | Beds/Ba | Sqft | Sold | Price | $/sf | Match |
|---|---|---|---|---|---|---|---|
| 520 New London Tpke | 0.20mi | 3/1.0 | 1,158 (-2%) | 7mo | $307,500 | $266 | 82 |
| 7 Deerbrook Rd | 0.35mi | 3/1.0 | 1,162 (-1%) | 3mo | $325,000 | $280 | 79 |
| 9 Deerbrook Rd | 0.37mi | 3/1.5 | 1,293 (+10%) | 1mo | $300,000 | $232 | 64 |
| 18 Pine St | 0.35mi | 2/1.5 (-1) | 1,080 (-8%) | 2mo | $269,900 | $250 | 62 |
| 35 Surrey Ln | 0.38mi | 3/1.0 | 1,108 (-6%) | 14mo | $330,000 | $298 | 61 |
| 47 Manwaring Rd | 0.51mi | 2/1.0 (-1) | 1,157 (-2%) | 10mo | $270,000 | $233 | 60 |
| 27 Sycamore Rd | 0.28mi | 3/1.5 | 1,326 (+13%) | 5mo | $235,500 | $178 | 59 |
| 15 West Ave | 0.65mi | 3/1.5 | 1,170 (-0%) | 11mo | $325,000 | $278 | 58 |
| 24 East Ave | 0.66mi | 2/1.0 (-1) | 1,210 (+3%) | 4mo | $219,000 | $181 | 56 |
| 8 Pine St | 0.39mi | 3/2.5 | 1,350 (+15%) | 0mo | $390,000 | $289 | 51 |
| 14 Fairground Cir | 0.48mi | 3/1.0 | 1,040 (-12%) | 10mo | $315,000 | $303 | 50 |
| 3 Nordon Ave | 0.58mi | 3/1.0 | 1,296 (+10%) | 9mo | $315,000 | $243 | 49 |
Match score weights: distance 35% · size 25% · config 20% · recency 20%. Top-matched comps best support the ARV.
Projected returns pro-forma
-3.0% appreciation · 6.62% rent growth · sell at horizon
- IRR
- -11.4%
- Equity multiple
- 0.57×
- Total profit
- $-25,768
- Equity at exit
- $32,057
- IRR
- 2.5%
- Equity multiple
- 1.21×
- Total profit
- $12,548
- Equity at exit
- $18,589
Cash invested: $60,200 (down + closing). Projections, not guarantees.
Landlord ↔ Tenant lean methodology
- Overall (STATE)
- 27 Tenant-Leaning
- State Connecticut
- 27 Tenant-Leaning · D+7
- County
- — inherits STATE
- City
- — inherits STATE
ZIP-level market 06360
- Home prices YoY
- -19.9%
- Rents YoY
- 6.6%
- Active inventory
- 243
- Price-to-rent
- 9.1×
Monthly cashflow live
- Estimated rent
- $1,958 high interval (Pro) →
- Mortgage (P&I)
- −$1,127
- Tax from tax record
- −$304 /mo · $3,654/yr
- Insurance
- −$90
- HOA
- −$0
- Vacancy / Maint / Mgmt
- −$411
- Net cashflow
- $26
Break-even live
Sensitivity live
| Price | -10% $147 | -5% $86 | +0% $26 | +5% $-35 | +10% $-96 |
|---|---|---|---|---|---|
| Rent | -10% $-129 | -5% $-52 | +0% $26 | +5% $103 | +10% $180 |
| Rate | -1.0pp $134 | -0.5pp $80 | base $26 | +0.5pp $-30 | +1.0pp $-87 |
UW: 25.0% down · 7.5% · 30yr · 1.5% tax · 5.0% vac · 8.0% maint · 8.0% mgmt
Financing live
Cash to close
- Down payment
- $53,750
- Closing costs
- $6,450
- Reserves months
- —
- Total cash needed
- —
Loan-product check · same deal, 3 products live
Conventional
25% down · 7.5% · 30yr
- Down + closing
- —
- Monthly P&I
- —
- Monthly cashflow
- —
- DSCR
- —
- Eligible?
- —
Personal DTI + credit; lowest rate.
DSCR
20% down · 8.5% · 30yr
- Down + closing
- —
- Monthly P&I
- —
- Monthly cashflow
- —
- DSCR
- —
- Eligible?
- —
No personal income docs; deal must DSCR.
Hard money
10% down · 12.0% · 12mo
- Down + closing
- —
- Monthly P&I
- —
- Monthly cashflow
- —
- DSCR
- —
- Eligible?
- —
Short-term bridge; refi at stabilization.
Rent comps 6 comps
| Address | Beds | Baths | Sqft | Rent | $/sqft | DOM | Units | Dist |
|---|---|---|---|---|---|---|---|---|
| 25 Wawecus Hill Rd Norwich, CT | 2.0 | 1.0 | 825 | $2,000 | $2.42 | 15d | 1 | 0.62mi |
| 73 Peck St Unit 2 Norwich, CT | 2.0 | 1.5 | 900 | $1,475 | $1.64 | 23d | 1 | 0.72mi |
| 43 Dunham St Norwich, CT | 2.0 | 1.0 | 1105 | $1,900 | $1.72 | 46d | 1 | 0.99mi |
| 68 Thermos Ave Unit 212B Norwich, CT | 2.0 | 2.0 | 1171 | $2,300 | $1.96 | 45d | 1 | 1.40mi |
| 204 Thermos Ave Norwich, CT | 2.0 | 2.0 | 1171 | $1,997 | $1.71 | 15d | 1 | 1.40mi |
| 103 Thermos Ave Unit 23A Norwich, CT | 2.0 | 1.0 | 1326 | $1,295 | $0.98 | 23d | 1 | 1.49mi |
Listing history 7 events
-
2026-06-15status $215,000 Under Contract 5 DOM
-
2026-06-15days on market $215,000 Active 5 DOM
-
2026-06-14days on market $215,000 Active 3 DOM
-
2026-06-13status $215,000 Active 2 DOM
-
2026-06-10days on market $215,000 Coming Soon 2 DOM
-
2026-06-09remarks 594-char remark
-
2026-06-09$215,000 Coming Soon 1 DOM
ⓘ Source: listings_history table (triggers on properties + properties_extension) + one-shot
backfill from property_details.listing_events for pre-trigger history.
Tax reassessment forecast CT · Partial reset (capped growth)
- Current annual tax
- $3,654 · $304/mo
- Projected year-2 tax
- $4,128 · $344/mo
- Expected delta
- +$474/yr (+$39/mo · 13.0%)
ⓘ Screening estimate from a state-policy table — verify with the county assessor before closing.
Climate risk First Street
- Flood 1/10 Low FEMA zone X (unshaded) · 0% chance over 30 yrs
- Wildfire 1/10 Low
- Heat 5/10 Major 7 d/yr ≥96°F today · 16 d/yr by 30 yrs out
- Wind 6/10 Major 64% chance of damaging wind over 30 yrs
- Air quality 3/10 Moderate 2 unhealthy d/yr today · 3 by 30 yrs out
Nearby sold comps map
Loading sold comps map…
Walkable amenities ~0.75 mi
Loading nearby amenities…
Taxation est. · year 1
- Rental income
- $23,501
- − Mortgage interest
- −$12,043
- − Property taxes
- −$3,654
- − Insurance
- −$1,075
- − Repairs & maintenance
- −$1,880
- − Management
- −$1,880
- − Depreciation
- −$6,255
- Taxable loss
- −$3,286
- Est. tax savings @ 24.0%
- +$789
- After-tax cash flow
- $1,095/yr
For passive investors: Depreciation is non-cash, so a rental often shows a tax loss while cash-flowing — sheltering income. Rental losses are passive: they offset passive income freely, and up to $25,000/yr can offset ordinary (W-2) income if you actively participate and your MAGI is under $100k (phasing out to $0 by $150k); unused losses carry forward. On sale, claimed depreciation is recaptured at up to 25%, and gains may owe capital-gains tax (a 1031 exchange can defer both). Figures are a year-1 estimate at your 24.0% rate — not tax advice; consult a CPA.
Schools (NCES district)
- District
- Norwich School District
- NCES district ID
- 0903120
- Math proficiency
- 19% ▼ -8.00%
- Reading proficiency
- 29% ▼ -7.00%
- Median HH income
- $50,813
- Composite
- 21.27/100
- National rank
- #8395
- State rank
- #139 of 153 in CT
Livability — Norwich
- Score
- 81/100
- State rank
- #18
- US rank
- #1391
Category grades
Schools grade is shown separately in the Schools card above.
Census & demographics
- Census place
- Norwich, CT
- County
- New London County · 147,197 people
- City population
- 37,216
- Metro
- Norwich-New London, CT
- Population (ZIP)
- 37,216
- Household income
- $65,539
- Rent vs Own
- Severe rent burden
- 1643.0
Population outlook (Southeastern Connecticut County) Hauer SSP2
- By 2040
- 293,442
Race, ethnicity, and origin ACS 2023
- Neighborhood character
- Diverse neighborhood (Simpson 0.63)
- Race & ethnicity
- White 56% Hispanic / Latino 21% Two or more races 12% Black 10% Asian 7%
- Hispanic origin (detail)
- Mexican 3% Puerto Rican 9% Cuban 1% Dominican 3%
- Common ancestry
- Lithuanian 8% Romanian 5% Hispanic 4%
- Foreign-born
- 15% · Canada, China
- Languages at home
- 77% English-only · Spanish 11% French/Haitian/Cajun 4% Chinese 3%
Political lean MEDSL · Southeastern Connecticut
- 2024 margin
- D (+13.0) · D 55.6% · R 42.6% · Other 1.8%
- All cycles
- 2024: D+13.0
Not yet ingested
- Civics
- —
Market trends
- HPI YoY
- ▼ -65.27%
- Current HPI
- 261.8575
- Rent YoY
- ▲ 6.62%
- Metro
- Norwich-New London, CT
- State GDP YoY
- ▲ 1.06%
- F500 in state
- 38
Industry mix (Fortune 500 HQ in CT)
| Industry | F500 HQs | Revenue |
|---|---|---|
| Industrial Machinery | 4 | $38B |
|
||
| Insurance | 3 | $71B |
|
||
| Financial Services | 2 | $25B |
|
||
| Transportation / Logistics | 2 | $18B |
|
||
| Healthcare | 1 | $247B |
|
||
| Telecommunications | 1 | $55B |
|
||
Price history
+216.2% since first listed10 events — show timeline
- 2026-06-09 Coming Soon $215,000 Smart MLS
- 2016-08-15 Sold (Public Records) $77,600 Public Records
- 2016-08-15 Sold (MLS) $77,600 Smart MLS
- 2016-04-27 Listing Removed — Smart MLS
- 2015-07-31 Listed $77,600 Smart MLS
- 2010-10-30 Listing Removed — Smart MLS
- 2010-06-07 Listing Removed — Smart MLS
- 2010-06-07 Listed $199,900 Smart MLS
- 2010-05-02 Listed $249,900 Smart MLS
- 1997-08-05 Sold (Public Records) $68,000 Public Records
Property tax history
+0.7%/yrLatest (2023): $3,654 · -0.8% YoY. Source: county tax records.
Cash-flow waterfall
monthlySold comps — $/sqft
last 12 mo · ≤1 miLoading sold comps…