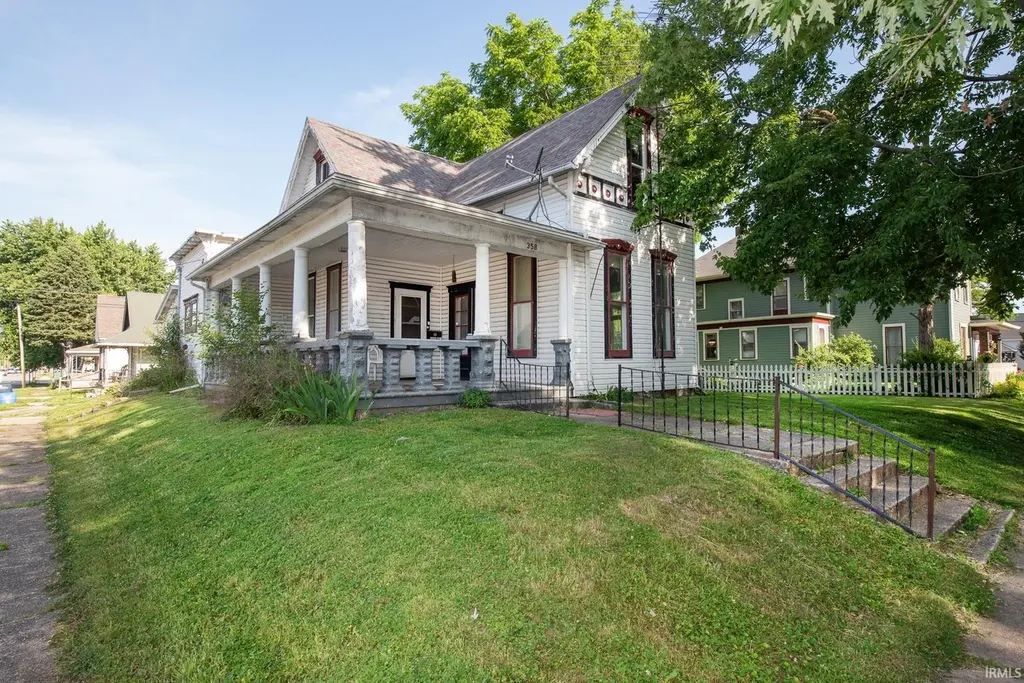
358 S Columbia St · Frankfort, IN
Flood risk 1/10 · Minimal
- FEMA flood zone
- X (unshaded)
- Chance of flooding over 30 yrs
- 0.0%
- Est. flood insurance / yr
- $507 – $1,088
Fire risk 1/10 · Minimal
- Est. fire insurance / yr
- $717 – $1,331
Heat risk 3/10 · Minor
- Hot days now (above 101°F)
- 7 days/yr
- Hot days in 30 yrs
- 18 days/yr
Wind risk 2/10 · Minimal
- Chance of severe wind over 30 yrs
- —
Air-quality risk 3/10 · Minor
- Unhealthy air days now
- 2 days/yr
- Unhealthy air days in 30 yrs
- 3 days/yr
Risk factors via First Street. Map © Google.
Why this score? — see what drove the C- grade
The composite is a weighted blend of 9 inputs, each scored 0–100. Each bar is that input's sub-score; the figure is the points it added to the 100-point composite (weight × sub-score).
- Cash flow +15.1/30.0
- ARV discount +15.0/15.0
- DSCR +4.6/10.0
- 1% rule +4.2/10.0
- Livability +3.7/5.0
- Rent growth +2.5/5.0
- Condition / age +2.5/5.0
- Schools +2.4/10.0
- Appreciation +0.0/10.0
$109,000
🖨 Deal sheet (PDF) 📄 Offer letter ✓ Due diligence
Listing remarks
Exciting opportunity with major updates already completed! Renovations have begun and include all-new flooring, refinished hardwood floors, a brand-new furnace and ductwork ready for future central A/C, an updated walk-in shower, new lower kitchen cabinets, and updated plumbing. Located on a corner lot just a short walk from downtown amenities, this home is ready for its next owner to complete the finishing touches and make it their own. Shared garage with the rear neighboring property. Cash or conventional financing only. Sold as-is.
Key facts
- All-new flooring
- Brand-new furnace
- Updated plumbing
Tags
Property features AI
Exterior
- Parking: Attached garage (1 car)
- Utilities: Public water; Public sewer; Public power
- Home design: Single-family residence (site-built); One story; Vinyl and wood siding
- Construction: Asphalt shingle roof
- Exterior features: Patio; Corner, level lot
Interior
- Kitchen: Eat-in kitchen; Laminate counters
- Bathrooms: One full bathroom (main level)
- Heating & cooling: Natural gas heating; Hot water heating; No cooling system
- Interior features: Eat-in kitchen; Laminate counters; Crawl space basement; Dining room fireplace (1 total)
- Laundry & utility: Main level laundry with electric dryer hookup; Gas water heater
Neighborhood map
What this means for you Summary
Snapshot
- This is a 4-bed/1.0-bath single-family listed at $109k.
Deal economics
- At list price, monthly cash flow is $37 ($441/yr) — positive.
- The deal already cash-flows at list — no discount required.
- To meet the 1% rule (rent ≥ 1% of price), the offer needs to be $100k (8.3% below list).
- Recommended offer: $100k (8.3% below list) — sets the bar for 1% rule.
- Cap rate 6.7% vs local median 3.9% in Frankfort — top-decile yield for the area; either an underpriced asset or a hidden risk that comps aren't pricing in. Stress-test before assuming the spread holds.
Location & tenants
- Location reads 73/100 on livability (#107 in IN) — a middle-class / working-renter tenant base. Strengths: crime A+, cost of living A+, housing A+; Watch: amenities F, commute F, employment D-.
- Community Schools Of Frankfort (rural): math 27% / reading 30% proficiency, ranked #251 of 301 in IN (top 83%) — low school quality limits family demand, transient renter base, plan for 1-2y turnover; 68% free/reduced lunch — lower-income household profile, screen leases tightly.
- Zoned schools: Frankfort Middle School (math 19% / reading 27%, grade F, #263 of 330 statewide, top 80%, 706 students, 83% FRL); Frankfort High School (math 8% / reading 42%, grade F, #323 of 369 statewide, top 88%, 895 students, 75% FRL).
- Market conditions: 129 active listings in the ZIP; 1 comparable units currently listed for rent nearby; 59 units permitted in Clinton County in 2024 (0 in 5+ unit buildings).
Forward outlook
- Local home prices are declining (-3.0%/yr); year-one equity from $754 of loan paydown is wiped out by about $3k of value loss. Plan a longer hold.
- Clinton County population projected at -15% by 2050 — secular population decline; favor cash flow + early exit over multi-decade hold.
Negotiation context
- It's been on market 15 days — a 2% lower offer ($107k) is reasonable based on typical stale-listing flexibility.
- 2 sale attempts with the ask held roughly flat each time — persistent listings suggest the price (not the market) is what's stuck; bring a comps-based counter.
Risks & watch-outs
- Watch-outs: built in 1870 — expect roof / HVAC / electrical / plumbing capex.
Questions for the listing agent
- Built in 1870 — when were the roof, HVAC, electrical panel, plumbing, and water heater last replaced?
- Is there a deadline driving the sale (1031 exchange, divorce, estate, relocation)? That informs how much negotiation room exists.
- Schools are F-rated, which usually means shorter tenancies and higher turnover. Who's the typical renter profile here, and what's been the actual vacancy rate?
- What's the average days-on-market for RENTAL listings here right now (not sales)? A rising rental-DOM trend means longer vacancies and softer asking-rent achievability than the comps imply.
- What's the recent tenant-quality profile in this submarket — average credit score on applications, eviction rate, late-payment / NSF rate, and stable-employment percentage? A property-management company in the area should have these aggregated.
- How much new for-sale + rental construction is in the pipeline within 1–3 miles? Heavy new supply typically softens prices + rents 12–24 months out; constrained supply supports both.
Investment metrics
- 1% rule
- 0.92% ✗
- Cap rate
- 6.70%
- Cash-on-cash
- 1.44%
- DSCR
- 1.06
- GRM
- 9.1
CMA / ARV
- ARV (on-the-fly)
- $211,456
- Comps found
- 12
Show comp detail 12 sales within ~0.75 mi
| Address | Dist | Beds/Ba | Sqft | Sold | Price | $/sf | Match |
|---|---|---|---|---|---|---|---|
| 862 S Jackson St. St | 0.34mi | 3/1.0 (-1) | 1,538 (-7%) | 0mo | $197,000 | $128 | 68 |
| 853 S Columbia St | 0.31mi | 3/1.0 (-1) | 1,508 (-9%) | 0mo | $175,000 | $116 | 66 |
| 708 Glendale Dr | 0.51mi | 4/2.0 | 1,602 (-3%) | 4mo | $204,000 | $127 | 64 |
| 855 E Washington St | 0.61mi | 3/1.5 (-1) | 1,656 (+0%) | 1mo | $185,000 | $112 | 63 |
| 1002 Short 4th St | 0.47mi | 3/1.0 (-1) | 1,747 (+6%) | 2mo | $133,500 | $76 | 62 |
| 754 John St | 0.63mi | 3/2.0 (-1) | 1,632 (-1%) | 2mo | $215,000 | $132 | 58 |
| 1004 E South St | 0.67mi | 3/2.0 (-1) | 1,634 (-1%) | 1mo | $307,400 | $188 | 57 |
| 461 W Morrison St | 0.41mi | 3/2.0 (-1) | 1,436 (-13%) | 1mo | $200,000 | $139 | 49 |
| 1079 E Wabash St | 0.70mi | 3/2.0 (-1) | 1,589 (-4%) | 5mo | $307,400 | $193 | 48 |
| 1058 E South St | 0.70mi | 3/2.0 (-1) | 1,739 (+5%) | 4mo | $307,000 | $177 | 46 |
| 601 S Clay St | 0.38mi | 3/2.0 (-1) | 1,894 (+15%) | 3mo | $163,500 | $86 | 46 |
| 1008 Homewood Drive Dr | 0.68mi | 3/2.0 (-1) | 1,783 (+8%) | 1mo | $188,000 | $105 | 45 |
Match score weights: distance 35% · size 25% · config 20% · recency 20%. Top-matched comps best support the ARV.
Projected returns pro-forma
-3.0% appreciation · 3.0% rent growth · sell at horizon
- IRR
- -14.0%
- Equity multiple
- 0.50×
- Total profit
- $-15,309
- Equity at exit
- $16,252
- IRR
- -5.1%
- Equity multiple
- 0.66×
- Total profit
- $-10,257
- Equity at exit
- $9,424
Cash invested: $30,520 (down + closing). Projections, not guarantees.
Landlord ↔ Tenant lean methodology
- Overall (STATE)
- 90 Strongly Landlord-Friendly
- State Indiana
- 90 Strongly Landlord-Friendly · R+11
- County
- — inherits STATE
- City
- — inherits STATE
ZIP-level market 46041
- Home prices YoY
- -17.8%
- Active inventory
- 129
- Price-to-rent
- 9.1×
Monthly cashflow live
- Estimated rent
- $1,000 medium interval (Pro) →
- Mortgage (P&I)
- −$572
- Tax est. 1.5%
- −$136 /mo · $1,635/yr
- Insurance
- −$45
- HOA
- −$0
- Vacancy / Maint / Mgmt
- −$210
- Net cashflow
- $37
Break-even live
Sensitivity live
| Price | -10% $112 | -5% $74 | +0% $37 | +5% $-1 | +10% $-39 |
|---|---|---|---|---|---|
| Rent | -10% $-42 | -5% $-3 | +0% $37 | +5% $76 | +10% $116 |
| Rate | -1.0pp $92 | -0.5pp $64 | base $37 | +0.5pp $8 | +1.0pp $-20 |
UW: 25.0% down · 7.5% · 30yr · 1.5% tax · 5.0% vac · 8.0% maint · 8.0% mgmt
Financing live
Cash to close
- Down payment
- $27,250
- Closing costs
- $3,270
- Reserves months
- —
- Total cash needed
- —
Loan-product check · same deal, 3 products live
Conventional
25% down · 7.5% · 30yr
- Down + closing
- —
- Monthly P&I
- —
- Monthly cashflow
- —
- DSCR
- —
- Eligible?
- —
Personal DTI + credit; lowest rate.
DSCR
20% down · 8.5% · 30yr
- Down + closing
- —
- Monthly P&I
- —
- Monthly cashflow
- —
- DSCR
- —
- Eligible?
- —
No personal income docs; deal must DSCR.
Hard money
10% down · 12.0% · 12mo
- Down + closing
- —
- Monthly P&I
- —
- Monthly cashflow
- —
- DSCR
- —
- Eligible?
- —
Short-term bridge; refi at stabilization.
Rent comps 1 comps
| Address | Beds | Baths | Sqft | Rent | $/sqft | DOM | Units | Dist |
|---|---|---|---|---|---|---|---|---|
| 402 E Green St Frankfort, IN | 3.0 | 1.0 | 1100 | $1,000 | $0.91 | 44d | 1 | 0.75mi |
Listing history 12 events
-
2026-06-21days on market $109,000 Active 15 DOM
-
2026-06-18days on market $109,000 Active 13 DOM
-
2026-06-17days on market $109,000 Active 12 DOM
-
2026-06-16days on market $109,000 Active 11 DOM
-
2026-06-15days on market $109,000 Active 10 DOM
-
2026-06-13days on market $109,000 Active 8 DOM
-
2026-06-12days on market $109,000 Active 7 DOM
-
2026-06-09days on market $109,000 Active 4 DOM
-
2026-06-08days on market $109,000 Active 3 DOM
-
2026-06-07days on market $109,000 Active 2 DOM
-
2026-06-07remarks 540-char remark
-
2026-06-07$109,000 Active 1 DOM
ⓘ Source: listings_history table (triggers on properties + properties_extension) + one-shot
backfill from property_details.listing_events for pre-trigger history.
Climate risk First Street
- Flood 1/10 Low FEMA zone X (unshaded) · 0% chance over 30 yrs
- Wildfire 1/10 Low
- Heat 3/10 Moderate 7 d/yr ≥101°F today · 18 d/yr by 30 yrs out
- Wind 2/10 Low
- Air quality 3/10 Moderate 2 unhealthy d/yr today · 3 by 30 yrs out
Nearby sold comps map
Loading sold comps map…
Walkable amenities ~0.75 mi
Loading nearby amenities…
Taxation est. · year 1
- Rental income
- $12,000
- − Mortgage interest
- −$6,106
- − Property taxes
- −$1,635
- − Insurance
- −$545
- − Repairs & maintenance
- −$960
- − Management
- −$960
- − Depreciation
- −$3,171
- Taxable loss
- −$1,377
- Est. tax savings @ 24.0%
- +$330
- After-tax cash flow
- $771/yr
For passive investors: Depreciation is non-cash, so a rental often shows a tax loss while cash-flowing — sheltering income. Rental losses are passive: they offset passive income freely, and up to $25,000/yr can offset ordinary (W-2) income if you actively participate and your MAGI is under $100k (phasing out to $0 by $150k); unused losses carry forward. On sale, claimed depreciation is recaptured at up to 25%, and gains may owe capital-gains tax (a 1031 exchange can defer both). Figures are a year-1 estimate at your 24.0% rate — not tax advice; consult a CPA.
Schools (NCES district)
- District
- Community Schools Of Frankfort
- NCES district ID
- 1803660
- Math proficiency
- 27% ▼ -3.00%
- Reading proficiency
- 30% ▼ -6.00%
- Median HH income
- $42,144
- Composite
- 24.2/100
- National rank
- #7728
- State rank
- #251 of 301 in IN
Livability — Frankfort
- Score
- 73/100
- State rank
- #107
- US rank
- #5623
Category grades
Schools grade is shown separately in the Schools card above.
Census & demographics
- Census place
- Frankfort, IN
- Population (ZIP)
- 23,359
Population outlook (Clinton County) Hauer SSP2
- Today (2025)
- 31,197 people
- By 2030
- 30,257 · -3.0%
- By 2040
- 28,383 · -9.0%
- By 2050
- 26,644 · -14.6%
- By 2075
- 23,858 · -23.5%
- By 2100
- 22,236 · -28.7%
Race, ethnicity, and origin ACS 2023
- Neighborhood character
- Predominantly White (73%)
- Race & ethnicity
- White 73% Hispanic / Latino 24% Two or more races 11%
- Hispanic origin (detail)
- Mexican 22%
- Common ancestry
- Iranian 1% Italian 1% Slovak 1%
- Foreign-born
- 11% · Canada, Philippines
- Languages at home
- 86% English-only · Spanish 14%
Political lean MEDSL · Clinton
- 2024 margin
- Solid R (+48.0) · D 25.2% · R 73.2% · Other 1.6%
- 2008→2024 swing
- -35.0pp toward R · 2008: -13.0pp · 2024: -48.0pp
- All cycles
- 2024: R+48.0 2020: R+46.1 2016: R+48.0 2012: R+30.7 2008: R+13.0
Not yet ingested
- Civics
- —
Market trends
- HPI YoY
- ▼ -57.02%
- Current HPI
- 263.2258
- Rent YoY
- —
- Metro
- —
- State GDP YoY
- ▲ 2.90%
- F500 in state
- 18
Industry mix (Fortune 500 HQ in IN)
| Industry | F500 HQs | Revenue |
|---|---|---|
| Industrial Machinery | 2 | $37B |
|
||
| Healthcare | 1 | $177B |
|
||
| Pharmaceuticals | 1 | $45B |
|
||
| Metals / Steel | 1 | $18B |
|
||
| Agriculture | 1 | $17B |
|
||
| Packaging | 1 | $12B |
|
||
Price history
+36.4% since first listed2 events — show timeline
- 2026-06-04 Listed $109,000 IRMLS
- 2025-11-24 Listed $79,900 IRMLS
Property tax history
+9.1%/yrLatest (2024): $30 · +100.0% YoY. Source: county tax records.
Cash-flow waterfall
monthlySold comps — $/sqft
last 12 mo · ≤1 miLoading sold comps…