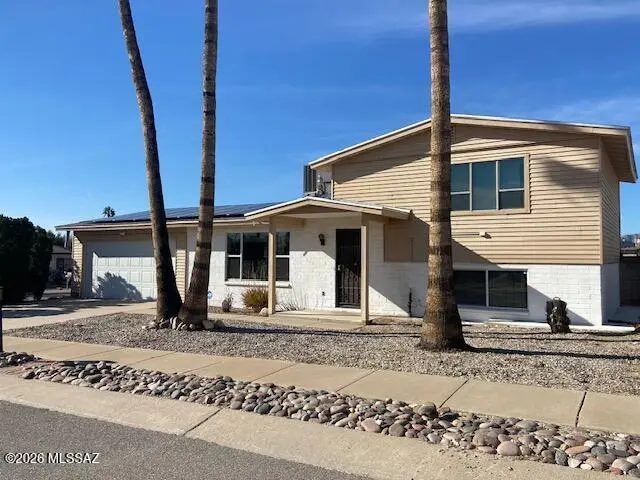
3862 W North Aire Pl · Casas Adobes, AZ
Flood risk 1/10 · Minimal
- FEMA flood zone
- X (unshaded)
- Chance of flooding over 30 yrs
- 0.0%
- Est. flood insurance / yr
- $507 – $1,088
Fire risk 5/10 · Moderate
- Est. fire insurance / yr
- $610 – $1,132
Heat risk 8/10 · Major
- Hot days now (above 107°F)
- 6 days/yr
- Hot days in 30 yrs
- 16 days/yr
Wind risk 1/10 · Minimal
- Chance of severe wind over 30 yrs
- —
Air-quality risk 1/10 · Minimal
- Unhealthy air days now
- 0 days/yr
- Unhealthy air days in 30 yrs
- 0 days/yr
Risk factors via First Street. Map © Google.
Why this score? — see what drove the D grade
The composite is a weighted blend of 9 inputs, each scored 0–100. Each bar is that input's sub-score; the figure is the points it added to the 100-point composite (weight × sub-score).
- ARV discount +15.0/15.0
- Cash flow +10.0/30.0
- Livability +4.0/5.0
- Schools +3.1/10.0
- Rent growth +3.0/5.0
- DSCR +2.9/10.0
- Condition / age +2.5/5.0
- 1% rule +2.3/10.0
- Appreciation +0.0/10.0
$264,000
🖨 Deal sheet (PDF) 📄 Offer letter ✓ Due diligence
Listing remarks MLS
Lovely, well maintained home. This 3 bedroom, 2 bath split-level home is located in northwest Tucson on a large cul-de-sac lot with NO HOA! Open & spacious with eat in area. Large master bedroom, dual pane windows, new roof, solar water heater, reverse osmosis water filter and softener. Pebbletec on pool with easy care and RV parking!. Close to shopping and I10.
Key facts
- Pool
- Granite counters
- Corner lot
Tags
Property features AI
Finance
- Other: Zoned Pima County - CR3
- HOA & community: Paved street and sidewalks
Exterior
- Parking: Attached 2-car garage (covered)
- Utilities: Water from a water company; Sewer connected; Phone service connected
- Home design: Single-family residence; Multi/split level; South-facing
- Construction: Block and siding construction; Shingle roof
- Exterior features: Covered patio/porch; Shed(s); Subdivided lot; Corner lot; North/South exposure; Paved road; City-maintained road; Paved street and sidewalks in the community
Interior
- Kitchen: Dishwasher; Microwave
- Flooring: Carpet; Ceramic tile; Laminate
- Bathrooms: 2 full bathrooms
- Heating & cooling: Gas pack heating; Central air conditioning
- Interior features: Walk-in closet(s)
- Laundry & utility: Laundry room
Neighborhood map
What this means for you Summary
Snapshot
- This is a 3-bed/2.0-bath single-family listed at $264k.
Deal economics
- At list price, monthly cash flow is $-157 ($-2k/yr) — negative.
- To cash-flow at today's rent, offer at most $236k (10.5% below list).
- To meet the 1% rule (rent ≥ 1% of price), the offer needs to be $193k (26.7% below list).
- Recommended offer: $193k (26.7% below list) — sets the bar for 1% rule.
- Cap rate 5.6% vs local median 3.5% in Casas Adobes — top-decile yield for the area; either an underpriced asset or a hidden risk that comps aren't pricing in. Stress-test before assuming the spread holds.
Location & tenants
- Location reads 79/100 on livability (#8 in AZ, #2,353 nationally) — a middle-class / working-renter tenant base. Strengths: housing A+, health & safety A, employment B+; Watch: amenities D.
- Marana Unified District (4404) (suburban): math 31% / reading 37% proficiency, ranked #83 of 249 in AZ (top 33%) — families likely to look elsewhere, expect single-tenant / working-renter base with shorter leases.
- Zoned schools: Butterfield Elementary School (math 33% / reading 35%, grade F, #490 of 1,109 statewide, top 45%, 480 students, 56% FRL); Tortolita Middle School (math 19% / reading 27%, grade F, #116 of 218 statewide, top 54%, 539 students, 45% FRL); Mountain View High School (math 24% / reading 30%, grade F, #141 of 381 statewide, top 38%, 1,831 students, 32% FRL).
- Market conditions: Rents rising (+1.9%/yr); 92 active listings in the ZIP; 40 comparable units currently listed for rent nearby; rentals at typical pace (median 26d on market — plan ~3-4 weeks tenant-placement turnaround); 40% of comp listings sitting > 30 days — soft ceiling on asking rent; solid renter incomes; 5,268 units permitted in Pima County in 2024 (996 in 5+ unit buildings).
- This rent runs 30% of the median local income ($76k/yr) — at the standard rent-burdened threshold; future hikes will face affordability resistance.
Forward outlook
- Local home prices are declining (-3.0%/yr); year-one equity from $2k of loan paydown is wiped out by about $8k of value loss. Plan a longer hold.
- Pima County population projected at +8% by 2050 — modest demand growth; plan on rents tracking national, not racing it.
Negotiation context
- It's been on market 47 days — a 3% lower offer ($256k) is reasonable based on typical stale-listing flexibility.
- 7 sale attempts since 16y ago with the ask held roughly flat each time — persistent listings suggest the price (not the market) is what's stuck; bring a comps-based counter.
Risks & watch-outs
- Climate carrying-cost: moderate wildfire risk; extreme-heat days projected 6→16/yr by 2055 (HVAC capex compounding) — expect insurance premiums to compound above CPI over the hold.
Questions for the listing agent
- What do current leases actually rent for vs. the listed asking? Can we see a recent rent roll and the last 12 months of T-12 income?
- It's been on market 47 days. Have you received any prior offers? Is the seller open to a 27% concession, seller financing, or rate buy-down credit?
- Built in 1973 — when were the roof, HVAC, electrical panel, plumbing, and water heater last replaced?
- Is there a deadline driving the sale (1031 exchange, divorce, estate, relocation)? That informs how much negotiation room exists.
- The area grade is low — what's the realistic commute time and amenity access for the typical tenant pool here? Any planned neighborhood developments (good or bad) we should know about?
- What's the average days-on-market for RENTAL listings here right now (not sales)? A rising rental-DOM trend means longer vacancies and softer asking-rent achievability than the comps imply.
- What's the recent tenant-quality profile in this submarket — average credit score on applications, eviction rate, late-payment / NSF rate, and stable-employment percentage? A property-management company in the area should have these aggregated.
- How much new for-sale + rental construction is in the pipeline within 1–3 miles? Heavy new supply typically softens prices + rents 12–24 months out; constrained supply supports both.
Investment metrics
- 1% rule
- 0.73% ✗
- Cap rate
- 5.58%
- Cash-on-cash
- -2.56%
- DSCR
- 0.89
- GRM
- 11.4
CMA / ARV
- ARV (median comp)
- $336,099
- List price
- $264,000
- Delta
- -21.45%
- Verdict
- UNDERPRICED
- Comps
- 20 within 1.0 mi
Show comp detail 12 sales within ~0.75 mi
| Address | Dist | Beds/Ba | Sqft | Sold | Price | $/sf | Match |
|---|---|---|---|---|---|---|---|
| 4011 W Gentle Pl | 0.30mi | 3/2.0 | 1,400 (+1%) | 3mo | $375,000 | $268 | 82 |
| 3371 W Eunice St | 0.57mi | 3/2.0 | 1,401 (+1%) | 1mo | $295,000 | $211 | 71 |
| 3343 W Marlene St | 0.69mi | 3/2.0 | 1,398 (+1%) | 1mo | $359,000 | $257 | 66 |
| 3885 W Mars St | 0.38mi | 3/2.0 | 1,504 (+9%) | 4mo | $315,000 | $209 | 65 |
| 3401 W Evening Star Ct | 0.70mi | 3/2.0 | 1,347 (-3%) | 3mo | $317,900 | $236 | 60 |
| 8300 N Bayou Dr | 0.70mi | 3/2.0 | 1,351 (-2%) | 4mo | $299,900 | $222 | 60 |
| 4080 W Magee Rd | 0.39mi | 3/2.0 | 1,571 (+13%) | 1mo | $325,000 | $207 | 59 |
| 4471 W Rose Mist Way | 0.74mi | 3/2.0 | 1,308 (-6%) | 2mo | $305,000 | $233 | 55 |
| 3671 W Meadow Briar Dr | 0.51mi | 3/2.0 | 1,552 (+12%) | 3mo | $348,000 | $224 | 53 |
| 7768 N Barque Pl | 0.57mi | 2/1.0 (-1) | 1,287 (-7%) | 3mo | $290,000 | $225 | 50 |
| 7877 N Rockwood Pl | 0.68mi | 3/2.0 | 1,559 (+13%) | 3mo | $330,000 | $212 | 45 |
| 4331 W Placita De Christina | 0.71mi | 4/1.5 (+1) | 1,502 (+8%) | 2mo | $150,000 | $100 | 44 |
Match score weights: distance 35% · size 25% · config 20% · recency 20%. Top-matched comps best support the ARV.
Projected returns pro-forma
-3.0% appreciation · 1.88% rent growth · sell at horizon
- IRR
- -21.7%
- Equity multiple
- 0.26×
- Total profit
- $-55,020
- Equity at exit
- $39,363
- IRR
- -18.2%
- Equity multiple
- 0.06×
- Total profit
- $-69,701
- Equity at exit
- $22,826
Cash invested: $73,920 (down + closing). Projections, not guarantees.
Landlord ↔ Tenant lean methodology
- Overall (STATE)
- 87 Strongly Landlord-Friendly
- State Arizona
- 87 Strongly Landlord-Friendly · R+3
- County
- — inherits STATE
- City
- — inherits STATE
ZIP-level market 85741
- Rents YoY
- 1.9%
- Active inventory
- 92
- Price-to-rent
- 11.4×
Monthly cashflow live
- Estimated rent
- $1,934 high interval (Pro) →
- Mortgage (P&I)
- −$1,384
- Tax from tax record
- −$191 /mo · $2,295/yr
- Insurance
- −$110
- HOA
- −$0
- Vacancy / Maint / Mgmt
- −$406
- Net cashflow
- $-157
Break-even live
Sensitivity live
| Price | -10% $-8 | -5% $-83 | +0% $-157 | +5% $-232 | +10% $-307 |
|---|---|---|---|---|---|
| Rent | -10% $-310 | -5% $-234 | +0% $-157 | +5% $-81 | +10% $-5 |
| Rate | -1.0pp $-25 | -0.5pp $-90 | base $-157 | +0.5pp $-226 | +1.0pp $-295 |
UW: 25.0% down · 7.5% · 30yr · 1.5% tax · 5.0% vac · 8.0% maint · 8.0% mgmt
Financing live
Cash to close
- Down payment
- $66,000
- Closing costs
- $7,920
- Reserves months
- —
- Total cash needed
- —
Loan-product check · same deal, 3 products live
Conventional
25% down · 7.5% · 30yr
- Down + closing
- —
- Monthly P&I
- —
- Monthly cashflow
- —
- DSCR
- —
- Eligible?
- —
Personal DTI + credit; lowest rate.
DSCR
20% down · 8.5% · 30yr
- Down + closing
- —
- Monthly P&I
- —
- Monthly cashflow
- —
- DSCR
- —
- Eligible?
- —
No personal income docs; deal must DSCR.
Hard money
10% down · 12.0% · 12mo
- Down + closing
- —
- Monthly P&I
- —
- Monthly cashflow
- —
- DSCR
- —
- Eligible?
- —
Short-term bridge; refi at stabilization.
Rent comps 40 comps
| Address | Beds | Baths | Sqft | Rent | $/sqft | DOM | Units | Dist |
|---|---|---|---|---|---|---|---|---|
| 3627 W Suffield Ln Tucson, AZ | 2.0 | 1.0 | 1282 | $1,900 | $1.48 | 5d | 1 | 0.32mi |
| 3505 W Alana Ln Tucson, AZ | 3.0 | 2.0 | 1500 | $1,800 | $1.20 | 4d | 1 | 0.40mi |
| 8064 N Bayou Dr Tucson, AZ | 3.0 | 2.0 | 1623 | $2,500 | $1.54 | 5d | 1 | 0.48mi |
| 7490 N Thornwood Rd Tucson, AZ | 3.0 | 2.0 | 1600 | $2,000 | $1.25 | 45d | 1 | 0.51mi |
| 7800 N Nicole Pl Tucson, AZ | 3.0 | 2.0 | 1494 | $1,850 | $1.24 | 45d | 1 | 0.56mi |
| 4313 W Bunk House Rd Tucson, AZ | 4.0 | 3.0 | 1870 | $1,975 | $1.06 | 45d | 1 | 0.59mi |
| 3812 W Goshen Dr Tucson, AZ | 3.0–4.0 | 2.5 | 1735 | $1,925 | $1.11 | 45d | 2 | 0.63mi |
| 3780 W Goshen Dr Tucson, AZ | 3.0 | 2.5 | 1735 | $1,925 | $1.11 | 45d | 1 | 0.65mi |
| 7290 N Oldfather Dr Tucson, AZ | 2.0–3.0 | 2.5 | 1260 | $2,025 | $1.61 | 3d | 9 | 0.67mi |
| 7290 N Oldfather Rd Unit 404 Tucson, AZ | 3.0 | 2.5 | 1321 | $1,825 | $1.38 | 23d | 1 | 0.68mi |
| 7290 N Oldfather Rd Unit 101 Tucson, AZ | 3.0 | 2.5 | 1276 | $1,699 | $1.33 | 5d | 1 | 0.70mi |
| 7290 N Oldfather Rd Unit 702 Tucson, AZ | 2.0 | 2.5 | 1200 | $1,925 | $1.60 | 19d | 1 | 0.70mi |
| 3869 W Cortaro Farms Rd Tucson, AZ | 1.0–2.0 | 1.0–2.0 | 800 | $1,630 | $2.04 | 5d | 1 | 0.70mi |
| 3415 W Simone St Tucson, AZ | 3.0 | 2.0 | 1418 | $1,925 | $1.36 | 45d | 1 | 0.73mi |
| 8224 N Camino de la Viola Tucson, AZ | 3.0 | 2.0 | 1805 | $2,095 | $1.16 | 45d | 1 | 0.74mi |
| 3534 W Goshen Dr Tucson, AZ | 4.0 | 2.5 | 1862 | $2,195 | $1.18 | 5d | 1 | 0.80mi |
| 4510 W Sun Quest St Tucson, AZ | 3.0 | 2.0 | 1177 | $2,800 | $2.38 | 3d | 1 | 0.80mi |
| 3313 W Millstone Pl Tucson, AZ | 3.0 | 2.0 | 1347 | $1,595 | $1.18 | 25d | 1 | 0.80mi |
| 4524 W Jupiter St Tucson, AZ | 3.0 | 2.0 | 1245 | $1,845 | $1.48 | 45d | 1 | 0.82mi |
| 8441 N Thornydale Rd Oro Valley, AZ | 3.0 | 2.5 | 1735 | $2,050 | $1.18 | 5d | 1 | 0.85mi |
| 3346 W Starfall Pl Tucson, AZ | 2.0 | 2.0 | 1033 | $1,700 | $1.65 | 5d | 1 | 0.86mi |
| 8305 N Midnight Way Tucson, AZ | 2.0 | 2.0 | 1486 | $1,595 | $1.07 | 16d | 1 | 0.88mi |
| 8555 N Thornydale Rd Oro Valley, AZ | 3.0 | 2.5 | 1735 | $2,000 | $1.15 | 45d | 1 | 0.88mi |
| 4398 W Veranda St Tucson, AZ | 3.0 | 2.0 | 1368 | $1,820 | $1.33 | 4d | 1 | 0.94mi |
| 4050 W Aerie Dr Tucson, AZ | 1.0–2.0 | 1.0–2.0 | 800 | $1,954 | $2.44 | 3d | 17 | 0.97mi |
| 3220 W Ina Rd Tucson, AZ | 2.0 | 2.0 | 1070 | $1,730 | $1.62 | 45d | 1 | 1.03mi |
| 3220 W Ina Rd Tucson, AZ | 3.0 | 2.0 | 1180 | $1,871 | $1.59 | 46d | 1 | 1.03mi |
| 3220 W Ina Rd Tucson, AZ | 3.0 | 2.0 | 1180 | $1,848 | $1.57 | 13d | 1 | 1.03mi |
| 7406 N Boston Pl Tucson, AZ | 3.0 | 1.0 | 1095 | $1,750 | $1.60 | 25d | 1 | 1.03mi |
| 8455 N Placita de la Manzana Tucson, AZ | 3.0 | 2.5 | 1627 | $1,825 | $1.12 | 45d | 1 | 1.10mi |
| 3294 W Treece Pl Tucson, AZ | 3.0 | 1.5 | 1295 | $1,750 | $1.35 | 25d | 1 | 1.11mi |
| 3248 W Treece Pl Tucson, AZ | 3.0 | 2.0 | 1295 | $1,745 | $1.35 | 16d | 1 | 1.12mi |
| 8323 N Shannon Rd Tucson, AZ | 2.0 | 2.0 | 1293 | $1,755 | $1.36 | 45d | 1 | 1.13mi |
| 8323 N Shannon Rd Tucson, AZ | 3.0 | 2.0 | 1655 | $2,110 | $1.27 | 23d | 1 | 1.13mi |
| 4105 W Aerie Dr Tucson, AZ | 1.0–3.0 | 1.0–2.0 | 1257 | $4,300 | $3.42 | 3d | 24 | 1.14mi |
| 3201 W Ina Rd Tucson, AZ | 1.0–3.0 | 1.0–2.0 | 803 | $1,895 | $2.36 | 45d | 34 | 1.14mi |
| 3777 W Horizon Hills Dr Tucson, AZ | 3.0 | 2.0 | 1263 | $1,750 | $1.39 | 25d | 1 | 1.24mi |
| 8704 N Frampton Pl Tucson, AZ | 3.0 | 2.0 | 1409 | $1,750 | $1.24 | 45d | 1 | 1.32mi |
| 3213 W Northstar Dr Tucson, AZ | 4.0 | 2.0 | 1270 | $1,800 | $1.42 | 45d | 1 | 1.33mi |
| 3073 W Placita Montessa Tucson, AZ | 3.0 | 2.0 | 1479 | $1,900 | $1.28 | 25d | 1 | 1.33mi |
Listing history 36 events
-
2026-06-21days on market $264,000 Active 47 DOM
-
2026-06-18days on market $264,000 Active 44 DOM
-
2026-06-17days on market $264,000 Active 43 DOM
-
2026-06-16days on market $264,000 Active 42 DOM
-
2026-06-15days on market $264,000 Active 41 DOM
-
2026-06-13days on market $264,000 Active 39 DOM
-
2026-06-13days on market $264,000 Active 38 DOM
-
2026-06-10days on market $264,000 Active 36 DOM
-
2026-06-09days on market $264,000 Active 35 DOM
-
2026-06-08pricedays on market $264,000 Active 34 DOM
-
2026-06-07days on market $277,000 Active 33 DOM
-
2026-06-05days on market $277,000 Active 30 DOM
-
2026-06-03days on market $277,000 Active 29 DOM
-
2026-06-02days on market $277,000 Active 28 DOM
-
2026-06-01days on market $277,000 Active 27 DOM
-
2026-05-31days on market $277,000 Active 26 DOM
-
2026-05-03$277,000 Active 290-char remark
-
2025-07-01historical $1,795
-
2025-04-22price $1,795
-
2025-04-05$1,800
-
2025-04-03historical $1,800
-
2025-03-25$1,800
-
2025-03-25historical $1,800
-
2025-03-07price $1,800
-
2025-02-17price $1,850
-
2025-01-21$1,975
-
2024-12-31historical
-
2024-12-12$360,000 Active
-
2021-02-23soldstatus $233,500 Closed
Show marketing remark (368 chars)
Lovely, well maintained home. This 3 bedroom, 2 bath split-level home is located in northwest Tucson on a large cul-de-sac lot with NO HOA! Open & spacious with eat in area. Large master bedroom, dual pane windows, new roof, solar water heater, reverse osmosis water filter and softener. Pebbletec on pool with easy care and RV parking!. Close to shopping and I10.
-
2021-02-23soldstatus $233,500
Show marketing remark (368 chars)
Lovely, well maintained home. This 3 bedroom, 2 bath split-level home is located in northwest Tucson on a large cul-de-sac lot with NO HOA! Open & spacious with eat in area. Large master bedroom, dual pane windows, new roof, solar water heater, reverse osmosis water filter and softener. Pebbletec on pool with easy care and RV parking!. Close to shopping and I10.
-
2021-01-05historical Active Contingent
Show marketing remark (368 chars)
Lovely, well maintained home. This 3 bedroom, 2 bath split-level home is located in northwest Tucson on a large cul-de-sac lot with NO HOA! Open & spacious with eat in area. Large master bedroom, dual pane windows, new roof, solar water heater, reverse osmosis water filter and softener. Pebbletec on pool with easy care and RV parking!. Close to shopping and I10.
-
2020-12-09$240,000 Active
Show marketing remark (368 chars)
Lovely, well maintained home. This 3 bedroom, 2 bath split-level home is located in northwest Tucson on a large cul-de-sac lot with NO HOA! Open & spacious with eat in area. Large master bedroom, dual pane windows, new roof, solar water heater, reverse osmosis water filter and softener. Pebbletec on pool with easy care and RV parking!. Close to shopping and I10.
-
2010-04-01soldstatus $145,000
-
2010-04-01soldstatus $145,000
-
2010-02-09$149,000
-
1973-10-01soldstatus $26,755
ⓘ Source: listings_history table (triggers on properties + properties_extension) + one-shot
backfill from property_details.listing_events for pre-trigger history.
Tax reassessment forecast AZ · Resets to sale price
- Current annual tax
- $2,295 · $191/mo
- Projected year-2 tax
- $2,295 · $191/mo
- Expected delta
- $0/yr ($0/mo · 0.0%)
ⓘ Screening estimate from a state-policy table — verify with the county assessor before closing.
Climate risk First Street
- Flood 1/10 Low FEMA zone X (unshaded) · 0% chance over 30 yrs
- Wildfire 5/10 Major
- Heat 8/10 Severe 6 d/yr ≥107°F today · 16 d/yr by 30 yrs out
- Wind 1/10 Low
- Air quality 1/10 Low 0 unhealthy d/yr today · 0 by 30 yrs out
Nearby sold comps map
Loading sold comps map…
Walkable amenities ~0.75 mi
Loading nearby amenities…
Taxation est. · year 1
- Rental income
- $23,213
- − Mortgage interest
- −$14,788
- − Property taxes
- −$2,295
- − Insurance
- −$1,320
- − Repairs & maintenance
- −$1,857
- − Management
- −$1,857
- − Depreciation
- −$7,680
- Taxable loss
- −$6,584
- Est. tax savings @ 24.0%
- +$1,580
- After-tax cash flow
- $-309/yr
For passive investors: Depreciation is non-cash, so a rental often shows a tax loss while cash-flowing — sheltering income. Rental losses are passive: they offset passive income freely, and up to $25,000/yr can offset ordinary (W-2) income if you actively participate and your MAGI is under $100k (phasing out to $0 by $150k); unused losses carry forward. On sale, claimed depreciation is recaptured at up to 25%, and gains may owe capital-gains tax (a 1031 exchange can defer both). Figures are a year-1 estimate at your 24.0% rate — not tax advice; consult a CPA.
Schools (NCES district)
- District
- Marana Unified District (4404)
- NCES district ID
- 0404630
- Math proficiency
- 31% ▼ -11.00%
- Reading proficiency
- 37% ▼ -5.00%
- Median HH income
- $65,282
- Composite
- 30.96/100
- National rank
- #6103
- State rank
- #83 of 249 in AZ
Livability — Casas Adobes
- Score
- 79/100
- State rank
- #8
- US rank
- #2353
Category grades
Schools grade is shown separately in the Schools card above.
Census & demographics
- Census place
- Casas Adobes, AZ
- County
- Pima County · 1,012,107 people
- City population
- 67,940
- Metro
- Tucson, AZ
- Population (ZIP)
- 33,679
- Household income
- $76,271
- Rent vs Own
- Severe rent burden
- 1242.0
Population outlook (Pima County) Hauer SSP2
- Today (2025)
- 1,066,056 people
- By 2030
- 1,086,684 · +1.9%
- By 2040
- 1,117,160 · +4.8%
- By 2050
- 1,149,778 · +7.9%
- By 2075
- 1,271,480 · +19.3%
- By 2100
- 1,321,160 · +23.9%
Race, ethnicity, and origin ACS 2023
- Neighborhood character
- Diverse neighborhood (Simpson 0.62)
- Race & ethnicity
- White 53% Hispanic / Latino 31% Two or more races 21% Asian 5% Black 3% Native American 2%
- Hispanic origin (detail)
- Mexican 26% Puerto Rican 2%
- Common ancestry
- Italian 3% Romanian 3% Slovak 2%
- Foreign-born
- 10% · Canada, China, Jamaica
- Languages at home
- 81% English-only · Spanish 14% Chinese 1% Vietnamese 1%
Political lean MEDSL · Pima
- 2024 margin
- D (+15.2) · D 57.0% · R 41.8% · Other 1.2%
- 2008→2024 swing
- +9.1pp toward D · 2008: 6.1pp · 2024: 15.2pp
- All cycles
- 2024: D+15.2 2020: D+18.7 2016: D+13.5 2012: D+5.8 2008: D+6.1
Not yet ingested
- Civics
- —
Market trends
- HPI YoY
- ▼ -254.77%
- Current HPI
- 275.8273
- Rent YoY
- ▲ 1.88%
- Metro
- Tucson, AZ
- State GDP YoY
- ▲ 4.54%
- F500 in state
- 20
Industry mix (Fortune 500 HQ in AZ)
| Industry | F500 HQs | Revenue |
|---|---|---|
| Technology | 2 | $13B |
|
||
| Mining / Metals | 1 | $23B |
|
||
| Environmental Services | 1 | $16B |
|
||
| Metals / Steel | 1 | $14B |
|
||
| Technology Distribution | 1 | $9B |
|
||
| Homebuilding | 1 | $8B |
|
||
Price history
+886.7% since first listed21 events — show timeline
- 2026-06-08 Price Changed $264,000 MLSSAZ
- 2026-05-03 Listed $277,000 MLSSAZ
- 2025-07-01 Rental Removed $1,795 TARMLS
- 2025-04-22 Price Changed $1,795 TARMLS
- 2025-04-05 Listed for Rent $1,800 TARMLS
- 2025-04-03 Rental Removed $1,800 TARMLS
- 2025-03-25 Listed for Rent $1,800 TARMLS
- 2025-03-25 Rental Removed $1,800 APPFOLIO
- 2025-03-07 Price Changed $1,800 APPFOLIO
- 2025-02-17 Price Changed $1,850 APPFOLIO
- 2025-01-21 Listed for Rent $1,975 APPFOLIO
- 2024-12-31 Listing Removed — MLSSAZ
- 2024-12-12 Listed $360,000 MLSSAZ
- 2021-02-23 Sold (Public Records) $233,500 Public Records
- 2021-02-23 Sold (MLS) $233,500 MLSSAZ
- 2021-01-05 Contingent — MLSSAZ
- 2020-12-09 Listed $240,000 MLSSAZ
- 2010-04-01 Sold (Public Records) $145,000 Public Records
- 2010-04-01 Sold (MLS) $145,000 MLSSAZ
- 2010-02-09 Listed $149,000 MLSSAZ
- 1973-10-01 Sold (Public Records) $26,755 Public Records
Property tax history
+4.6%/yrLatest (2025): $2,295 · +5.1% YoY. Source: county tax records.
Cash-flow waterfall
monthlySold comps — $/sqft
last 12 mo · ≤1 miLoading sold comps…